Secure Logistics Market Report Scope & Overview:
Get More Information on Secure logistics Market - Request Sample Report
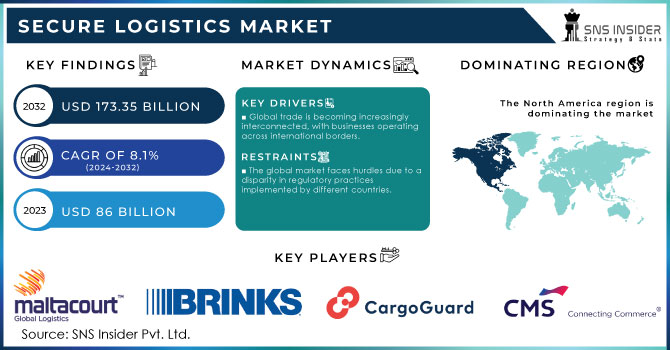
The Secure Logistics Market Size was valued at USD 86 billion in 2023 and is projected to reach USD 173.35 billion by 2032 growing at a CAGR of 8.1% from 2024 to 2032.
The secure logistics market is poised for healthy growth as globalization and complex supply chains create a demand for safeguarding valuable goods. With increased risks of theft and breaches across borders, businesses require secure transport and storage solutions.
This trend is fueled by trade agreements like the India-Australia ECTA (India-Australia Economic Cooperation and Trade Agreement), which is expected to significantly boost bilateral trade, fostering new employment opportunities and promoting the overall well-being of both Indian and Australian citizens. Leading players like G4S and Gardaworld, holding a combined 13.5% market share, are fortifying their positions through advanced technologies strategic partnerships, workforce development, and expansion into emerging markets. By complying with regulations and offering diverse services, these companies are building resilience in the ever-changing secure logistics landscape.
MARKET DYNAMICS
KEY DRIVERS:
Global trade is becoming increasingly interconnected, with businesses operating across international borders.
The transportation industry is experiencing a significant increase in the movement of high-value goods.
The e-commerce boom and faster delivery demands are fueling the need for secure transport. Companies are investing in secure logistics solutions to safeguard valuable goods from theft, damage, and other threats. Advanced technologies like GPS tracking, RFID tags, and smart lockers are gaining traction, providing real-time monitoring and enhanced security throughout the entire transportation journey.
RESTRAINTS:
A security lapse resulted in the unauthorized access of sensitive data.
The global market faces hurdles due to a disparity in regulatory practices implemented by different countries.
The secure logistics industry faces a challenge such as a patchwork of regulations across different countries. This inconsistent regulatory landscape creates confusion for global logistics providers, who struggle to determine the legal requirements for each market they operate in. This complexity translates to higher operational costs and acts as a barrier to entry for companies seeking to expand into new territories.
OPPORTUNITY:
High-tech solutions like IoT, GPS, real-time tracking, and data analysis are driving the secure logistics market forward.
The secure and transparent nature of blockchain technology is making it a popular choice for applications within the logistics industry.
Logistics companies are increasingly turning to blockchain technology for its unique security features. This tamper-proof system creates an unchangeable record of every transaction and movement within a supply chain. This transparency translates to enhanced security, reduced fraud risk, and improved traceability all critical factors for high-value or sensitive goods.
CHALLENGES:
The adoption of cutting-edge security solutions can present a significant financial hurdle for logistics companies
Cutting-edge surveillance systems, secure storage facilities, and advanced tracking technologies are the guardians of valuable goods, but they can also be a financial burden. This can be a major obstacle for smaller businesses or those in cost-sensitive industries, potentially slowing down the adoption of these essential security measures.
The ever-increasing intricacies of secure logistics operations pose a significant challenge for the industry.
IMPACT OF RUSSIA UKRAINE WAR
The war in Ukraine disrupts secure logistics in the Black Sea, a critical trade route for vital goods. Ports in the region struggles with import surges and labor shortages, hindering efficient operations. The ripple effects of the conflict are felt globally as well. Shipping routes are lengthened due to sanctions imposed on Russia, forcing vessels to take longer journeys. This, in turn, disrupts established trade patterns and adds uncertainty to the already complex task of securing cargo during transport. Furthermore, the war has contributed to a rise in the number of ships operating as a "dark fleet." These vessels operate outside regulations, often lacking proper insurance and maintenance, raising concerns about safety and security standards across the board. While the overall impact on global trade volume hasn't been drastic yet, the war in Ukraine undeniably adds a layer of complexity and uncertainty to secure logistics. The long-term consequences could potentially affect costs, routes, and overall efficiency within the secure logistics market.
IMPACT OF ECONOMIC SLOWDOWN
As demand for goods fluctuates, businesses may cut back on orders, leading to potential stock surpluses and strained supplier relationships. This, coupled with rising material costs, could force secure logistics companies to adjust their pricing strategies. Additionally, reduced revenue due to lower demand might push companies to hold onto existing stock, impacting cash flow and potentially delaying investments in security upgrades.
KEY MARKET SEGMENTS
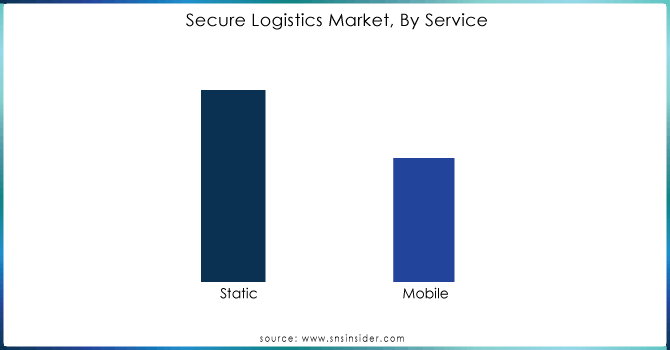
By Service
Static
Mobile
Static security dominates with nearly 60% market share due to the growing need for robust protection of valuable assets throughout storage and transport. Complex global supply chains and the rise of high-value industries like pharmaceuticals and electronics are driving the demand for these services. Static security solutions offer constant monitoring and robust safeguards, mitigating risks and ensuring peace of mind.
Get More Information on Secure Logistics Market - Enquiry Now
By Mode of Transportation
Roadways
Railways
Airways
Waterways
Roadways segment domiantes in secure logistics market, holding the top spot in market share. Trucks are the kings of the road because of their flexibility and ability to get deliveries done securely. Advanced GPS, real-time tracking systems, and well-established safety protocols further solidify road's dominance as the go-to mode for secure transport. Air cargo takes flight with fastest growth due to speed for valuable goods. Secure logistics providers ensure top-notch screening, facilities, and compliance.
By Application
Cash management
Precious metals
Confidential documents
Sensitive electronics
Others
Cash management holds dominance in the market with over 40.5% market share, when it comes to secure transport. The need to safeguard valuable currency from theft or loss fuels the cash management segment, with armored vehicles, GPS tracking, and real-time monitoring keeping cash safe on the move. As physical currency remains important in many sectors, secure cash management logistics are essential to ensure financial stability and minimize risk.
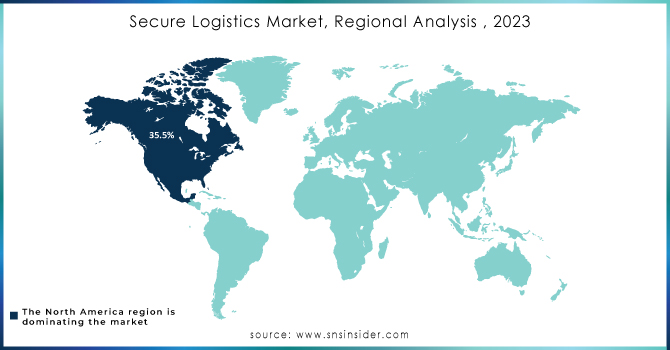
REGIONAL ANALYSIS
North America dominates in secure logistics market, holding a dominant 35.5% market share. This dominance due to a powerful combination of factors. The region boasts a strong economy, extensive cross-border trade, and a thriving high-tech sector, all of which necessitate secure transportation and storage solutions for valuable goods like pharmaceuticals and electronics. Furthermore, strict regulations and rising security concerns compel businesses to invest in secure logistics to ensure compliance and safeguard against threats. Finally, the ongoing adoption of technologies like IoT and real-time tracking keeps the North American secure logistics market at the forefront of innovation, perfectly positioned to meet the ever-changing security demands of the region.
Europe’s’ dominance is fueled by a growing network of ATMs, booming cash circulation, and frequent trade between European countries all create a strong demand for secure transport and storage solutions. Trade policies and lingering Brexit issues could shift the landscape, while the rise of electronic payments in some countries might pose a challenge.
The Asia Pacific secure logistics market is poised for explosive growth. Several factors are fueling this takeoff that are a surge in demand for ATMs, the expansion of financial institutions, and a relentless battle against cargo theft. Governments and industry leaders are taking a proactive stance against theft through initiatives like Australia's RAFT project and the collaborative TAPA forum.
REGIONAL COVERAGE:
North America
US
Canada
Mexico
Europe
Eastern Europe
Poland
Romania
Hungary
Turkey
Rest of Eastern Europe
Western Europe
Germany
France
UK
Italy
Spain
Netherlands
Switzerland
Austria
Rest of Western Europe
Asia Pacific
China
India
Japan
South Korea
Vietnam
Singapore
Australia
Rest of Asia Pacific
Middle East & Africa
Middle East
UAE
Egypt
Saudi Arabia
Qatar
Rest of Middle East
Africa
Nigeria
South Africa
Rest of Africa
Latin America
Brazil
Argentina
Colombia
Rest of Latin America
Key players
Some of the major players in the Secure Logistics Market are CMS Info Systems (CMS), CargoGuard, Brink’s Incorporated, Lemuir Group, PlanITROI, Inc., Maltacourt, Prosegur, Allied Universal, Securitas AB, G4S Limited, Loomis AB, GardaWorld, SIS Group Enterprise , SECURE LOGISTICS LLC And Others Players.
RECENT DEVELOPMENTS
Industry leaders, Prosegur Cash and Armaguard, joined forces in June 2023 by merging their Australian cash management operations. This significant move consolidates cash transportation, management, technical services, and ATM networks, solidifying the future of cash as a secure and cost-efficient payment option for both businesses and consumers in Australia.
Securitas bolstered its partnership with Microsoft in July 2023 by signing a new, five-year agreement to safeguard data centers across 31 countries.
GardaWorld Security Systems ups its commitment to cutting-edge security solutions by partnering with Artificial Intelligence Technology Solutions (AITX) in July 2023. This collaboration brings RAD's (AITX's subsidiary) security products to GardaWorld's customers across Canada.
| Report Attributes | Details |
|---|---|
| Market Size in 2023 | US$ 86 Bn |
| Market Size by 2032 | US$ 173.35 Bn |
| CAGR | CAGR of 8.1% From 2024 to 2032 |
| Base Year | 2023 |
| Forecast Period | 2024-2032 |
| Historical Data | 2020-2022 |
| Report Scope & Coverage | Market Size, Segments Analysis, Competitive Landscape, Regional Analysis, DROC & SWOT Analysis, Forecast Outlook |
| Key Segments | • By Service(Static, Mobile) • By Mode Of Transportation(Roadways, Railways, Airways, Waterways) • By Application(Cash Management, Precious Metals, Confidential Documents, Sensitive Electronics, Others) |
| Regional Analysis/Coverage | North America (US, Canada, Mexico), Europe (Eastern Europe [Poland, Romania, Hungary, Turkey, Rest of Eastern Europe] Western Europe] Germany, France, UK, Italy, Spain, Netherlands, Switzerland, Austria, Rest of Western Europe]), Asia Pacific (China, India, Japan, South Korea, Vietnam, Singapore, Australia, Rest of Asia Pacific), Middle East & Africa (Middle East [UAE, Egypt, Saudi Arabia, Qatar, Rest of Middle East], Africa [Nigeria, South Africa, Rest of Africa], Latin America (Brazil, Argentina, Colombia Rest of Latin America) |
| Company Profiles | CMS Info Systems (CMS), CargoGuard, Brink’s Incorporated, Lemuir Group, PlanITROI, Inc., Maltacourt, Prosegur, Allied Universal, Securitas AB, G4S Limited, Loomis AB, GardaWorld, SIS Group Enterprise , SECURE LOGISTICS LLC |
| Key Drivers | • Global trade is becoming increasingly interconnected, with businesses operating across international borders. • The transportation industry is experiencing a significant increase in the movement of high-value goods. |
| Key Restraints | • A security lapse resulted in the unauthorized access of sensitive data. • The global market faces hurdles due to a disparity in regulatory practices implemented by different countries. |
Ans: The Secure Logistics Market is expected to grow at a CAGR of 8.1%.
Ans: Secure Logistics Market size was USD 86 billion in 2023 and is expected to Reach USD 160.36 billion by 2031.
Ans: Global trade is becoming increasingly interconnected, with businesses operating across international borders.
Ans: The global market faces hurdles due to a disparity in regulatory practices implemented by different countries.
Ans: North America holds the dominant position with market share of 35.5
TABLE OF CONTENTS
1. Introduction
1.1 Market Definition
1.2 Scope
1.3 Research Assumptions
2. Industry Flowchart
3. Research Methodology
4. Market Dynamics
4.1 Drivers
4.2 Restraints
4.3 Opportunities
4.4 Challenges
5. Impact Analysis
5.1 Impact of Russia-Ukraine Crisis
5.2 Impact of Economic Slowdown on Major Countries
5.2.1 Introduction
5.2.2 United States
5.2.3 Canada
5.2.4 Germany
5.2.5 France
5.2.6 UK
5.2.7 China
5.2.8 Japan
5.2.9 South Korea
5.2.10 India
6. Value Chain Analysis
7. Porter’s 5 Forces Model
8. Pest Analysis
9. Secure Logistics Market Segmentation, By Service
9.1 Introduction
9.2 Trend Analysis
9.3 Static
9.4 Mobile
10. Secure Logistics Market Segmentation, By Mode of Transportation
10.1 Introduction
10.2 Trend Analysis
10.3 Roadways
10.4 Railways
10.5 Airways
10.6 Waterways
11. Secure Logistics Market Segmentation, By Application
11.1 Introduction
11.2 Trend Analysis
11.3 Cash management
11.4 Precious metals
11.5 Confidential documents
11.6 Sensitive electronics
11.7 Others
12. Regional Analysis
12.1 Introduction
12.2 North America
12.2.1 Trend Analysis
12.2.2 North America Secure Logistics Market by Country
12.2.3 North America Secure Logistics Market By Service
12.2.4 North America Secure Logistics Market By Mode of Transportation
12.2.5 North America Secure Logistics Market By Application
12.2.6 USA
12.2.6.1 USA Secure Logistics Market By Service
12.2.6.2 USA Secure Logistics Market By Mode of Transportation
12.2.6.3 USA Secure Logistics Market By Application
12.2.7 Canada
12.2.7.1 Canada Secure Logistics Market By Service
12.2.7.2 Canada Secure Logistics Market By Mode of Transportation
12.2.7.3 Canada Secure Logistics Market By Application
12.2.8 Mexico
12.2.8.1 Mexico Secure Logistics Market By Service
12.2.8.2 Mexico Secure Logistics Market By Mode of Transportation
12.2.8.3 Mexico Secure Logistics Market By Application
12.3 Europe
12.3.1 Trend Analysis
12.3.2 Eastern Europe
12.3.2.1 Eastern Europe Secure Logistics Market by Country
12.3.2.2 Eastern Europe Secure Logistics Market By Service
12.3.2.3 Eastern Europe Secure Logistics Market By Mode of Transportation
12.3.2.4 Eastern Europe Secure Logistics Market By Application
12.3.2.5 Poland
12.3.2.5.1 Poland Secure Logistics Market By Service
12.3.2.5.2 Poland Secure Logistics Market By Mode of Transportation
12.3.2.5.3 Poland Secure Logistics Market By Application
12.3.2.6 Romania
12.3.2.6.1 Romania Secure Logistics Market By Service
12.3.2.6.2 Romania Secure Logistics Market By Mode of Transportation
12.3.2.6.4 Romania Secure Logistics Market By Application
12.3.2.7 Hungary
12.3.2.7.1 Hungary Secure Logistics Market By Service
12.3.2.7.2 Hungary Secure Logistics Market By Mode of Transportation
12.3.2.7.3 Hungary Secure Logistics Market By Application
12.3.2.8 Turkey
12.3.2.8.1 Turkey Secure Logistics Market By Service
12.3.2.8.2 Turkey Secure Logistics Market By Mode of Transportation
12.3.2.8.3 Turkey Secure Logistics Market By Application
12.3.2.9 Rest of Eastern Europe
12.3.2.9.1 Rest of Eastern Europe Secure Logistics Market By Service
12.3.2.9.2 Rest of Eastern Europe Secure Logistics Market By Mode of Transportation
12.3.2.9.3 Rest of Eastern Europe Secure Logistics Market By Application
12.3.3 Western Europe
12.3.3.1 Western Europe Secure Logistics Market by Country
12.3.3.2 Western Europe Secure Logistics Market By Service
12.3.3.3 Western Europe Secure Logistics Market By Mode of Transportation
12.3.3.4 Western Europe Secure Logistics Market By Application
12.3.3.5 Germany
12.3.3.5.1 Germany Secure Logistics Market By Service
12.3.3.5.2 Germany Secure Logistics Market By Mode of Transportation
12.3.3.5.3 Germany Secure Logistics Market By Application
12.3.3.6 France
12.3.3.6.1 France Secure Logistics Market By Service
12.3.3.6.2 France Secure Logistics Market By Mode of Transportation
12.3.3.6.3 France Secure Logistics Market By Application
12.3.3.7 UK
12.3.3.7.1 UK Secure Logistics Market By Service
12.3.3.7.2 UK Secure Logistics Market By Mode of Transportation
12.3.3.7.3 UK Secure Logistics Market By Application
12.3.3.8 Italy
12.3.3.8.1 Italy Secure Logistics Market By Service
12.3.3.8.2 Italy Secure Logistics Market By Mode of Transportation
12.3.3.8.3 Italy Secure Logistics Market By Application
12.3.3.9 Spain
12.3.3.9.1 Spain Secure Logistics Market By Service
12.3.3.9.2 Spain Secure Logistics Market By Mode of Transportation
12.3.3.9.3 Spain Secure Logistics Market By Application
12.3.3.10 Netherlands
12.3.3.10.1 Netherlands Secure Logistics Market By Service
12.3.3.10.2 Netherlands Secure Logistics Market By Mode of Transportation
12.3.3.10.3 Netherlands Secure Logistics Market By Application
12.3.3.11 Switzerland
12.3.3.11.1 Switzerland Secure Logistics Market By Service
12.3.3.11.2 Switzerland Secure Logistics Market By Mode of Transportation
12.3.3.11.3 Switzerland Secure Logistics Market By Application
12.3.3.1.12 Austria
12.3.3.12.1 Austria Secure Logistics Market By Service
12.3.3.12.2 Austria Secure Logistics Market By Mode of Transportation
12.3.3.12.3 Austria Secure Logistics Market By Application
12.3.3.13 Rest of Western Europe
12.3.3.13.1 Rest of Western Europe Secure Logistics Market By Service
12.3.3.13.2 Rest of Western Europe Secure Logistics Market By Mode of Transportation
12.3.3.13.3 Rest of Western Europe Secure Logistics Market By Application
12.4 Asia-Pacific
12.4.1 Trend Analysis
12.4.2 Asia-Pacific Secure Logistics Market by Country
12.4.3 Asia-Pacific Secure Logistics Market By Service
12.4.4 Asia-Pacific Secure Logistics Market By Mode of Transportation
12.4.5 Asia-Pacific Secure Logistics Market By Application
12.4.6 China
12.4.6.1 China Secure Logistics Market By Service
12.4.6.2 China Secure Logistics Market By Mode of Transportation
12.4.6.3 China Secure Logistics Market By Application
12.4.7 India
12.4.7.1 India Secure Logistics Market By Service
12.4.7.2 India Secure Logistics Market By Mode of Transportation
12.4.7.3 India Secure Logistics Market By Application
12.4.8 Japan
12.4.8.1 Japan Secure Logistics Market By Service
12.4.8.2 Japan Secure Logistics Market By Mode of Transportation
12.4.8.3 Japan Secure Logistics Market By Application
12.4.9 South Korea
12.4.9.1 South Korea Secure Logistics Market By Service
12.4.9.2 South Korea Secure Logistics Market By Mode of Transportation
12.4.9.3 South Korea Secure Logistics Market By Application
12.4.10 Vietnam
12.4.10.1 Vietnam Secure Logistics Market By Service
12.4.10.2 Vietnam Secure Logistics Market By Mode of Transportation
12.4.10.3 Vietnam Secure Logistics Market By Application
12.4.11 Singapore
12.4.11.1 Singapore Secure Logistics Market By Service
12.4.11.2 Singapore Secure Logistics Market By Mode of Transportation
12.4.11.3 Singapore Secure Logistics Market By Application
12.4.12 Australia
12.4.12.1 Australia Secure Logistics Market By Service
12.4.12.2 Australia Secure Logistics Market By Mode of Transportation
12.4.12.3 Australia Secure Logistics Market By Application
12.4.13 Rest of Asia-Pacific
12.4.13.1 Rest of Asia-Pacific Secure Logistics Market By Service
12.4.13.2 Rest of Asia-Pacific Secure Logistics Market By Mode of Transportation
12.4.13.3 Rest of Asia-Pacific Secure Logistics Market By Application
12.5 Middle East & Africa
12.5.1 Trend Analysis
12.5.2 Middle East
12.5.2.1 Middle East Secure Logistics Market by Country
12.5.2.2 Middle East Secure Logistics Market By Service
12.5.2.3 Middle East Secure Logistics Market By Mode of Transportation
12.5.2.4 Middle East Secure Logistics Market By Application
12.5.2.5 UAE
12.5.2.5.1 UAE Secure Logistics Market By Service
12.5.2.5.2 UAE Secure Logistics Market By Mode of Transportation
12.5.2.5.3 UAE Secure Logistics Market By Application
12.5.2.6 Egypt
12.5.2.6.1 Egypt Secure Logistics Market By Service
12.5.2.6.2 Egypt Secure Logistics Market By Mode of Transportation
12.5.2.6.3 Egypt Secure Logistics Market By Application
12.5.2.7 Saudi Arabia
12.5.2.7.1 Saudi Arabia Secure Logistics Market By Service
12.5.2.7.2 Saudi Arabia Secure Logistics Market By Mode of Transportation
12.5.2.7.3 Saudi Arabia Secure Logistics Market By Application
12.5.2.8 Qatar
12.5.2.8.1 Qatar Secure Logistics Market By Service
12.5.2.8.2 Qatar Secure Logistics Market By Mode of Transportation
12.5.2.8.3 Qatar Secure Logistics Market By Application
12.5.2.9 Rest of Middle East
12.5.2.9.1 Rest of Middle East Secure Logistics Market By Service
12.5.2.9.2 Rest of Middle East Secure Logistics Market By Mode of Transportation
12.5.2.9.3 Rest of Middle East Secure Logistics Market By Application
12.5.3 Africa
12.5.3.1 Africa Secure Logistics Market by Country
12.5.3.2 Africa Secure Logistics Market By Service
12.5.3.3 Africa Secure Logistics Market By Mode of Transportation
12.5.3.4 Africa Secure Logistics Market By Application
12.5.3.5 Nigeria
12.5.3.5.1 Nigeria Secure Logistics Market By Service
12.5.3.5.2 Nigeria Secure Logistics Market By Mode of Transportation
12.5.3.5.3 Nigeria Secure Logistics Market By Application
12.5.3.6 South Africa
12.5.3.6.1 South Africa Secure Logistics Market By Service
12.5.3.6.2 South Africa Secure Logistics Market By Mode of Transportation
12.5.3.6.3 South Africa Secure Logistics Market By Application
12.5.3.7 Rest of Africa
12.5.3.7.1 Rest of Africa Secure Logistics Market By Service
12.5.3.7.2 Rest of Africa Secure Logistics Market By Mode of Transportation
12.5.3.7.3 Rest of Africa Secure Logistics Market By Application
12.6 Latin America
12.6.1 Trend Analysis
12.6.2 Latin America Secure Logistics Market by country
12.6.3 Latin America Secure Logistics Market By Service
12.6.4 Latin America Secure Logistics Market By Mode of Transportation
12.6.5 Latin America Secure Logistics Market By Application
12.6.6 Brazil
12.6.6.1 Brazil Secure Logistics Market By Service
12.6.6.2 Brazil Secure Logistics Market By Mode of Transportation
12.6.6.3 Brazil Secure Logistics Market By Application
12.6.7 Argentina
12.6.7.1 Argentina Secure Logistics Market By Service
12.6.7.2 Argentina Secure Logistics Market By Mode of Transportation
12.6.7.3 Argentina Secure Logistics Market By Application
12.6.8 Colombia
12.6.8.1 Colombia Secure Logistics Market By Service
12.6.8.2 Colombia Secure Logistics Market By Mode of Transportation
12.6.8.3 Colombia Secure Logistics Market By Application
12.6.9 Rest of Latin America
12.6.9.1 Rest of Latin America Secure Logistics Market By Service
12.6.9.2 Rest of Latin America Secure Logistics Market By Mode of Transportation
12.6.9.3 Rest of Latin America Secure Logistics Market By Application
13. Company Profiles
13.1 CMS Info Systems (CMS)
13.1.1 Company Overview
13.1.2 Financial
13.1.3 Products/ Services Offered
13.1.4 SWOT Analysis
13.1.5 The SNS View
13.2 CargoGuard, Brink’s Incorporated
13.2.1 Company Overview
13.2.2 Financial
13.2.3 Products/ Services Offered
13.2.4 SWOT Analysis
13.2.5 The SNS View
13.3 Lemuir Group
13.3.1 Company Overview
13.3.2 Financial
13.3.3 Products/ Services Offered
13.3.4 SWOT Analysis
13.3.5 The SNS View
13.4 PlanITROI, Inc.
13.4.1 Company Overview
13.4.2 Financial
13.4.3 Products/ Services Offered
13.4.4 SWOT Analysis
13.4.5 The SNS View
13.5 Maltacourt
13.5.1 Company Overview
13.5.2 Financial
13.5.3 Products/ Services Offered
13.5.4 SWOT Analysis
13.5.5 The SNS View
13.6 Prosegur
13.6.1 Company Overview
13.6.2 Financial
13.6.3 Products/ Services Offered
13.6.4 SWOT Analysis
13.6.5 The SNS View
13.7 Allied Universal
13.7.1 Company Overview
13.7.2 Financial
13.7.3 Products/ Services Offered
13.7.4 SWOT Analysis
13.7.5 The SNS View
13.8 Securitas AB
13.8.1 Company Overview
13.8.2 Financial
13.8.3 Products/ Services Offered
13.8.4 SWOT Analysis
13.8.5 The SNS View
13.9 G4S Limited
13.9.1 Company Overview
13.9.2 Financial
13.9.3 Products/ Services Offered
13.9.4 SWOT Analysis
13.9.5 The SNS View
13.10 Loomis AB
13.10.1 Company Overview
13.10.2 Financial
13.10.3 Products/ Services Offered
13.10.4 SWOT Analysis
13.10.5 The SNS View
13.11 GardaWorld
13.11.1 Company Overview
13.11.2 Financial
13.11.3 Products/ Services Offered
13.11.4 SWOT Analysis
13.11.5 The SNS View
13.12 SIS Group Enterprise
13.12.1 Company Overview
13.12.2 Financial
13.12.3 Products/ Services Offered
13.12.4 SWOT Analysis
13.12.5 The SNS View
13.13 SECURE LOGISTICS LLC
13.13.1 Company Overview
13.13.2 Financial
13.13.3 Products/ Services Offered
13.13.4 SWOT Analysis
13.13.5 The SNS View
14. Competitive Landscape
14.1 Competitive Benchmarking
14.2 Market Share Analysis
14.3 Recent Developments
14.3.1 Industry News
14.3.2 Company News
14.3.3 Mergers & Acquisitions
15. Use Case and Best Practices
16. Conclusion
An accurate research report requires proper strategizing as well as implementation. There are multiple factors involved in the completion of good and accurate research report and selecting the best methodology to compete the research is the toughest part. Since the research reports we provide play a crucial role in any company’s decision-making process, therefore we at SNS Insider always believe that we should choose the best method which gives us results closer to reality. This allows us to reach at a stage wherein we can provide our clients best and accurate investment to output ratio.
Each report that we prepare takes a timeframe of 350-400 business hours for production. Starting from the selection of titles through a couple of in-depth brain storming session to the final QC process before uploading our titles on our website we dedicate around 350 working hours. The titles are selected based on their current market cap and the foreseen CAGR and growth.
The 5 steps process:
Step 1: Secondary Research:
Secondary Research or Desk Research is as the name suggests is a research process wherein, we collect data through the readily available information. In this process we use various paid and unpaid databases which our team has access to and gather data through the same. This includes examining of listed companies’ annual reports, Journals, SEC filling etc. Apart from this our team has access to various associations across the globe across different industries. Lastly, we have exchange relationships with various university as well as individual libraries.

Step 2: Primary Research
When we talk about primary research, it is a type of study in which the researchers collect relevant data samples directly, rather than relying on previously collected data. This type of research is focused on gaining content specific facts that can be sued to solve specific problems. Since the collected data is fresh and first hand therefore it makes the study more accurate and genuine.
We at SNS Insider have divided Primary Research into 2 parts.
Part 1 wherein we interview the KOLs of major players as well as the upcoming ones across various geographic regions. This allows us to have their view over the market scenario and acts as an important tool to come closer to the accurate market numbers. As many as 45 paid and unpaid primary interviews are taken from both the demand and supply side of the industry to make sure we land at an accurate judgement and analysis of the market.
This step involves the triangulation of data wherein our team analyses the interview transcripts, online survey responses and observation of on filed participants. The below mentioned chart should give a better understanding of the part 1 of the primary interview.

Part 2: In this part of primary research the data collected via secondary research and the part 1 of the primary research is validated with the interviews from individual consultants and subject matter experts.
Consultants are those set of people who have at least 12 years of experience and expertise within the industry whereas Subject Matter Experts are those with at least 15 years of experience behind their back within the same space. The data with the help of two main processes i.e., FGDs (Focused Group Discussions) and IDs (Individual Discussions). This gives us a 3rd party nonbiased primary view of the market scenario making it a more dependable one while collation of the data pointers.
Step 3: Data Bank Validation
Once all the information is collected via primary and secondary sources, we run that information for data validation. At our intelligence centre our research heads track a lot of information related to the market which includes the quarterly reports, the daily stock prices, and other relevant information. Our data bank server gets updated every fortnight and that is how the information which we collected using our primary and secondary information is revalidated in real time.

Step 4: QA/QC Process
After all the data collection and validation our team does a final level of quality check and quality assurance to get rid of any unwanted or undesired mistakes. This might include but not limited to getting rid of the any typos, duplication of numbers or missing of any important information. The people involved in this process include technical content writers, research heads and graphics people. Once this process is completed the title gets uploader on our platform for our clients to read it.
Step 5: Final QC/QA Process:
This is the last process and comes when the client has ordered the study. In this process a final QA/QC is done before the study is emailed to the client. Since we believe in giving our clients a good experience of our research studies, therefore, to make sure that we do not lack at our end in any way humanly possible we do a final round of quality check and then dispatch the study to the client.
The Premade Pouch Packaging Market Size was USD 10.8 billion in 2023 & is projected to reach USD 16.47 billion by 2032 growing at a CAGR of 4.8% by 2024 to 2032
The E-Commerce Packaging Market size was USD 70 billion in 2023 and is expected to Reach USD 162.37 billion by 2032 and grow at a CAGR of 9.8 % over the forecast period of 2024-2032.
The Aluminum Foil Packaging Market size was USD 32.61 billion in 2023 and is expected to Reach USD 46.36 billion by 2031 and grow at a CAGR of 4.5% over the forecast period of 2024-2031.
The Active & Intelligent Packaging Market size was USD 25.59 billion in 2023 and is expected to reach USD 50.61 billion by 2031 and grow at a compound annual growth rate (CAGR) of 8.9 % over the forecast period from 2024 to 2031.
The Frozen Seafood Packaging Market Size was valued at USD 16.23 billion in 2023 and is projected to reach USD 26.06 billion by 2031 and grow at a CAGR of 6.1% over the forecast periods 2024 -2031.
Sugarcane Fiber Packaging Market Size, Share, and Industry Analysis by Type (Tableware, Food Packaging), By Application (Fresh Food, Dry and Frozen Food), By Region and Global Forecast, (2024-2032).

Hi! Click one of our member below to chat on Phone
© 2025 All Rights Reserved by SNS Insider Pvt Ltd


