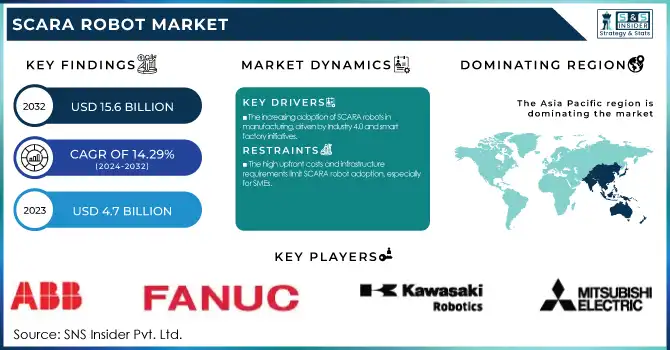
The SCARA Robot Market Size was valued at USD 4.7 Billion in 2023 and is expected to reach USD 15.6 Billion by 2032, growing at a CAGR of 14.29% from 2024-2032.
In 2023, SCARA robot deployment was prominent in automotive, electronics, and pharmaceutical industries, where precision and speed play a crucial role. Advancements in AI-driven automation have significantly enhanced operational efficiency, reducing cycle times and improving accuracy. The integration of SCARA robots into assembly lines has led to a surge in manufacturing throughput, boosting productivity while minimizing errors. Furthermore, supply chain integration metrics underscore the robots' role in smart factories, facilitating real-time tracking, predictive maintenance, and synchronized workflows for enhanced production efficiency.
Get E-PDF Sample Report on SCARA Robot Market - Request Sample Report
Drivers
The increasing adoption of SCARA robots in manufacturing, driven by Industry 4.0 and smart factory initiatives.
The scara robots market is driven by the growing demand for automation in various industries. SCARA robots are being adopted by various industries such as automotive, electronics, and pharmaceutical, for executing precise, fast, and efficient applications in manufacturing and assembly workflow. This demand has been further fueled by the advent of Industry 4.0 as well as smart factory initiatives looking to reduce operational costs while also increasing the output of production. Moreover, predictive maintenance and real-time monitoring delivered through artificial intelligence and the Internet of Things integration will make SCARA robots efficient and cost-effective, leading them to become more mainstream in industrial automation.
Restraints
The high upfront costs and infrastructure requirements limit SCARA robot adoption, especially for SMEs.
Although SCARA robots or Selective Compliance Assembly Robot Arm have the advantages of providing cost-effective automation solutions, their high initial and integration costs also limit their wide-scale adoption. The purchase, installation, and maintenance of these robots comes at an overall cost, which smaller and medium-sized business units simply cannot afford. Inserting SCARA into an existing manufacturing workflow requires dedicated infrastructure and software, as well as further training for manpower to aid in implementing factory automation, all of which can be costly. Nevertheless, industries continue to face obstacles in acclimatizing their existing systems to robotic automation, hence adding to the costs. Although they offer clear savings over time, the initial cost is high and discourages use — particularly among businesses with less leeway in their budgets.
Opportunity
The rising demand for precision automation in electronics and semiconductor manufacturing boosts SCARA robot adoption.
Rising electronics and semiconductor industries offer growth opportunities for the SCARA robots market. With growing demand in consumer electronics, electric vehicles, and smart devices, SCARA robots are deployed by manufacturers for a variety of applications including precision assembly, pick-and-place tasks, and wafer handling. They provide high-speed and precise operation, which is very important in case of handling delicate and intricate manufacturing processes. Similarly, the miniaturization of electronic components and the growing complexity of the circuit board designs are driving the demand for SCARA robotic solutions to deliver advanced automation in electronics production. The likely increase in production volumes would ensure high demand for SCARA robots.
Challenges
The shortage of trained professionals in robotics and automation hinders SCARA robot deployment and efficiency.
A serious challenge the SCARA robots market faces is the need for skilled labor for the programming, operation, and maintenance of such advanced robots. Though automation minimizes labor dependence, the specific configuration and performance optimization of automation necessitate a particular set of skills in robotics, artificial intelligence, and machine learning. This proves a bigger problem; businesses struggle to get the right personnel, resulting in more downtime and higher maintenance costs. Not only that, it also takes a lot of time and money to train employees to work with robotic systems. To address this skill gap, training programs, and collaborations between industry and educational institutions are crucial for the transition and functioning of SCARA robots.
By Payload Capacity
The 5 kg segment dominated the market and accounted for significant revenue share in 2023, as it is applied in industries that demand high speed, precision, and flexibility among goods. From lightweight assembly to material handling and small-part packaging, this category is popular in the electronics, pharmaceuticals, and consumer goods sectors. They provide higher precision and smaller sizes, perfect for constrained spaces where manufacturing is taking place.
The 5-15 kg payload segment is expected to register the fastest CAGR during the forecast period, owing to their increasing adoption in automotive, food & beverage, and logistics industries. Such robots are utilized to assemble mid-sized automotive parts, perform mid-range payloads for food processing plants, and palletize products in warehouses. AI and Machine Learning-based SCARA robots used for mid-weight industrial tasks are realizing the operational efficiency, which in turn is expected to provide immense growth for the SCARA robots market in the forecast period.
By Application
The material handling segment dominated the market and accounted for significant revenue share in 2023, which is primarily focused on the pick-and-place, sorting, palletizing, and depalletizing tasks in various industries due to the extensive use of SCARA robots. This is in high demand, especially for logistics, e-commerce, electronics and automotive industries, where rapid and precise movement of materials is essential to fuse the operations. These improve speed while minimizing human error; it is one of the essentials responsible for warehouse automation and high-speed assembly lines.
The Assembling & disassembling segment is expected to register the fastest CAGR during the forecast period, which is attributed to the growing focus on automating the process in automotive, electronics, and medical device manufacturing. SCARA robots are taking the place of human labor for the detailed assembly of circuit boards, sensors, and microelectronics, as well as components for automobiles. The SCARA robot is gaining traction in this application due to the rapid development of industry 4.0, the emergence of collaborative robots and the need for value-driven manufacturing processes.
By End-Use
The automotive manufacturing segment dominated the market and accounted for significant revenue share in 2023, SCARA robots are widely used in automotive manufacturing for part assembly, quality inspection, welding, as well as parts and material handling. Automakers are investing more and more money for electric vehicles, autonomous driving technologies, and smart factories, and SCARA robots are being integrated to increase production efficiency and maintain manufacturing consistency. Demand is also being driven by the sector's focus on cutting down cycle times and increasing the quality of their products.
The electrical & electronics segment is expected to register the fastest CAGR during the forecast period. They are used specifically for PCB assembly, chip manufacturing, soldering, and semiconductor fabrication. Increasing implementation of consumer electronics, 5G infrastructure, and IoT devices has led to a significant rise in automation demands, which is expected to drive the need for SCARA robots for accurate and high-speed production. The increasing trend of miniaturization of electronic components is another driving factor of this segment.
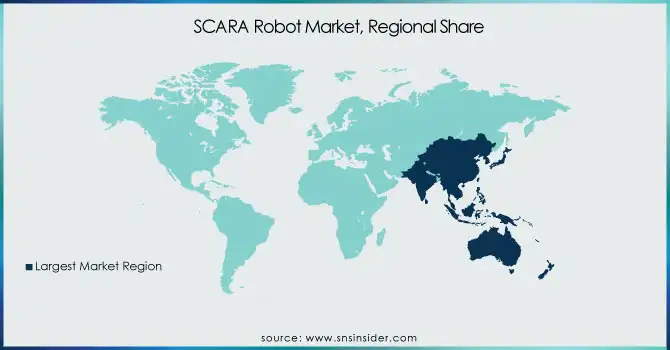
The Asia-Pacific dominated the market and accounted for significant revenue share in 2023. Massive investments in industrial automation, the presence of automotive and electronics manufacturers, and government initiatives promoting smart manufacturing are driving the dominance of the region. With Japan and China having the highest density of industrial robots globally, the Asia-Pacific region is anticipated to hold the largest market share for SCARA robots.
North America is expected to register the fastest CAGR during the forecast period, as rise in adoption of AI-powered robotics, increasing focus on industrial automation, and government support for advanced manufacturing technologies are some of the driving factors for this growth. SCARA robots are being deployed very quickly in the USA in logistics, e-commerce fixtures centers, and semiconductor Processing. The North America market is expected to witness impulsive growth during the forecast period owing to increasing investment by the companies on automation and robotics driven by the AI in the region.
Get Customized Report as Per Your Business Requirement - Request For Customized Report
The major key players along with their products are
ABB Ltd – IRB 910SC
Fanuc Corporation – SR Series
Yaskawa Electric Corporation – Motoman SG Series
KUKA AG – KR SCARA Series
Epson Robots – LS-B Series
Mitsubishi Electric Corporation – RH Series
Omron Corporation – i4L SCARA
Stäubli International AG– TS2 SCARA Series
DENSO Corporation (DENSO Robotics)– HS Series
Kawasaki Robotics (Kawasaki Heavy Industries, Ltd.)– RS Series
Yamaha Motor Co., Ltd. – YK-XG Series
Nachi-Fujikoshi Corp. – EZ SCARA Series
Toshiba Machine Co., Ltd. – THE Series
HIWIN Technologies Corp. – RA Series
Delta Electronics, Inc. – DRS60L Series
January 2024 – Fanuc Corporation: Launched a new SCARA robot series with enhanced AI-powered vision systems to improve precision and speed in assembly operations.
March 2024 – ABB Robotics: Expanded its SCARA robot lineup with energy-efficient models designed for sustainable manufacturing.
May 2024 – Yaskawa Electric Corporation: Announced a strategic partnership with NVIDIA to develop AI-powered collaborative robot solutions.
Report Attributes | Details |
---|---|
Market Size in 2023 | USD 4.7 Billion |
Market Size by 2032 | USD 15.6 Billion |
CAGR | CAGR of 14.29% From 2024 to 2032 |
Base Year | 2023 |
Forecast Period | 2024-2032 |
Historical Data | 2020-2022 |
Report Scope & Coverage | Market Size, Segments Analysis, Competitive Landscape, Regional Analysis, DROC & SWOT Analysis, Forecast Outlook |
Key Segments | • By Payload Capacity (Up to 5 kg, 5-15 kg, Above 15 kg) • By Application (Material Handling, Assembling & Disassembling, Welding & Soldering, Dispensing, Processing) • By End-User (Automotive, Metal & Machinery, Rubber & Plastic, Food & Beverage, Electrical & Electronics, Consumer Goods, Pharmaceuticals & Medical Devices, Others) • By Industry (Banking, Financial Services & Insurance (BFSI), Retail & Consumer Goods, Healthcare, Education, Manufacturing, Travel & Hospitality, Others) |
Regional Analysis/Coverage | North America (US, Canada, Mexico), Europe (Eastern Europe [Poland, Romania, Hungary, Turkey, Rest of Eastern Europe] Western Europe] Germany, France, UK, Italy, Spain, Netherlands, Switzerland, Austria, Rest of Western Europe]), Asia Pacific (China, India, Japan, South Korea, Vietnam, Singapore, Australia, Rest of Asia Pacific), Middle East & Africa (Middle East [UAE, Egypt, Saudi Arabia, Qatar, Rest of Middle East], Africa [Nigeria, South Africa, Rest of Africa], Latin America (Brazil, Argentina, Colombia, Rest of Latin America) |
Company Profiles | ABB Ltd, Fanuc Corporation, Yaskawa Electric Corporation, KUKA AG, Epson Robots, Mitsubishi Electric Corporation, Omron Corporation, Stäubli International AG, Denso Corporation, Kawasaki Robotics, Yamaha Motor Co., Ltd., Nachi-Fujikoshi Corp., Toshiba Machine Co., Ltd., HIWIN Technologies Corp., Delta Electronics, Inc. |
Ans: The SCARA Robots Market was valued at USD 4.7 Billion in 2023 and is expected to reach USD 15.6 Billion by 2032
Ans- The CAGR of the SCARA Robots Market during the forecast period is 14.29% from 2024-2032.
Ans- Asia-Pacific is expected to register the fastest CAGR during the forecast period.
Ans- The increasing adoption of SCARA robots in manufacturing, driven by Industry 4.0 and smart factory initiatives.
Ans- The shortage of trained professionals in robotics and automation hinders SCARA robot deployment and efficiency.
1. Introduction
1.1 Market Definition
1.2 Scope (Inclusion and Exclusions)
1.3 Research Assumptions
2. Executive Summary
2.1 Market Overview
2.2 Regional Synopsis
2.3 Competitive Summary
3. Research Methodology
3.1 Top-Down Approach
3.2 Bottom-up Approach
3.3. Data Validation
3.4 Primary Interviews
4. Market Dynamics Impact Analysis
4.1 Market Driving Factors Analysis
4.1.1 Drivers
4.1.2 Restraints
4.1.3 Opportunities
4.1.4 Challenges
4.2 PESTLE Analysis
4.3 Porter’s Five Forces Model
5. Statistical Insights and Trends Reporting
5.1 SCARA Robot Deployment, by Industry (2023)
5.2 Operational Efficiency Improvements (Historic and Future)
5.3 Manufacturing Throughput with SCARA Robots (2023)
5.4 Supply Chain Integration Metrics for SCARA Robots
6. Competitive Landscape
6.1 List of Major Companies, By Region
6.2 Market Share Analysis, By Region
6.3 Product Benchmarking
6.3.1 Product specifications and features
6.3.2 Pricing
6.4 Strategic Initiatives
6.4.1 Marketing and promotional activities
6.4.2 Distribution and supply chain strategies
6.4.3 Expansion plans and new product launches
6.4.4 Strategic partnerships and collaborations
6.5 Technological Advancements
6.6 Market Positioning and Branding
7. SCARA Robots Market Segmentation, By Payload Capacity
7.1 Chapter Overview
7.2 Up to 5 kg
7.2.1 Up to 5 kg Market Trends Analysis (2020-2032)
7.2.2 Up to 5 kg Market Size Estimates and Forecasts to 2032 (USD Billion)
7.3 5-15 kg
7.3.1 5-15 kg Market Trends Analysis (2020-2032)
7.3.2 5-15 kg Market Size Estimates and Forecasts to 2032 (USD Billion)
7.4 Above 15 kg
7.4.1 Above 15 kg Market Trends Analysis (2020-2032)
7.4.2 Above 15 kg Market Size Estimates and Forecasts to 2032 (USD Billion)
8. SCARA Robots Market Segmentation, by Application
8.1 Chapter Overview
8.2 Material Handling
8.2.1 Material Handling Market Trends Analysis (2020-2032)
8.2.2 Material Handling Market Size Estimates and Forecasts to 2032 (USD Billion)
8.3 Assembling & Disassembling
8.3.1 Assembling & Disassembling Market Trends Analysis (2020-2032)
8.3.2 Assembling & Disassembling Market Size Estimates and Forecasts to 2032 (USD Billion)
8.4 Welding and Soldering
8.4.1 Welding and Soldering Market Trends Analysis (2020-2032)
8.4.2 Welding and Soldering Market Size Estimates and Forecasts to 2032 (USD Billion)
8.5 Dispensing
8.5.1 Dispensing Market Trends Analysis (2020-2032)
8.5.2 Dispensing Market Size Estimates and Forecasts to 2032 (USD Billion)
8.6 Processing
8.6.1 Processing Market Trends Analysis (2020-2032)
8.6.2 Processing Market Size Estimates and Forecasts to 2032 (USD Billion)
9. SCARA Robots Market Segmentation, by End-Use
9.1 Chapter Overview
9.2 Automotive
9.2.1 Automotive Market Trends Analysis (2020-2032)
9.2.2 Automotive Market Size Estimates and Forecasts to 2032 (USD Billion)
9.3 Metal & Machinery
9.3.1 Metal & Machinery Market Trends Analysis (2020-2032)
9.3.2 Metal & Machinery Market Size Estimates and Forecasts to 2032 (USD Billion)
9.4 Rubber & Plastic
9.4.1 Rubber & Plastic Market Trends Analysis (2020-2032)
9.4.2 Rubber & Plastic Market Size Estimates and Forecasts to 2032 (USD Billion)
9.5 Food & beverage
9.5.1 Food & beverage Market Trends Analysis (2020-2032)
9.5.2 Food & beverage Market Size Estimates and Forecasts to 2032 (USD Billion)
9.6 Electrical & electronics
9.6.1 Electrical & electronics Market Trends Analysis (2020-2032)
9.6.2 Electrical & electronics Market Size Estimates and Forecasts to 2032 (USD Billion)
9.7 Consumer goods
9.7.1 Consumer goods Market Trends Analysis (2020-2032)
9.7.2 Consumer goods Market Size Estimates and Forecasts to 2032 (USD Billion)
9.8 Pharmaceuticals and medical devices
9.8.1 Pharmaceuticals and medical devices Market Trends Analysis (2020-2032)
9.8.2 Pharmaceuticals and medical devices Market Size Estimates and Forecasts to 2032 (USD Billion)
9.9 Others
9.9.1 Others Market Trends Analysis (2020-2032)
9.9.2 Others Market Size Estimates and Forecasts to 2032 (USD Billion)
10. Regional Analysis
10.1 Chapter Overview
10.2 North America
10.2.1 Trends Analysis
10.2.2 North America SCARA Robots Market Estimates and Forecasts, by Country (2020-2032) (USD Billion)
10.2.3 North America SCARA Robots Market Estimates and Forecasts, By Payload Capacity (2020-2032) (USD Billion)
10.2.4 North America SCARA Robots Market Estimates and Forecasts, by Application (2020-2032) (USD Billion)
10.2.5 North America SCARA Robots Market Estimates and Forecasts, by End-Use (2020-2032) (USD Billion)
10.2.6 USA
10.2.6.1 USA SCARA Robots Market Estimates and Forecasts, By Payload Capacity (2020-2032) (USD Billion)
10.2.6.2 USA SCARA Robots Market Estimates and Forecasts, by Application (2020-2032) (USD Billion)
10.2.6.3 USA SCARA Robots Market Estimates and Forecasts, by End-Use (2020-2032) (USD Billion)
10.2.7 Canada
10.2.7.1 Canada SCARA Robots Market Estimates and Forecasts, By Payload Capacity (2020-2032) (USD Billion)
10.2.7.2 Canada SCARA Robots Market Estimates and Forecasts, by Application (2020-2032) (USD Billion)
10.2.7.3 Canada SCARA Robots Market Estimates and Forecasts, by End-Use (2020-2032) (USD Billion)
10.2.8 Mexico
10.2.8.1 Mexico SCARA Robots Market Estimates and Forecasts, By Payload Capacity (2020-2032) (USD Billion)
10.2.8.2 Mexico SCARA Robots Market Estimates and Forecasts, by Application (2020-2032) (USD Billion)
10.2.8.3 Mexico SCARA Robots Market Estimates and Forecasts, by End-Use (2020-2032) (USD Billion)
10.3 Europe
10.3.1 Eastern Europe
10.3.1.1 Trends Analysis
10.3.1.2 Eastern Europe SCARA Robots Market Estimates and Forecasts, by Country (2020-2032) (USD Billion)
10.3.1.3 Eastern Europe SCARA Robots Market Estimates and Forecasts, By Payload Capacity (2020-2032) (USD Billion)
10.3.1.4 Eastern Europe SCARA Robots Market Estimates and Forecasts, by Application (2020-2032) (USD Billion)
10.3.1.5 Eastern Europe SCARA Robots Market Estimates and Forecasts, by End-Use (2020-2032) (USD Billion)
10.3.1.6 Poland
10.3.1.6.1 Poland SCARA Robots Market Estimates and Forecasts, By Payload Capacity (2020-2032) (USD Billion)
10.3.1.6.2 Poland SCARA Robots Market Estimates and Forecasts, by Application (2020-2032) (USD Billion)
10.3.1.6.3 Poland SCARA Robots Market Estimates and Forecasts, by End-Use (2020-2032) (USD Billion)
10.3.1.7 Romania
10.3.1.7.1 Romania SCARA Robots Market Estimates and Forecasts, By Payload Capacity (2020-2032) (USD Billion)
10.3.1.7.2 Romania SCARA Robots Market Estimates and Forecasts, by Application (2020-2032) (USD Billion)
10.3.1.7.3 Romania SCARA Robots Market Estimates and Forecasts, by End-Use (2020-2032) (USD Billion)
10.3.1.8 Hungary
10.3.1.8.1 Hungary SCARA Robots Market Estimates and Forecasts, By Payload Capacity (2020-2032) (USD Billion)
10.3.1.8.2 Hungary SCARA Robots Market Estimates and Forecasts, by Application (2020-2032) (USD Billion)
10.3.1.8.3 Hungary SCARA Robots Market Estimates and Forecasts, by End-Use (2020-2032) (USD Billion)
10.3.1.9 Turkey
10.3.1.9.1 Turkey SCARA Robots Market Estimates and Forecasts, By Payload Capacity (2020-2032) (USD Billion)
10.3.1.9.2 Turkey SCARA Robots Market Estimates and Forecasts, by Application (2020-2032) (USD Billion)
10.3.1.9.3 Turkey SCARA Robots Market Estimates and Forecasts, by End-Use (2020-2032) (USD Billion)
10.3.1.10 Rest of Eastern Europe
10.3.1.10.1 Rest of Eastern Europe SCARA Robots Market Estimates and Forecasts, By Payload Capacity (2020-2032) (USD Billion)
10.3.1.10.2 Rest of Eastern Europe SCARA Robots Market Estimates and Forecasts, by Application (2020-2032) (USD Billion)
10.3.1.10.3 Rest of Eastern Europe SCARA Robots Market Estimates and Forecasts, by End-Use (2020-2032) (USD Billion)
10.3.2 Western Europe
10.3.2.1 Trends Analysis
10.3.2.2 Western Europe SCARA Robots Market Estimates and Forecasts, by Country (2020-2032) (USD Billion)
10.3.2.3 Western Europe SCARA Robots Market Estimates and Forecasts, By Payload Capacity (2020-2032) (USD Billion)
10.3.2.4 Western Europe SCARA Robots Market Estimates and Forecasts, by Application (2020-2032) (USD Billion)
10.3.2.5 Western Europe SCARA Robots Market Estimates and Forecasts, by End-Use (2020-2032) (USD Billion)
10.3.2.6 Germany
10.3.2.6.1 Germany SCARA Robots Market Estimates and Forecasts, By Payload Capacity (2020-2032) (USD Billion)
10.3.2.6.2 Germany SCARA Robots Market Estimates and Forecasts, by Application (2020-2032) (USD Billion)
10.3.2.6.3 Germany SCARA Robots Market Estimates and Forecasts, by End-Use (2020-2032) (USD Billion)
10.3.2.7 France
10.3.2.7.1 France SCARA Robots Market Estimates and Forecasts, By Payload Capacity (2020-2032) (USD Billion)
10.3.2.7.2 France SCARA Robots Market Estimates and Forecasts, by Application (2020-2032) (USD Billion)
10.3.2.7.3 France SCARA Robots Market Estimates and Forecasts, by End-Use (2020-2032) (USD Billion)
10.3.2.8 UK
10.3.2.8.1 UK SCARA Robots Market Estimates and Forecasts, By Payload Capacity (2020-2032) (USD Billion)
10.3.2.8.2 UK SCARA Robots Market Estimates and Forecasts, by Application (2020-2032) (USD Billion)
10.3.2.8.3 UK SCARA Robots Market Estimates and Forecasts, by End-Use (2020-2032) (USD Billion)
10.3.2.9 Italy
10.3.2.9.1 Italy SCARA Robots Market Estimates and Forecasts, By Payload Capacity (2020-2032) (USD Billion)
10.3.2.9.2 Italy SCARA Robots Market Estimates and Forecasts, by Application (2020-2032) (USD Billion)
10.3.2.9.3 Italy SCARA Robots Market Estimates and Forecasts, by End-Use (2020-2032) (USD Billion)
10.3.2.10 Spain
10.3.2.10.1 Spain SCARA Robots Market Estimates and Forecasts, By Payload Capacity (2020-2032) (USD Billion)
10.3.2.10.2 Spain SCARA Robots Market Estimates and Forecasts, by Application (2020-2032) (USD Billion)
10.3.2.10.3 Spain SCARA Robots Market Estimates and Forecasts, by End-Use (2020-2032) (USD Billion)
10.3.2.11 Netherlands
10.3.2.11.1 Netherlands SCARA Robots Market Estimates and Forecasts, By Payload Capacity (2020-2032) (USD Billion)
10.3.2.11.2 Netherlands SCARA Robots Market Estimates and Forecasts, by Application (2020-2032) (USD Billion)
10.3.2.11.3 Netherlands SCARA Robots Market Estimates and Forecasts, by End-Use (2020-2032) (USD Billion)
10.3.2.12 Switzerland
10.3.2.12.1 Switzerland SCARA Robots Market Estimates and Forecasts, By Payload Capacity (2020-2032) (USD Billion)
10.3.2.12.2 Switzerland SCARA Robots Market Estimates and Forecasts, by Application (2020-2032) (USD Billion)
10.3.2.12.3 Switzerland SCARA Robots Market Estimates and Forecasts, by End-Use (2020-2032) (USD Billion)
10.3.2.13 Austria
10.3.2.13.1 Austria SCARA Robots Market Estimates and Forecasts, By Payload Capacity (2020-2032) (USD Billion)
10.3.2.13.2 Austria SCARA Robots Market Estimates and Forecasts, by Application (2020-2032) (USD Billion)
10.3.2.13.3 Austria SCARA Robots Market Estimates and Forecasts, by End-Use (2020-2032) (USD Billion)
10.3.2.14 Rest of Western Europe
10.3.2.14.1 Rest of Western Europe SCARA Robots Market Estimates and Forecasts, By Payload Capacity (2020-2032) (USD Billion)
10.3.2.14.2 Rest of Western Europe SCARA Robots Market Estimates and Forecasts, by Application (2020-2032) (USD Billion)
10.3.2.14.3 Rest of Western Europe SCARA Robots Market Estimates and Forecasts, by End-Use (2020-2032) (USD Billion)
10.4 Asia Pacific
10.4.1 Trends Analysis
10.4.2 Asia Pacific SCARA Robots Market Estimates and Forecasts, by Country (2020-2032) (USD Billion)
10.4.3 Asia Pacific SCARA Robots Market Estimates and Forecasts, By Payload Capacity (2020-2032) (USD Billion)
10.4.4 Asia Pacific SCARA Robots Market Estimates and Forecasts, by Application (2020-2032) (USD Billion)
10.4.5 Asia Pacific SCARA Robots Market Estimates and Forecasts, by End-Use (2020-2032) (USD Billion)
10.4.6 China
10.4.6.1 China SCARA Robots Market Estimates and Forecasts, By Payload Capacity (2020-2032) (USD Billion)
10.4.6.2 China SCARA Robots Market Estimates and Forecasts, by Display (2020-2032) (USD Billion)
10.4.6.3 China SCARA Robots Market Estimates and Forecasts, by End-Use (2020-2032) (USD Billion)
10.4.7 India
10.4.7.1 India SCARA Robots Market Estimates and Forecasts, By Payload Capacity (2020-2032) (USD Billion)
10.4.7.2 India SCARA Robots Market Estimates and Forecasts, by Application (2020-2032) (USD Billion)
10.4.7.3 India SCARA Robots Market Estimates and Forecasts, by End-Use (2020-2032) (USD Billion)
10.4.8 Japan
10.4.8.1 Japan SCARA Robots Market Estimates and Forecasts, By Payload Capacity (2020-2032) (USD Billion)
10.4.8.2 Japan SCARA Robots Market Estimates and Forecasts, by Application (2020-2032) (USD Billion)
10.4.8.3 Japan SCARA Robots Market Estimates and Forecasts, by End-Use (2020-2032) (USD Billion)
10.4.9 South Korea
10.4.9.1 South Korea SCARA Robots Market Estimates and Forecasts, By Payload Capacity (2020-2032) (USD Billion)
10.4.9.2 South Korea SCARA Robots Market Estimates and Forecasts, by Application (2020-2032) (USD Billion)
10.4.9.3 South Korea SCARA Robots Market Estimates and Forecasts, by End-Use (2020-2032) (USD Billion)
10.4.10 Vietnam
10.4.10.1 Vietnam SCARA Robots Market Estimates and Forecasts, By Payload Capacity (2020-2032) (USD Billion)
10.4.10.2 Vietnam SCARA Robots Market Estimates and Forecasts, by Application (2020-2032) (USD Billion)
10.4.10.3 Vietnam SCARA Robots Market Estimates and Forecasts, by End-Use (2020-2032) (USD Billion)
10.4.11 Singapore
10.4.11.1 Singapore SCARA Robots Market Estimates and Forecasts, By Payload Capacity (2020-2032) (USD Billion)
10.4.11.2 Singapore SCARA Robots Market Estimates and Forecasts, by Application (2020-2032) (USD Billion)
10.4.11.3 Singapore SCARA Robots Market Estimates and Forecasts, by End-Use (2020-2032) (USD Billion)
10.4.12 Australia
10.4.12.1 Australia SCARA Robots Market Estimates and Forecasts, By Payload Capacity (2020-2032) (USD Billion)
10.4.12.2 Australia SCARA Robots Market Estimates and Forecasts, by Application (2020-2032) (USD Billion)
10.4.12.3 Australia SCARA Robots Market Estimates and Forecasts, by End-Use (2020-2032) (USD Billion)
10.4.13 Rest of Asia Pacific
10.4.13.1 Rest of Asia Pacific SCARA Robots Market Estimates and Forecasts, By Payload Capacity (2020-2032) (USD Billion)
10.4.13.2 Rest of Asia Pacific SCARA Robots Market Estimates and Forecasts, by Application (2020-2032) (USD Billion)
10.4.13.3 Rest of Asia Pacific SCARA Robots Market Estimates and Forecasts, by End-Use (2020-2032) (USD Billion)
10.5 Middle East and Africa
10.5.1 Middle East
10.5.1.1 Trends Analysis
10.5.1.2 Middle East SCARA Robots Market Estimates and Forecasts, by Country (2020-2032) (USD Billion)
10.5.1.3 Middle East SCARA Robots Market Estimates and Forecasts, By Payload Capacity (2020-2032) (USD Billion)
10.5.1.4 Middle East SCARA Robots Market Estimates and Forecasts, by Application (2020-2032) (USD Billion)
10.5.1.5 Middle East SCARA Robots Market Estimates and Forecasts, by End-Use (2020-2032) (USD Billion)
10.5.1.6 UAE
10.5.1.6.1 UAE SCARA Robots Market Estimates and Forecasts, By Payload Capacity (2020-2032) (USD Billion)
10.5.1.6.2 UAE SCARA Robots Market Estimates and Forecasts, by Application (2020-2032) (USD Billion)
10.5.1.6.3 UAE SCARA Robots Market Estimates and Forecasts, by End-Use (2020-2032) (USD Billion)
10.5.1.7 Egypt
10.5.1.7.1 Egypt SCARA Robots Market Estimates and Forecasts, By Payload Capacity (2020-2032) (USD Billion)
10.5.1.7.2 Egypt SCARA Robots Market Estimates and Forecasts, by Application (2020-2032) (USD Billion)
10.5.1.7.3 Egypt SCARA Robots Market Estimates and Forecasts, by End-Use (2020-2032) (USD Billion)
10.5.1.8 Saudi Arabia
10.5.1.8.1 Saudi Arabia SCARA Robots Market Estimates and Forecasts, By Payload Capacity (2020-2032) (USD Billion)
10.5.1.8.2 Saudi Arabia SCARA Robots Market Estimates and Forecasts, by Application (2020-2032) (USD Billion)
10.5.1.8.3 Saudi Arabia SCARA Robots Market Estimates and Forecasts, by End-Use (2020-2032) (USD Billion)
10.5.1.9 Qatar
10.5.1.9.1 Qatar SCARA Robots Market Estimates and Forecasts, By Payload Capacity (2020-2032) (USD Billion)
10.5.1.9.2 Qatar SCARA Robots Market Estimates and Forecasts, by Application (2020-2032) (USD Billion)
10.5.1.9.3 Qatar SCARA Robots Market Estimates and Forecasts, by End-Use (2020-2032) (USD Billion)
10.5.1.10 Rest of Middle East
10.5.1.10.1 Rest of Middle East SCARA Robots Market Estimates and Forecasts, By Payload Capacity (2020-2032) (USD Billion)
10.5.1.10.2 Rest of Middle East SCARA Robots Market Estimates and Forecasts, by Application (2020-2032) (USD Billion)
10.5.1.10.3 Rest of Middle East SCARA Robots Market Estimates and Forecasts, by End-Use (2020-2032) (USD Billion)
10.5.2 Africa
10.5.2.1 Trends Analysis
10.5.2.2 Africa SCARA Robots Market Estimates and Forecasts, by Country (2020-2032) (USD Billion)
10.5.2.3 Africa SCARA Robots Market Estimates and Forecasts, By Payload Capacity (2020-2032) (USD Billion)
10.5.2.4 Africa SCARA Robots Market Estimates and Forecasts, by Application (2020-2032) (USD Billion)
10.5.2.5 Africa SCARA Robots Market Estimates and Forecasts, by End-Use (2020-2032) (USD Billion)
10.5.2.6 South Africa
10.5.2.6.1 South Africa SCARA Robots Market Estimates and Forecasts, By Payload Capacity (2020-2032) (USD Billion)
10.5.2.6.2 South Africa SCARA Robots Market Estimates and Forecasts, by Application (2020-2032) (USD Billion)
10.5.2.6.3 South Africa SCARA Robots Market Estimates and Forecasts, by End-Use (2020-2032) (USD Billion)
10.5.2.7 Nigeria
10.5.2.7.1 Nigeria SCARA Robots Market Estimates and Forecasts, By Payload Capacity (2020-2032) (USD Billion)
10.5.2.7.2 Nigeria SCARA Robots Market Estimates and Forecasts, by Application (2020-2032) (USD Billion)
10.5.2.7.3 Nigeria SCARA Robots Market Estimates and Forecasts, by End-Use (2020-2032) (USD Billion)
10.5.2.8 Rest of Africa
10.5.2.8.1 Rest of Africa SCARA Robots Market Estimates and Forecasts, By Payload Capacity (2020-2032) (USD Billion)
10.5.2.8.2 Rest of Africa SCARA Robots Market Estimates and Forecasts, by Application (2020-2032) (USD Billion)
10.5.2.8.3 Rest of Africa SCARA Robots Market Estimates and Forecasts, by End-Use (2020-2032) (USD Billion)
10.6 Latin America
10.6.1 Trends Analysis
10.6.2 Latin America SCARA Robots Market Estimates and Forecasts, by Country (2020-2032) (USD Billion)
10.6.3 Latin America SCARA Robots Market Estimates and Forecasts, By Payload Capacity (2020-2032) (USD Billion)
10.6.4 Latin America SCARA Robots Market Estimates and Forecasts, by Application (2020-2032) (USD Billion)
10.6.5 Latin America SCARA Robots Market Estimates and Forecasts, by End-Use (2020-2032) (USD Billion)
10.6.6 Brazil
10.6.6.1 Brazil SCARA Robots Market Estimates and Forecasts, By Payload Capacity (2020-2032) (USD Billion)
10.6.6.2 Brazil SCARA Robots Market Estimates and Forecasts, by Application (2020-2032) (USD Billion)
10.6.6.3 Brazil SCARA Robots Market Estimates and Forecasts, by End-Use (2020-2032) (USD Billion)
10.6.7 Argentina
10.6.7.1 Argentina SCARA Robots Market Estimates and Forecasts, By Payload Capacity (2020-2032) (USD Billion)
10.6.7.2 Argentina SCARA Robots Market Estimates and Forecasts, by Application (2020-2032) (USD Billion)
10.6.7.3 Argentina SCARA Robots Market Estimates and Forecasts, by End-Use (2020-2032) (USD Billion)
10.6.8 Colombia
10.6.8.1 Colombia SCARA Robots Market Estimates and Forecasts, By Payload Capacity (2020-2032) (USD Billion)
10.6.8.2 Colombia SCARA Robots Market Estimates and Forecasts, by Application (2020-2032) (USD Billion)
10.6.8.3 Colombia SCARA Robots Market Estimates and Forecasts, by End-Use (2020-2032) (USD Billion)
10.6.9 Rest of Latin America
10.6.9.1 Rest of Latin America SCARA Robots Market Estimates and Forecasts, By Payload Capacity (2020-2032) (USD Billion)
10.6.9.2 Rest of Latin America SCARA Robots Market Estimates and Forecasts, by Enterprise Size (2020-2032) (USD Billion)
10.6.9.3 Rest of Latin America SCARA Robots Market Estimates and Forecasts, by End-Use (2020-2032) (USD Billion)
11. Company Profiles
11.1 ABB Ltd
11.1.1 Company Overview
11.1.2 Financial
11.1.3 Products/ Services Offered
11.1.4 SWOT Analysis
11.2 Fanuc Corporation
11.2.1 Company Overview
11.2.2 Financial
11.2.3 Products/ Services Offered
11.2.4 SWOT Analysis
11.3 Yaskawa Electric Corporation
11.3.1 Company Overview
11.3.2 Financial
11.3.3 Products/ Services Offered
11.3.4 SWOT Analysis
11.4 KUKA AG
11.4.1 Company Overview
11.4.2 Financial
11.4.3 Products/ Services Offered
11.4.4 SWOT Analysis
11.5 Epson Robots
11.5.1 Company Overview
11.5.2 Financial
11.5.3 Products/ Services Offered
11.5.4 SWOT Analysis
11.6 Mitsubishi Electric Corporation
11.6.1 Company Overview
11.6.2 Financial
11.6.3 Products/ Services Offered
11.6.4 SWOT Analysis
11.7 Omron Corporation
11.7.1 Company Overview
11.7.2 Financial
11.7.3 Products/ Services Offered
11.7.4 SWOT Analysis
11.8 Stäubli International AG
11.8.1 Company Overview
11.8.2 Financial
11.8.3 Products/ Services Offered
11.8.4 SWOT Analysis
11.9 Denso Corporation
11.9.1 Company Overview
11.9.2 Financial
11.9.3 Products/ Services Offered
11.9.4 SWOT Analysis
11.10 Kawasaki Robotics
11.10.1 Company Overview
11.10.2 Financial
11.10.3 Products/ Services Offered
11.10.4 SWOT Analysis
12. Use Cases and Best Practices
13. Conclusion
An accurate research report requires proper strategizing as well as implementation. There are multiple factors involved in the completion of good and accurate research report and selecting the best methodology to compete the research is the toughest part. Since the research reports we provide play a crucial role in any company’s decision-making process, therefore we at SNS Insider always believe that we should choose the best method which gives us results closer to reality. This allows us to reach at a stage wherein we can provide our clients best and accurate investment to output ratio.
Each report that we prepare takes a timeframe of 350-400 business hours for production. Starting from the selection of titles through a couple of in-depth brain storming session to the final QC process before uploading our titles on our website we dedicate around 350 working hours. The titles are selected based on their current market cap and the foreseen CAGR and growth.
The 5 steps process:
Step 1: Secondary Research:
Secondary Research or Desk Research is as the name suggests is a research process wherein, we collect data through the readily available information. In this process we use various paid and unpaid databases which our team has access to and gather data through the same. This includes examining of listed companies’ annual reports, Journals, SEC filling etc. Apart from this our team has access to various associations across the globe across different industries. Lastly, we have exchange relationships with various university as well as individual libraries.
Step 2: Primary Research
When we talk about primary research, it is a type of study in which the researchers collect relevant data samples directly, rather than relying on previously collected data. This type of research is focused on gaining content specific facts that can be sued to solve specific problems. Since the collected data is fresh and first hand therefore it makes the study more accurate and genuine.
We at SNS Insider have divided Primary Research into 2 parts.
Part 1 wherein we interview the KOLs of major players as well as the upcoming ones across various geographic regions. This allows us to have their view over the market scenario and acts as an important tool to come closer to the accurate market numbers. As many as 45 paid and unpaid primary interviews are taken from both the demand and supply side of the industry to make sure we land at an accurate judgement and analysis of the market.
This step involves the triangulation of data wherein our team analyses the interview transcripts, online survey responses and observation of on filed participants. The below mentioned chart should give a better understanding of the part 1 of the primary interview.
Part 2: In this part of primary research the data collected via secondary research and the part 1 of the primary research is validated with the interviews from individual consultants and subject matter experts.
Consultants are those set of people who have at least 12 years of experience and expertise within the industry whereas Subject Matter Experts are those with at least 15 years of experience behind their back within the same space. The data with the help of two main processes i.e., FGDs (Focused Group Discussions) and IDs (Individual Discussions). This gives us a 3rd party nonbiased primary view of the market scenario making it a more dependable one while collation of the data pointers.
Step 3: Data Bank Validation
Once all the information is collected via primary and secondary sources, we run that information for data validation. At our intelligence centre our research heads track a lot of information related to the market which includes the quarterly reports, the daily stock prices, and other relevant information. Our data bank server gets updated every fortnight and that is how the information which we collected using our primary and secondary information is revalidated in real time.
Step 4: QA/QC Process
After all the data collection and validation our team does a final level of quality check and quality assurance to get rid of any unwanted or undesired mistakes. This might include but not limited to getting rid of the any typos, duplication of numbers or missing of any important information. The people involved in this process include technical content writers, research heads and graphics people. Once this process is completed the title gets uploader on our platform for our clients to read it.
Step 5: Final QC/QA Process:
This is the last process and comes when the client has ordered the study. In this process a final QA/QC is done before the study is emailed to the client. Since we believe in giving our clients a good experience of our research studies, therefore, to make sure that we do not lack at our end in any way humanly possible we do a final round of quality check and then dispatch the study to the client.
By Payload Capacity
Up to 5 kg
5-15 kg
Above 15 kg
By Application
Material Handling
Assembling & Disassembling
Welding and Soldering
Dispensing
Processing
By End-User
Automotive
Metal & Machinery
Rubber & Plastic
Food & beverage
Electrical & electronics
Consumer goods
Pharmaceuticals and medical devices
Others
Request for Segment Customization as per your Business Requirement: Segment Customization Request
Regional Coverage:
North America
US
Canada
Mexico
Europe
Eastern Europe
Poland
Romania
Hungary
Turkey
Rest of Eastern Europe
Western Europe
Germany
France
UK
Italy
Spain
Netherlands
Switzerland
Austria
Rest of Western Europe
Asia Pacific
China
India
Japan
South Korea
Vietnam
Singapore
Australia
Rest of Asia Pacific
Middle East & Africa
Middle East
UAE
Egypt
Saudi Arabia
Qatar
Rest of Middle East
Africa
Nigeria
South Africa
Rest of Africa
Latin America
Brazil
Argentina
Colombia
Rest of Latin America
Request for Country Level Research Report: Country Level Customization Request
Available Customization
With the given market data, SNS Insider offers customization as per the company’s specific needs. The following customization options are available for the report:
Detailed Volume Analysis
Criss-Cross segment analysis (e.g. Product X Application)
Competitive Product Benchmarking
Geographic Analysis
Additional countries in any of the regions
Customized Data Representation
Detailed analysis and profiling of additional market players
The Pico Projector Market Size was valued at USD 5.8 Billion in 2023 and is expected to reach USD 34.4 Billion by 2032, at a CAGR of 21.89% from 2024-2032.
The Rotary and RF Rotary Joints Market Size was valued at USD 1.61 Billion in 2023 and is expected to grow at 5.09% CAGR to reach USD 2.52 Billion by 2032.
The Livestock Identification Market Size was valued at USD 1.79 Billion in 2023 and is expected to reach USD 3.99 Billion by 2032 and grow at a CAGR of 9.77% over the forecast period 2024-2032.
The Global Laser Processing Market was valued at USD 8.64 Billion in 2023. It is estimated to grow at a CAGR of 8.47% to reach USD 17.91 Billion by 2032
The Compound Semiconductor Market Size was valued at USD 43.17 billion in 2023 and is expected to reach USD 76.73 billion by 2032 and grow at a CAGR of 6.60% over the forecast period 2024-2032.
The E-Compass Market was valued at USD 2.27 Billion in 2023 and is expected to reach USD 6.26 Billion by 2032, growing at a CAGR of 11.93 % from 2024-2032
Hi! Click one of our member below to chat on Phone