image

Rugged Tablet Market Size
Rugged Tablet Market Revenue Analysis

Get E-PDF Sample Report on Rugged Tablet Market - Request Sample Report

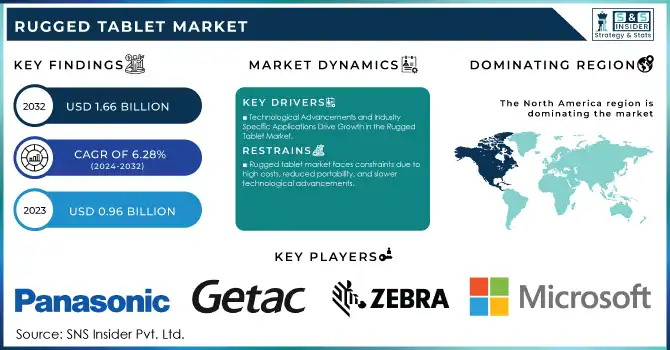
The Rugged Tablet Market Size was valued at USD 0.96 Billion in 2023 and is expected to reach USD 1.66 Billion by 2032 and grow at a CAGR of 6.28% over the forecast period of 2024-2032.

The rugged tablet market is experiencing significant growth driven by increasing demand across various industries such as manufacturing, logistics, healthcare, and construction. Rugged tablets have become essential for businesses aiming to enhance operational efficiency and streamline workflows, especially in tough environments where durability and reliability are critical.These devices are designed to withstand harsh conditions, including exposure to dust, moisture, extreme temperatures, and drops, making them ideal for outdoor and industrial use. For instance, in industrial maintenance, rugged tablets are transforming how businesses manage maintenance operations by providing real-time data, enabling predictive maintenance, and reducing downtime, which leads to cost savings.

The healthcare sector is also benefiting from rugged tablets, using them for field diagnostics, patient care management, and integration with other digital healthcare systems. With the rise of remote work and mobile workforces, companies are increasingly deploying rugged tablets to support field operations, providing a portable and reliable solution for data collection, inventory management, and communication. This growing demand is further fueled by technological advancements that enhance the processing power, battery life, and connectivity of rugged tablets, such as 5G integration and IoT compatibility, making them even more effective for diverse applications.

Additionally, the increasing focus on safety and compliance standards, such as MIL-STD-810G, is pushing industries like defense and public safety to invest in rugged tablets that meet rigorous durability requirements.

Rugged Tablet Market Dynamics

Drivers

  • Technological Advancements and Industry-Specific Applications Drive Growth in the Rugged Tablet Market

The rugged tablet market is witnessing substantial growth, driven by increasing demand from industries such as manufacturing, logistics, healthcare, construction, and defense, where operational efficiency and durability are critical. Rugged tablets, designed to withstand extreme conditions like dust, moisture, high and low temperatures, and impacts, have become essential for workers in demanding environments. For example, in logistics, these devices streamline inventory management and ensure real-time communication in warehouses and remote locations, enhancing productivity.

In industrial maintenance, rugged tablets provide predictive maintenance solutions, reducing downtime and achieving cost savings. Healthcare professionals leverage rugged tablets for field diagnostics, patient care management, and seamless integration with digital healthcare systems, ensuring uninterrupted service in challenging conditions. Devices such as Getac Technology’s ZX80 exemplify these innovations with features like MIL-STD-810H and IP67 certifications, a 1,000-nit screen for outdoor visibility, hot-swappable batteries, dual SIM design, and compatibility with AI use cases. This tablet’s ability to operate in temperatures from -29°C to 63°C demonstrates its utility across diverse environments, from warehouses to outdoor facilities. The incorporation of advanced connectivity options like Wi-Fi 6E, Bluetooth 5.2, and 4G/5G LTE ensures seamless operations, while AI engines enable complex tasks like unmanned aircraft control and machine learning applications. The growing focus on safety and compliance standards further solidifies rugged tablets' adoption in defense and public safety sectors. As industries increasingly adopt mobile computing and leverage technological advancements, the rugged tablet market is poised for continued expansion, offering solutions that enhance productivity, reduce costs, and ensure reliability in even the most demanding environments.

Restraints

  • Rugged tablet market faces constraints due to high costs, reduced portability, and slower technological advancements.

High initial costs also constrain market growth. The specialized materials and components necessary for rugged designs drive up production costs, making these devices significantly more expensive than consumer alternatives. This price gap often deters small and medium-sized enterprises (SMEs) and budget-conscious organizations from adopting them. Moreover, the slower pace of technological innovation in rugged tablets compared to consumer devices is a disadvantage. Features like biometric security, edge-to-edge displays, and advanced connectivity are often missing, leaving rugged tablets less competitive.

Limited software compatibility and customization challenges further impede adoption. Issues with integrating rugged tablets into modern enterprise software or adapting them for specific use cases discourage businesses. To sustain growth, manufacturers must address these restraints by balancing durability with affordability, technological advancements, and user-centric features.

Rugged Tablet Market Segment Analysis

by Operation System

In 2023, the Windows segment dominated the rugged tablet market, accounting for approximately 49% of the market share. This dominance can be attributed to the widespread adoption of Windows-based systems across various industries that rely on rugged tablets, such as manufacturing, logistics, healthcare, and field services. Windows operating systems offer seamless integration with existing enterprise software, making them highly attractive for businesses seeking to ensure compatibility and streamline operations. Furthermore, the familiarity and robustness of the Windows environment make it easier for organizations to deploy rugged tablets within their IT infrastructure without requiring significant training or system adjustments. The Windows platform is known for its stability, security features, and wide compatibility with business-critical applications, including enterprise resource planning and customer relationship management tools. These advantages have made Windows-powered rugged tablets the preferred choice for organizations prioritizing reliability and productivity in demanding environments.

by Type

In 2023, the Fully Rugged segment dominated the rugged tablet market, accounting for around 59% of the market share. These devices are specifically designed to withstand the harshest environments, making them ideal for industries such as manufacturing, construction, logistics, and military applications. Fully rugged tablets are built with reinforced exteriors, enhanced durability, and the ability to endure extreme conditions like dust, water, shocks, and temperature fluctuations. Their robust construction ensures reliability in demanding situations, where standard devices might fail. This segment's popularity is driven by their ability to enhance productivity and operational efficiency in challenging environments, offering high performance and stability. As industries continue to prioritize durability and long-term use, the Fully Rugged segment is expected to maintain a strong market presence.

Rugged Tablet Market Regional Outlook

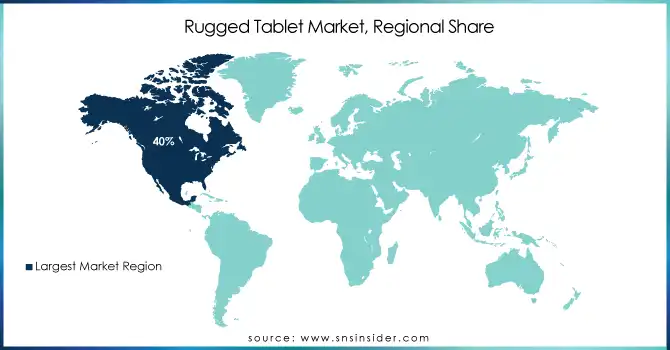
In 2023, North America dominated the rugged tablet market, accounting for approximately 40% of global revenue. This dominance is driven by the widespread adoption of rugged tablets in key sectors such as manufacturing, healthcare, logistics, and defense. The U.S. is driving this trend, with its robust infrastructure and tech-centric industries investing more in durable mobile solutions for field operations, maintenance, and real-time data collection. Additionally, North America benefits from the presence of leading manufacturers and innovators in rugged tablet solutions. Technological advancements, such as 5G integration and IoT compatibility, further enhance the region's market position. The region’s emphasis on safety, compliance standards, and expanding industries like renewable energy and defense ensures continued growth in the rugged tablet market.

Asia-Pacific is the fastest-growing region in the rugged tablet market during the forecast period of 2024-2032. This growth is fueled by rapid industrialization, increasing infrastructure development, and the rising demand for durable mobile devices in sectors like manufacturing, logistics, defense, and construction. Countries such as China, India, Japan, and South Korea are investing heavily in technological advancements and smart solutions, driving the demand for rugged tablets. Additionally, the region’s expanding healthcare, transportation, and mining sectors contribute to this surge in adoption. The region benefits from cost-effective manufacturing, making rugged tablets more accessible to a wider range of businesses. The growing focus on operational efficiency, mobility, and data collection in harsh environments further accelerates market growth across Asia-Pacific.
Rugged-Tablet-Market-Regional-Share

Get Customized Report as Per Your Business Requirement - Request For Customized Report

Key Players

Some of the major key players in the rugged tablet market, with their associated products listed:

  • Panasonic: (Toughpad FZ-G1, Toughbook series)

  • Getac: (Getac F110, Getac T800)

  • Zebra Technologies: (ET80/ET85, TC series)

  • Dell Technologies: (Latitude 7220 Rugged Extreme Tablet)

  • Microsoft: (Surface Go 3 for Business)

  • Xplore Technologies: (Xplore Bobcat, Xplore iX104C6)

  • Honeywell: (RT10, Dolphin CT40)

  • MobileDemand, L.C.: (xTablet T1180, xTablet T1600)

  • Advantech: (TREK-550, TREK-722)

  • TabletKiosk: (OmniTAP 10.1", PWS-8650)

  • Durabook: (R11, Z14I)

  • Winmate: (M101B, 10.1" rugged tablet)

  • Trimble Inc.: (Trimble T10, Trimble Yuma 2)

  • Unitech: (TB100, HT680)

  • Pryme: (Rugged Tablet Solutions for first responders)

  • Samsung: (Galaxy Tab Active3)

  • Logic Instrument: (Fieldbook 15, Fieldbook 12)

  • B&B Electronics: (Rugged Tablets for industrial applications)

  • RuggON: (Rextorm PX-501, PX-70)

  • Leonardo DRS: (Rugged solutions for military applications)

  • NEXCOM International Co., Ltd.: (Rugged Tablet PC)

  • AAEON: (Rugged Tablets and Industrial PCs)

  • HP Development Company, L.P.: (HP Elite x2, HP Pro Tablet 608)

  • Kontron S&T AG: (Rugged Tablets and Embedded Systems)

  • American Standard: (Rugged Tablets for industrial and military use)

List of potential customer companies that could benefit from rugged tablets across various industries:

  • Boeing (Aerospace and Defense)

  • General Electric (GE) (Manufacturing, Energy, and Power)

  • ExxonMobil (Oil and Gas)

  • Lockheed Martin (Aerospace and Defense)

  • Siemens (Industrial Equipment and Automation)

  • Caterpillar (Construction and Heavy Equipment)

  • DHL (Logistics and Transportation)

  • United Parcel Service (UPS) (Logistics and Distribution)

  • Schneider Electric (Energy and Automation)

  • Honeywell (Technology and Manufacturing)

  • Pfizer (Pharmaceuticals and Healthcare)

  • Medtronic (Medical Devices and Healthcare)

  • AT&T (Telecommunications)

  • T-Mobile (Telecommunications)

  • Macy's (Retail and Inventory Management)

  • Ford Motor Company (Automotive)

  • Chevron (Oil and Gas)

  • Raytheon Technologies (Aerospace and Defense)

  • IBM (Technology and Consulting)

  • Tesla (Automotive and Energy)

Recent Development

  • Oct 30, 2024: Getac integrates Sony Semiconductor Solutions' SORPLAS environmentally conscious plastic into its premium rugged products, including the Getac S510 laptop and K120 tablet, reinforcing their commitment to sustainability by utilizing recycled materials in manufacturing.

  • October18, 2024 Honeywell Unveils AI-Powered Mobile Computers for Enhanced Workforce Productivity. Honeywell has introduced three new AI-powered handheld computers – the CT37, CK67, and CK62 – designed to boost productivity across retail, healthcare, and warehouse environments. These devices integrate AI to optimize workflows, improve task efficiency, and enhance accuracy, making them ideal for frontline workers

  • December 10, 2024, Samsung's upcoming rugged phone, the Galaxy Xcover 8 Pro, is set to feature a user-removable battery with a higher capacity than previous Xcover models, as confirmed by Safety Korea.

Rugged Tablet Market Report Scope:

Report Attributes Details
Market Size in 2023 USD 0.96 Billion
Market Size by 2032 USD 1.66 Billion
CAGR CAGR of 6.28% From 2024 to 2032
Base Year 2023
Forecast Period 2024-2032
Historical Data 2020-2022
Report Scope & Coverage Market Size, Segments Analysis, Competitive  Landscape, Regional Analysis, DROC & SWOT Analysis, Forecast Outlook
Key Segments • By Operating System (Windows, iOS, Android, Others)
• By Type (Fully Rugged, Semi Rugged)
• By Distribution Channel (Online, Offline)
• By End-Use Industry (Oil & Gas, Retail, Construction, Education, Government, Food & Beverage, Manufacturing, Healthcare, Transportation & Logistics, Others)
Regional Analysis/Coverage North America (US, Canada, Mexico), Europe (Eastern Europe [Poland, Romania, Hungary, Turkey, Rest of Eastern Europe] Western Europe] Germany, France, UK, Italy, Spain, Netherlands, Switzerland, Austria, Rest of Western Europe]), Asia Pacific (China, India, Japan, South Korea, Vietnam, Singapore, Australia, Rest of Asia Pacific), Middle East & Africa (Middle East [UAE, Egypt, Saudi Arabia, Qatar, Rest of Middle East], Africa [Nigeria, South Africa, Rest of Africa], Latin America (Brazil, Argentina, Colombia, Rest of Latin America)
Company Profiles Panasonic, Getac, Zebra Technologies, Dell Technologies, Microsoft, Xplore Technologies, Honeywell, MobileDemand, L.C., Advantech, TabletKiosk, Durabook, Winmate, Trimble Inc., Unitech, Pryme, Samsung, Logic Instrument, B&B Electronics, RuggON, Leonardo DRS, NEXCOM International Co., Ltd., AAEON, HP Development Company, L.P., Kontron S&T AG, American Standard.
Key Drivers • Technological Advancements and Industry-Specific Applications Drive Growth in the Rugged Tablet Market.
Restraints • Rugged tablet market faces constraints due to high costs, reduced portability, and slower technological advancements.

Frequently Asked Questions

Ans: Rugged Tablet Market size was valued at USD 0.96 Billion in 2023.

Ans: North America region is dominating the Rugged Tablet Market.

Ans: Growing Preference for Devices with More Features and Increased Adoption of Rugged Tablets.

Ans: Windows is dominating in Rugged Tablet Market in 2023.

Ans: Rugged Tablet Market is anticipated to expand by 6.28%  from 2024 to 2032.

Table of Content

1. Introduction

1.1 Market Definition

1.2 Scope (Inclusion and Exclusions)

1.3 Research Assumptions

2. Executive Summary

2.1 Market Overview

2.2 Regional Synopsis

2.3 Competitive Summary

3. Research Methodology

3.1 Top-Down Approach

3.2 Bottom-up Approach

3.3. Data Validation

3.4 Primary Interviews

4. Market Dynamics Impact Analysis

4.1 Market Driving Factors Analysis

4.1.1 Drivers

4.1.2 Restraints

4.1.3 Opportunities

4.1.4 Challenges

4.2 PESTLE Analysis

4.3 Porter’s Five Forces Model

5. Statistical Insights and Trends Reporting

5.1 Sales and Shipment Data

5.2 Manufacturing and Supply Chain Insights

5.3 Consumer Sentiment and Usage

5.4 Innovation and R&D

6. Competitive Landscape

6.1 List of Major Companies, by Region

6.2 Market Share Analysis, by Region

6.3 Product Benchmarking

6.3.1 Product specifications and features

6.3.2 Pricing

6.4 Strategic Initiatives

6.4.1 Marketing and promotional activities

6.4.2 Distribution and supply chain strategies

6.4.3 Expansion plans and new product launches

6.4.4 Strategic partnerships and collaborations

6.5 Technological Advancements

6.6 Market Positioning and Branding

7. Rugged Tablet Market Segmentation, by Operating System

7.1 Chapter Overview

7.2 Windows

7.2.1 Windows Market Trends Analysis (2020-2032)

7.2.2 Windows Market Size Estimates and Forecasts to 2032 (USD Billion)

7.3 iOS

7.3.1 iOS Market Trends Analysis (2020-2032)

7.3.2 iOS Market Size Estimates and Forecasts to 2032 (USD Billion)

7.4 Android

7.4.1 Android Market Trends Analysis (2020-2032)

7.4.2 Android Market Size Estimates and Forecasts to 2032 (USD Billion)

7.5 Others

7.5.1 Others Market Trends Analysis (2020-2032)

7.5.2 Others Market Size Estimates and Forecasts to 2032 (USD Billion)

8. Rugged Tablet Market Segmentation, by Type

8.1 Chapter Overview

8.2 Fully Rugged

8.2.1 Fully Rugged Market Trends Analysis (2020-2032)

8.2.2 Fully Rugged Market Size Estimates and Forecasts to 2032 (USD Billion)

8.3 Semi Rugged

8.3.1 Semi Rugged Market Trends Analysis (2020-2032)

8.3.2 Semi Rugged Market Size Estimates and Forecasts to 2032 (USD Billion)

9. Rugged Tablet Market Segmentation, by Distribution Channel

9.1 Chapter Overview

9.2 Online

9.2.1 Online Market Trends Analysis (2020-2032)

9.2.2 Online Market Size Estimates and Forecasts to 2032 (USD Billion)

9.3 Offline

9.3.1 Offline Market Trends Analysis (2020-2032)

9.3.2 Offline Market Size Estimates and Forecasts to 2032 (USD Billion)

10. Rugged Tablet Market Segmentation, by End-Use Industry

10.1 Chapter Overview

10.2 Oil & Gas

10.2.1 Oil & Gas Market Trends Analysis (2020-2032)

10.2.2 Oil & Gas Market Size Estimates and Forecasts to 2032 (USD Billion)

10.3 Retail

10.3.1 Retail Market Trends Analysis (2020-2032)

10.3.2 Retail Market Size Estimates and Forecasts to 2032 (USD Billion)

10.4 Construction

               10.4.1 Construction Market Trends Analysis (2020-2032)

10.4.2 Construction Market Size Estimates and Forecasts to 2032 (USD Billion)

10.5 Education

10.5.1 Education Market Trends Analysis (2020-2032)

10.5.2 Education Market Size Estimates and Forecasts to 2032 (USD Billion)

10.6 Government

10.6.1 Government Market Trends Analysis (2020-2032)

10.6.2 Government Market Size Estimates and Forecasts to 2032 (USD Billion)

10.7 Food & Beverage

10.7.1 Food & Beverage Market Trends Analysis (2020-2032)

10.7.2 Food & Beverage Market Size Estimates and Forecasts to 2032 (USD Billion)

10.8 Manufacturing

10.8.1 Manufacturing Market Trends Analysis (2020-2032)

10.8.2 Manufacturing Market Size Estimates and Forecasts to 2032 (USD Billion)

10.9 Healthcare

10.9.1 Healthcare Market Trends Analysis (2020-2032)

10.9.2 Healthcare Market Size Estimates and Forecasts to 2032 (USD Billion)

10.10 Transportation & Logistics

10.10.1 Transportation & Logistics Market Trends Analysis (2020-2032)

10.10.2 Transportation & Logistics Market Size Estimates and Forecasts to 2032 (USD Billion)

10.11 Others

10.11.1 Others Market Trends Analysis (2020-2032)

10.11.2 Others Market Size Estimates and Forecasts to 2032 (USD Billion)

11. Regional Analysis

11.1 Chapter Overview

11.2 North America

11.2.1 Trends Analysis

11.2.2 North America Rugged Tablet Market Estimates and Forecasts, by Country (2020-2032) (USD Billion)

11.2.3 North America Rugged Tablet Market Estimates and Forecasts, by Operating System (2020-2032) (USD Billion)  

11.2.4 North America Rugged Tablet Market Estimates and Forecasts, by Type  (2020-2032) (USD Billion)

11.2.5 North America Rugged Tablet Market Estimates and Forecasts, by Distribution Channel (2020-2032) (USD Billion)

11.2.6 North America Rugged Tablet Market Estimates and Forecasts, by End-Use Industry (2020-2032) (USD Billion)

11.2.7 USA

11.2.7.1 USA Rugged Tablet Market Estimates and Forecasts, by Operating System (2020-2032) (USD Billion)

11.2.7.2 USA Rugged Tablet Market Estimates and Forecasts, by Type  (2020-2032) (USD Billion)

11.2.7.3 USA Rugged Tablet Market Estimates and Forecasts, by Distribution Channel (2020-2032) (USD Billion)

11.2.7.4 USA Rugged Tablet Market Estimates and Forecasts, by End-Use Industry (2020-2032) (USD Billion)

11.2.8 Canada

11.2.8.1 Canada Rugged Tablet Market Estimates and Forecasts, by Operating System (2020-2032) (USD Billion)

11.2.8.2 Canada Rugged Tablet Market Estimates and Forecasts, by Type  (2020-2032) (USD Billion)

11.2.8.3 Canada Rugged Tablet Market Estimates and Forecasts, by Distribution Channel (2020-2032) (USD Billion)

11.2.8.4 Canada Rugged Tablet Market Estimates and Forecasts, by End-Use Industry (2020-2032) (USD Billion)

11.2.9 Mexico

11.2.9.1 Mexico Rugged Tablet Market Estimates and Forecasts, by Operating System (2020-2032) (USD Billion)

11.2.9.2 Mexico Rugged Tablet Market Estimates and Forecasts, by Type  (2020-2032) (USD Billion)

11.2.9.3 Mexico Rugged Tablet Market Estimates and Forecasts, by Distribution Channel (2020-2032) (USD Billion)

11.2.9.4 Mexico Rugged Tablet Market Estimates and Forecasts, by End-Use Industry (2020-2032) (USD Billion)

11.3 Europe

11.3.1 Eastern Europe

11.3.1.1 Trends Analysis

11.3.1.2 Eastern Europe Rugged Tablet Market Estimates and Forecasts, by Country (2020-2032) (USD Billion)

11.3.1.3 Eastern Europe Rugged Tablet Market Estimates and Forecasts, by Operating System (2020-2032) (USD Billion)  

11.3.1.4 Eastern Europe Rugged Tablet Market Estimates and Forecasts, by Type  (2020-2032) (USD Billion)

11.3.1.5 Eastern Europe Rugged Tablet Market Estimates and Forecasts, by Distribution Channel (2020-2032) (USD Billion)

11.3.1.6 Eastern Europe Rugged Tablet Market Estimates and Forecasts, by End-Use Industry (2020-2032) (USD Billion)

11.3.1.7 Poland

11.3.1.7.1 Poland Rugged Tablet Market Estimates and Forecasts, by Operating System (2020-2032) (USD Billion)

11.3.1.7.2 Poland Rugged Tablet Market Estimates and Forecasts, by Type  (2020-2032) (USD Billion)

11.3.1.7.3 Poland Rugged Tablet Market Estimates and Forecasts, by Distribution Channel (2020-2032) (USD Billion)

11.3.1.7.4 Poland Rugged Tablet Market Estimates and Forecasts, by End-Use Industry (2020-2032) (USD Billion)

11.3.1.8 Romania

11.3.1.8.1 Romania Rugged Tablet Market Estimates and Forecasts, by Operating System (2020-2032) (USD Billion)

11.3.1.8.2 Romania Rugged Tablet Market Estimates and Forecasts, by Type  (2020-2032) (USD Billion)

11.3.1.8.3 Romania Rugged Tablet Market Estimates and Forecasts, by Distribution Channel (2020-2032) (USD Billion)

11.3.1.8.4 Romania Rugged Tablet Market Estimates and Forecasts, by End-Use Industry (2020-2032) (USD Billion)

11.3.1.9 Hungary

11.3.1.9.1 Hungary Rugged Tablet Market Estimates and Forecasts, by Operating System (2020-2032) (USD Billion)

11.3.1.9.2 Hungary Rugged Tablet Market Estimates and Forecasts, by Type  (2020-2032) (USD Billion)

11.3.1.9.3 Hungary Rugged Tablet Market Estimates and Forecasts, by Distribution Channel (2020-2032) (USD Billion)

11.3.1.9.4 Hungary Rugged Tablet Market Estimates and Forecasts, by End-Use Industry (2020-2032) (USD Billion)

11.3.1.10 Turkey

11.3.1.10.1 Turkey Rugged Tablet Market Estimates and Forecasts, by Operating System (2020-2032) (USD Billion)

11.3.1.10.2 Turkey Rugged Tablet Market Estimates and Forecasts, by Type  (2020-2032) (USD Billion)

11.3.1.10.3 Turkey Rugged Tablet Market Estimates and Forecasts, by Distribution Channel (2020-2032) (USD Billion)

11.3.1.10.4 Turkey Rugged Tablet Market Estimates and Forecasts, by End-Use Industry (2020-2032) (USD Billion)

11.3.1.11 Rest of Eastern Europe

11.3.1.11.1 Rest of Eastern Europe Rugged Tablet Market Estimates and Forecasts, by Operating System (2020-2032) (USD Billion)

11.3.1.11.2 Rest of Eastern Europe Rugged Tablet Market Estimates and Forecasts, by Type  (2020-2032) (USD Billion)

11.3.1.11.3 Rest of Eastern Europe Rugged Tablet Market Estimates and Forecasts, by Distribution Channel (2020-2032) (USD Billion)

11.3.1.11.4 Rest of Eastern Europe Rugged Tablet Market Estimates and Forecasts, by End-Use Industry (2020-2032) (USD Billion)

11.3.2 Western Europe

11.3.2.1 Trends Analysis

11.3.2.2 Western Europe Rugged Tablet Market Estimates and Forecasts, by Country (2020-2032) (USD Billion)

11.3.2.3 Western Europe Rugged Tablet Market Estimates and Forecasts, by Operating System (2020-2032) (USD Billion)  

11.3.2.4 Western Europe Rugged Tablet Market Estimates and Forecasts, by Type  (2020-2032) (USD Billion)

11.3.2.5 Western Europe Rugged Tablet Market Estimates and Forecasts, by Distribution Channel (2020-2032) (USD Billion)

11.3.2.6 Western Europe Rugged Tablet Market Estimates and Forecasts, by End-Use Industry (2020-2032) (USD Billion)

11.3.2.7 Germany

11.3.2.7.1 Germany Rugged Tablet Market Estimates and Forecasts, by Operating System (2020-2032) (USD Billion)

11.3.2.7.2 Germany Rugged Tablet Market Estimates and Forecasts, by Type  (2020-2032) (USD Billion)

11.3.2.7.3 Germany Rugged Tablet Market Estimates and Forecasts, by Distribution Channel (2020-2032) (USD Billion)

11.3.2.7.4 Germany Rugged Tablet Market Estimates and Forecasts, by End-Use Industry (2020-2032) (USD Billion)

11.3.2.8 France

11.3.2.8.1 France Rugged Tablet Market Estimates and Forecasts, by Operating System (2020-2032) (USD Billion)

11.3.2.8.2 France Rugged Tablet Market Estimates and Forecasts, by Type  (2020-2032) (USD Billion)

11.3.2.8.3 France Rugged Tablet Market Estimates and Forecasts, by Distribution Channel (2020-2032) (USD Billion)

11.3.2.8.4 France Rugged Tablet Market Estimates and Forecasts, by End-Use Industry (2020-2032) (USD Billion)

11.3.2.9 UK

11.3.2.9.1 UK Rugged Tablet Market Estimates and Forecasts, by Operating System (2020-2032) (USD Billion)

11.3.2.9.2 UK Rugged Tablet Market Estimates and Forecasts, by Type  (2020-2032) (USD Billion)

11.3.2.9.3 UK Rugged Tablet Market Estimates and Forecasts, by Distribution Channel (2020-2032) (USD Billion)

11.3.2.9.4 UK Rugged Tablet Market Estimates and Forecasts, by End-Use Industry (2020-2032) (USD Billion)

11.3.2.10 Italy

11.3.2.10.1 Italy Rugged Tablet Market Estimates and Forecasts, by Operating System (2020-2032) (USD Billion)

11.3.2.10.2 Italy Rugged Tablet Market Estimates and Forecasts, by Type  (2020-2032) (USD Billion)

11.3.2.10.3 Italy Rugged Tablet Market Estimates and Forecasts, by Distribution Channel (2020-2032) (USD Billion)

11.3.2.10.4 Italy Rugged Tablet Market Estimates and Forecasts, by End-Use Industry (2020-2032) (USD Billion)

11.3.2.11 Spain

11.3.2.11.1 Spain Rugged Tablet Market Estimates and Forecasts, by Operating System (2020-2032) (USD Billion)

11.3.2.11.2 Spain Rugged Tablet Market Estimates and Forecasts, by Type  (2020-2032) (USD Billion)

11.3.2.11.3 Spain Rugged Tablet Market Estimates and Forecasts, by Distribution Channel (2020-2032) (USD Billion)

11.3.2.11.4 Spain Rugged Tablet Market Estimates and Forecasts, by End-Use Industry (2020-2032) (USD Billion)

11.3.2.12 Netherlands

11.3.2.12.1 Netherlands Rugged Tablet Market Estimates and Forecasts, by Operating System (2020-2032) (USD Billion)

11.3.2.12.2 Netherlands Rugged Tablet Market Estimates and Forecasts, by Type  (2020-2032) (USD Billion)

11.3.2.12.3 Netherlands Rugged Tablet Market Estimates and Forecasts, by Distribution Channel (2020-2032) (USD Billion)

11.3.2.12.4 Netherlands Rugged Tablet Market Estimates and Forecasts, by End-Use Industry (2020-2032) (USD Billion)

11.3.2.13 Switzerland

11.3.2.13.1 Switzerland Rugged Tablet Market Estimates and Forecasts, by Operating System (2020-2032) (USD Billion)

11.3.2.13.2 Switzerland Rugged Tablet Market Estimates and Forecasts, by Type  (2020-2032) (USD Billion)

11.3.2.13.3 Switzerland Rugged Tablet Market Estimates and Forecasts, by Distribution Channel (2020-2032) (USD Billion)

11.3.2.13.4 Switzerland Rugged Tablet Market Estimates and Forecasts, by End-Use Industry (2020-2032) (USD Billion)

11.3.2.14 Austria

11.3.2.14.1 Austria Rugged Tablet Market Estimates and Forecasts, by Operating System (2020-2032) (USD Billion)

11.3.2.14.2 Austria Rugged Tablet Market Estimates and Forecasts, by Type  (2020-2032) (USD Billion)

11.3.2.14.3 Austria Rugged Tablet Market Estimates and Forecasts, by Distribution Channel (2020-2032) (USD Billion)

11.3.2.14.4 Austria Rugged Tablet Market Estimates and Forecasts, by End-Use Industry (2020-2032) (USD Billion)

11.3.2.15 Rest of Western Europe

11.3.2.15.1 Rest of Western Europe Rugged Tablet Market Estimates and Forecasts, by Operating System (2020-2032) (USD Billion)

11.3.2.15.2 Rest of Western Europe Rugged Tablet Market Estimates and Forecasts, by Type  (2020-2032) (USD Billion)

11.3.2.15.3 Rest of Western Europe Rugged Tablet Market Estimates and Forecasts, by Distribution Channel (2020-2032) (USD Billion)

11.3.2.15.4 Rest of Western Europe Rugged Tablet Market Estimates and Forecasts, by End-Use Industry (2020-2032) (USD Billion)

11.4 Asia-Pacific

11.4.1 Trends Analysis

11.4.2 Asia-Pacific Rugged Tablet Market Estimates and Forecasts, by Country (2020-2032) (USD Billion)

11.4.3 Asia-Pacific Rugged Tablet Market Estimates and Forecasts, by Operating System (2020-2032) (USD Billion)  

11.4.4 Asia-Pacific Rugged Tablet Market Estimates and Forecasts, by Type  (2020-2032) (USD Billion)

11.4.5 Asia-Pacific Rugged Tablet Market Estimates and Forecasts, by Distribution Channel (2020-2032) (USD Billion)

11.4.6 Asia-Pacific Rugged Tablet Market Estimates and Forecasts, by End-Use Industry (2020-2032) (USD Billion)

11.4.7 China

11.4.7.1 China Rugged Tablet Market Estimates and Forecasts, by Operating System (2020-2032) (USD Billion)

11.4.7.2 China Rugged Tablet Market Estimates and Forecasts, by Type  (2020-2032) (USD Billion)

11.4.7.3 China Rugged Tablet Market Estimates and Forecasts, by Distribution Channel (2020-2032) (USD Billion)

11.4.7.4 China Rugged Tablet Market Estimates and Forecasts, by End-Use Industry (2020-2032) (USD Billion)

11.4.8 India

11.4.8.1 India Rugged Tablet Market Estimates and Forecasts, by Operating System (2020-2032) (USD Billion)

11.4.8.2 India Rugged Tablet Market Estimates and Forecasts, by Type  (2020-2032) (USD Billion)

11.4.8.3 India Rugged Tablet Market Estimates and Forecasts, by Distribution Channel (2020-2032) (USD Billion)

11.4.8.4 India Rugged Tablet Market Estimates and Forecasts, by End-Use Industry (2020-2032) (USD Billion)

11.4.9 Japan

11.4.9.1 Japan Rugged Tablet Market Estimates and Forecasts, by Operating System (2020-2032) (USD Billion)

11.4.9.2 Japan Rugged Tablet Market Estimates and Forecasts, by Type  (2020-2032) (USD Billion)

11.4.9.3 Japan Rugged Tablet Market Estimates and Forecasts, by Distribution Channel (2020-2032) (USD Billion)

11.4.9.4 Japan Rugged Tablet Market Estimates and Forecasts, by End-Use Industry (2020-2032) (USD Billion)

11.4.10 South Korea

11.4.10.1 South Korea Rugged Tablet Market Estimates and Forecasts, by Operating System (2020-2032) (USD Billion)

11.4.10.2 South Korea Rugged Tablet Market Estimates and Forecasts, by Type  (2020-2032) (USD Billion)

11.4.10.3 South Korea Rugged Tablet Market Estimates and Forecasts, by Distribution Channel (2020-2032) (USD Billion)

11.4.10.4 South Korea Rugged Tablet Market Estimates and Forecasts, by End-Use Industry (2020-2032) (USD Billion)

11.4.11 Vietnam

11.4.11.1 Vietnam Rugged Tablet Market Estimates and Forecasts, by Operating System (2020-2032) (USD Billion)

11.4.11.2 Vietnam Rugged Tablet Market Estimates and Forecasts, by Type  (2020-2032) (USD Billion)

11.4.11.3 Vietnam Rugged Tablet Market Estimates and Forecasts, by Distribution Channel (2020-2032) (USD Billion)

11.4.11.4 Vietnam Rugged Tablet Market Estimates and Forecasts, by End-Use Industry (2020-2032) (USD Billion)

11.4.12 Singapore

11.4.12.1 Singapore Rugged Tablet Market Estimates and Forecasts, by Operating System (2020-2032) (USD Billion)

11.4.12.2 Singapore Rugged Tablet Market Estimates and Forecasts, by Type  (2020-2032) (USD Billion)

11.4.12.3 Singapore Rugged Tablet Market Estimates and Forecasts, by Distribution Channel (2020-2032) (USD Billion)

11.4.12.4 Singapore Rugged Tablet Market Estimates and Forecasts, by End-Use Industry (2020-2032) (USD Billion)

11.4.13 Australia

11.4.13.1 Australia Rugged Tablet Market Estimates and Forecasts, by Operating System (2020-2032) (USD Billion)

11.4.13.2 Australia Rugged Tablet Market Estimates and Forecasts, by Type  (2020-2032) (USD Billion)

11.4.13.3 Australia Rugged Tablet Market Estimates and Forecasts, by Distribution Channel (2020-2032) (USD Billion)

11.4.13.4 Australia Rugged Tablet Market Estimates and Forecasts, by End-Use Industry (2020-2032) (USD Billion)

11.4.14 Rest of Asia-Pacific

11.4.14.1 Rest of Asia-Pacific Rugged Tablet Market Estimates and Forecasts, by Operating System (2020-2032) (USD Billion)

11.4.14.2 Rest of Asia-Pacific Rugged Tablet Market Estimates and Forecasts, by Type  (2020-2032) (USD Billion)

11.4.14.3 Rest of Asia-Pacific Rugged Tablet Market Estimates and Forecasts, by Distribution Channel (2020-2032) (USD Billion)

11.4.14.4 Rest of Asia-Pacific Rugged Tablet Market Estimates and Forecasts, by End-Use Industry (2020-2032) (USD Billion)

11.5 Middle East and Africa

11.5.1 Middle East

11.5.1.1 Trends Analysis

11.5.1.2 Middle East Rugged Tablet Market Estimates and Forecasts, by Country (2020-2032) (USD Billion)

11.5.1.3 Middle East Rugged Tablet Market Estimates and Forecasts, by Operating System (2020-2032) (USD Billion)  

11.5.1.4 Middle East Rugged Tablet Market Estimates and Forecasts, by Type  (2020-2032) (USD Billion)

11.5.1.5 Middle East Rugged Tablet Market Estimates and Forecasts, by Distribution Channel (2020-2032) (USD Billion)

11.5.1.6 Middle East Rugged Tablet Market Estimates and Forecasts, by End-Use Industry (2020-2032) (USD Billion)

11.5.1.7 UAE

11.5.1.7.1 UAE Rugged Tablet Market Estimates and Forecasts, by Operating System (2020-2032) (USD Billion)

11.5.1.7.2 UAE Rugged Tablet Market Estimates and Forecasts, by Type  (2020-2032) (USD Billion)

11.5.1.7.3 UAE Rugged Tablet Market Estimates and Forecasts, by Distribution Channel (2020-2032) (USD Billion)

11.5.1.7.4 UAE Rugged Tablet Market Estimates and Forecasts, by End-Use Industry  (2020-2032) (USD Billion)

11.5.1.8 Egypt

11.5.1.8.1 Egypt Rugged Tablet Market Estimates and Forecasts, by Operating System (2020-2032) (USD Billion)

11.5.1.8.2 Egypt Rugged Tablet Market Estimates and Forecasts, by Type  (2020-2032) (USD Billion)

11.5.1.8.3 Egypt Rugged Tablet Market Estimates and Forecasts, by Distribution Channel (2020-2032) (USD Billion)

11.5.1.8.4 Egypt Rugged Tablet Market Estimates and Forecasts, by End-Use Industry (2020-2032) (USD Billion)

11.5.1.9 Saudi Arabia

11.5.1.9.1 Saudi Arabia Rugged Tablet Market Estimates and Forecasts, by Operating System (2020-2032) (USD Billion)

11.5.1.9.2 Saudi Arabia Rugged Tablet Market Estimates and Forecasts, by Type  (2020-2032) (USD Billion)

11.5.1.9.3 Saudi Arabia Rugged Tablet Market Estimates and Forecasts, by Distribution Channel (2020-2032) (USD Billion)

11.5.1.9.4 Saudi Arabia Rugged Tablet Market Estimates and Forecasts, by End-Use Industry (2020-2032) (USD Billion)

11.5.1.10 Qatar

11.5.1.10.1 Qatar Rugged Tablet Market Estimates and Forecasts, by Operating System (2020-2032) (USD Billion)

11.5.1.10.2 Qatar Rugged Tablet Market Estimates and Forecasts, by Type  (2020-2032) (USD Billion)

11.5.1.10.3 Qatar Rugged Tablet Market Estimates and Forecasts, by Distribution Channel (2020-2032) (USD Billion)

11.5.1.10.4 Qatar Rugged Tablet Market Estimates and Forecasts, by End-Use Industry (2020-2032) (USD Billion)

11.5.1.11 Rest of Middle East

11.5.1.11.1 Rest of Middle East Rugged Tablet Market Estimates and Forecasts, by Operating System (2020-2032) (USD Billion)

11.5.1.11.2 Rest of Middle East Rugged Tablet Market Estimates and Forecasts, by Type  (2020-2032) (USD Billion)

11.5.1.11.3 Rest of Middle East Rugged Tablet Market Estimates and Forecasts, by Distribution Channel (2020-2032) (USD Billion)

11.5.1.11.4 Rest of Middle East Rugged Tablet Market Estimates and Forecasts, by End-Use Industry (2020-2032) (USD Billion)

11.5.2 Africa

11.5.2.1 Trends Analysis

11.5.2.2 Africa Rugged Tablet Market Estimates and Forecasts, by Country (2020-2032) (USD Billion)

11.5.2.3 Africa Rugged Tablet Market Estimates and Forecasts, by Operating System (2020-2032) (USD Billion)  

11.5.2.4 Africa Rugged Tablet Market Estimates and Forecasts, by Type  (2020-2032) (USD Billion)

11.5.2.5 Africa Rugged Tablet Market Estimates and Forecasts, by Distribution Channel (2020-2032) (USD Billion)

11.5.2.6 Africa Rugged Tablet Market Estimates and Forecasts, by End-Use Industry (2020-2032) (USD Billion)

11.5.2.7 South Africa

11.5.2.7.1 South Africa Rugged Tablet Market Estimates and Forecasts, by Operating System (2020-2032) (USD Billion)

11.5.2.7.2 South Africa Rugged Tablet Market Estimates and Forecasts, by Type  (2020-2032) (USD Billion)

11.5.2.7.3 South Africa Rugged Tablet Market Estimates and Forecasts, by Distribution Channel (2020-2032) (USD Billion)

11.5.2.7.4 South Africa Rugged Tablet Market Estimates and Forecasts, by End-Use Industry (2020-2032) (USD Billion)

11.5.2.8 Nigeria

11.5.2.8.1 Nigeria Rugged Tablet Market Estimates and Forecasts, by Operating System (2020-2032) (USD Billion)

11.5.2.8.2 Nigeria Rugged Tablet Market Estimates and Forecasts, by Type  (2020-2032) (USD Billion)

11.5.2.8.3 Nigeria Rugged Tablet Market Estimates and Forecasts, by Distribution Channel (2020-2032) (USD Billion)

11.5.2.8.4 Nigeria Rugged Tablet Market Estimates and Forecasts, by End-Use Industry (2020-2032) (USD Billion)

11.5.2.9 Rest of Africa

11.5.2.9.1 Rest of Africa Rugged Tablet Market Estimates and Forecasts, by Operating System (2020-2032) (USD Billion)

11.5.2.9.2 Rest of Africa Rugged Tablet Market Estimates and Forecasts, by Type  (2020-2032) (USD Billion)

11.5.2.9.3 Rest of Africa Rugged Tablet Market Estimates and Forecasts, by Distribution Channel (2020-2032) (USD Billion)

11.5.2.9.4 Rest of Africa Rugged Tablet Market Estimates and Forecasts, by End-Use Industry (2020-2032) (USD Billion)

11.6 Latin America

11.6.1 Trends Analysis

11.6.2 Latin America Rugged Tablet Market Estimates and Forecasts, by Country (2020-2032) (USD Billion)

11.6.3 Latin America Rugged Tablet Market Estimates and Forecasts, by Operating System (2020-2032) (USD Billion)  

11.6.4 Latin America Rugged Tablet Market Estimates and Forecasts, by Type  (2020-2032) (USD Billion)

11.6.5 Latin America Rugged Tablet Market Estimates and Forecasts, by Distribution Channel (2020-2032) (USD Billion)

11.6.6 Latin America Rugged Tablet Market Estimates and Forecasts, by End-Use Industry (2020-2032) (USD Billion)

11.6.7 Brazil

11.6.7.1 Brazil Rugged Tablet Market Estimates and Forecasts, by Operating System (2020-2032) (USD Billion)

11.6.7.2 Brazil Rugged Tablet Market Estimates and Forecasts, by Type  (2020-2032) (USD Billion)

11.6.7.3 Brazil Rugged Tablet Market Estimates and Forecasts, by Distribution Channel (2020-2032) (USD Billion)

11.6.7.4 Brazil Rugged Tablet Market Estimates and Forecasts, by End-Use Industry (2020-2032) (USD Billion)

11.6.8 Argentina

11.6.8.1 Argentina Rugged Tablet Market Estimates and Forecasts, by Operating System (2020-2032) (USD Billion)

11.6.8.2 Argentina Rugged Tablet Market Estimates and Forecasts, by Type  (2020-2032) (USD Billion)

11.6.8.3 Argentina Rugged Tablet Market Estimates and Forecasts, by Distribution Channel (2020-2032) (USD Billion)

11.6.8.4 Argentina Rugged Tablet Market Estimates and Forecasts, by End-Use Industry (2020-2032) (USD Billion)

11.6.9 Colombia

11.6.9.1 Colombia Rugged Tablet Market Estimates and Forecasts, by Operating System (2020-2032) (USD Billion)

11.6.9.2 Colombia Rugged Tablet Market Estimates and Forecasts, by Type  (2020-2032) (USD Billion)

11.6.9.3 Colombia Rugged Tablet Market Estimates and Forecasts, by Distribution Channel (2020-2032) (USD Billion)

11.6.9.4 Colombia Rugged Tablet Market Estimates and Forecasts, by End-Use Industry (2020-2032) (USD Billion)

11.6.10 Rest of Latin America

11.6.10.1 Rest of Latin America Rugged Tablet Market Estimates and Forecasts, by Operating System (2020-2032) (USD Billion)

11.6.10.2 Rest of Latin America Rugged Tablet Market Estimates and Forecasts, by Type  (2020-2032) (USD Billion)

11.6.10.3 Rest of Latin America Rugged Tablet Market Estimates and Forecasts, by Distribution Channel (2020-2032) (USD Billion)

11.6.10.4 Rest of Latin America Rugged Tablet Market Estimates and Forecasts, by End-Use Industry (2020-2032) (USD Billion)

12. Company Profiles

12.1 Panasonic

12.1.1 Company Overview

12.1.2 Financial

12.1.3 Products/ Services Offered

12.1.4 SWOT Analysis

12.2 Getac

12.2.1 Company Overview

12.2.2 Financial

12.2.3 Products/ Services Offered

12.2.4 SWOT Analysis

12.3 Zebra Technologies

12.3.1 Company Overview

12.3.2 Financial

12.3.3 Products/ Services Offered

12.3.4 SWOT Analysis

12.4 Dell Technologies

12.4.1 Company Overview

12.4.2 Financial

12.4.3 Products/ Services Offered

12.4.4 SWOT Analysis

12.5 Microsoft

12.5.1 Company Overview

12.5.2 Financial

12.5.3 Products/ Services Offered

12.5.4 SWOT Analysis

12.6 Xplore Technologies

12.6.1 Company Overview

12.6.2 Financial

12.6.3 Products/ Services Offered

12.6.4 SWOT Analysis

12.7 Honeywell

12.7.1 Company Overview

12.7.2 Financial

12.7.3 Products/ Services Offered

12.7.4 SWOT Analysis

12.8 MobileDemand, L.C.

12.8.1 Company Overview

12.8.2 Financial

12.8.3 Products/ Services Offered

12.8.4 SWOT Analysis

12.9 Advantech

12.9.1 Company Overview

12.9.2 Financial

12.9.3 Products/ Services Offered

12.9.4 SWOT Analysis

12.10 TabletKiosk

12.10.1 Company Overview

12.10.2 Financial

12.10.3 Products/ Services Offered

12.10.4 SWOT Analysis

13. Use Cases and Best Practices

14. Conclusion

An accurate research report requires proper strategizing as well as implementation. There are multiple factors involved in the completion of good and accurate research report and selecting the best methodology to compete the research is the toughest part. Since the research reports we provide play a crucial role in any company’s decision-making process, therefore we at SNS Insider always believe that we should choose the best method which gives us results closer to reality. This allows us to reach at a stage wherein we can provide our clients best and accurate investment to output ratio.

Each report that we prepare takes a timeframe of 350-400 business hours for production. Starting from the selection of titles through a couple of in-depth brain storming session to the final QC process before uploading our titles on our website we dedicate around 350 working hours. The titles are selected based on their current market cap and the foreseen CAGR and growth.


The 5 steps process:

Step 1: Secondary Research:

Secondary Research or Desk Research is as the name suggests is a research process wherein, we collect data through the readily available information. In this process we use various paid and unpaid databases which our team has access to and gather data through the same. This includes examining of listed companies’ annual reports, Journals, SEC filling etc. Apart from this our team has access to various associations across the globe across different industries. Lastly, we have exchange relationships with various university as well as individual libraries.

Secondary Research

Step 2: Primary Research

When we talk about primary research, it is a type of study in which the researchers collect relevant data samples directly, rather than relying on previously collected data.  This type of research is focused on gaining content specific facts that can be sued to solve specific problems. Since the collected data is fresh and first hand therefore it makes the study more accurate and genuine.

We at SNS Insider have divided Primary Research into 2 parts.

Part 1 wherein we interview the KOLs of major players as well as the upcoming ones across various geographic regions. This allows us to have their view over the market scenario and acts as an important tool to come closer to the accurate market numbers. As many as 45 paid and unpaid primary interviews are taken from both the demand and supply side of the industry to make sure we land at an accurate judgement and analysis of the market.

This step involves the triangulation of data wherein our team analyses the interview transcripts, online survey responses and observation of on filed participants. The below mentioned chart should give a better understanding of the part 1 of the primary interview.

Primary Research

Part 2: In this part of primary research the data collected via secondary research and the part 1 of the primary research is validated with the interviews from individual consultants and subject matter experts.

Consultants are those set of people who have at least 12 years of experience and expertise within the industry whereas Subject Matter Experts are those with at least 15 years of experience behind their back within the same space. The data with the help of two main processes i.e., FGDs (Focused Group Discussions) and IDs (Individual Discussions). This gives us a 3rd party nonbiased primary view of the market scenario making it a more dependable one while collation of the data pointers.

Step 3: Data Bank Validation

Once all the information is collected via primary and secondary sources, we run that information for data validation. At our intelligence centre our research heads track a lot of information related to the market which includes the quarterly reports, the daily stock prices, and other relevant information. Our data bank server gets updated every fortnight and that is how the information which we collected using our primary and secondary information is revalidated in real time.

Data Bank Validation

Step 4: QA/QC Process

After all the data collection and validation our team does a final level of quality check and quality assurance to get rid of any unwanted or undesired mistakes. This might include but not limited to getting rid of the any typos, duplication of numbers or missing of any important information. The people involved in this process include technical content writers, research heads and graphics people. Once this process is completed the title gets uploader on our platform for our clients to read it.

Step 5: Final QC/QA Process:

This is the last process and comes when the client has ordered the study. In this process a final QA/QC is done before the study is emailed to the client. Since we believe in giving our clients a good experience of our research studies, therefore, to make sure that we do not lack at our end in any way humanly possible we do a final round of quality check and then dispatch the study to the client.

Key Segments:

By Operating System

  • Windows

  • iOS

  • Android

  • Others

By Type

  • Fully Rugged

  • Semi Rugged

By Distribution Channel

  • Online

  • Offline

By End-Use Industry

  • Oil & Gas

  • Retail

  • Construction

  • Education

  • Government

  • Food & Beverage

  • Manufacturing

  • Healthcare

  • Transportation & Logistics

  • Others

Request for Segment Customization as per your Business Requirement: Segment Customization Request

REGIONAL COVERAGE:

North America

  • US

  • Canada

  • Mexico

Europe

  • Eastern Europe

    • Poland

    • Romania

    • Hungary

    • Turkey

    • Rest of Eastern Europe

  • Western Europe

    • Germany

    • France

    • UK

    • Italy

    • Spain

    • Netherlands

    • Switzerland

    • Austria

    • Rest of Western Europe

Asia-Pacific

  • China

  • India

  • Japan

  • South Korea

  • Vietnam

  • Singapore

  • Australia

  • Rest of Asia Pacific

Middle East & Africa

  • Middle East

    • UAE

    • Egypt

    • Saudi Arabia

    • Qatar

    • Rest of the Middle East

  • Africa

    • Nigeria

    • South Africa

    • Rest of Africa

Latin America

  • Brazil

  • Argentina

  • Colombia

  • Rest of Latin America

Request for Country Level Research Report: Country Level Customization Request

Available Customization

With the given market data, SNS Insider offers customization as per the company’s specific needs. The following customization options are available for the report:

  • Product Analysis

  • Criss-Cross segment analysis (e.g. Product X Application)

  • Product Matrix which gives a detailed comparison of the product portfolio of each company

  • Geographic Analysis

  • Additional countries in any of the regions

  • Company Information

  • Detailed analysis and profiling of additional market players (Up to five)


  •            5000 (33% Discount)


  •            8950 (40% Discount)


  •            3050 (23% Discount)

Start a Conversation

Hi! Click one of our member below to chat on Phone