image

Rugged Display Market Report Scope & Overview:

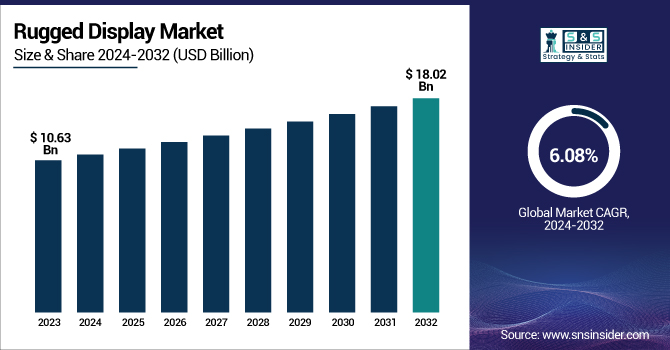
The Rugged Display Market Size was valued at USD 10.63 Billion in 2023 and is expected to reach USD 18.02 Billion by 2032 and grow at a CAGR of 6.08% over the forecast period 2024-2032. The rugged field of display is advancing towards better ruggedness, sunlight readability, and touch technologies leveraging reinforced glass and anti-glare coatings to enhance usability and haptic feedback in touch as the decade moves forward. With demand accelerating in the defense, industrial, and automotive sectors, fab capacity utilization will continue to be an important metric for manufacturers as they try to maximize production efficiency to meet demand. Trends in connectivity emphasize 5G, IoT connection, and wireless communication to facilitate data exchange in a challenging environment. Power consumption efficiency is also increasing with technologies such as adaptive brightness, low-power processors, and energy-efficient display panels, extending their operational life, particularly for battery-powered rugged devices used in mission-critical applications such as military, aerospace, and field services.

The U.S. Rugged Display Market is estimated to be USD 3.04 Billion in 2023 and is projected to grow at a CAGR of 5.94%. The rugged display market in the U.S. is gaining momentum as a result of increasing military modernization programs, as well as the overall growth in autonomous vehicles, and growing demand for the development of mission-critical communication systems. Market growth is also driven by the demand for long-lasting high-performance displays in extreme environments and innovation in AI-enabled diagnostics and real-time data visualization.

Market Dynamics

Key Drivers: 

  • Rugged Display Market Grows with Rising Demand in Defense Industrial Automation and Advanced Display Technologies

Demand for tough displays in industries like military, aerospace, automotive, and industrial automation is boosting growth in the rugged display market. One of the growth drivers is the increasing utilization of ruggedized handheld devices, tablets, and vehicle-mounted computers in field operations, logistics, and defense applications. Essentially the growing requirement for ultra-rugged & fully rugged displays because displays need to be capable of sustaining and functioning in extreme environments including high temperatures, vibrations, and moisture is driving the growth of the market. Furthermore, display technologies such as OLED, sunlight-readable displays, and impact-resistant touch panels are likely to promote the adoption of the products. Another factor contributing to the high demand for rugged displays is the increasing use of IoT and AI in industrial automation as the new-age rugged displays provide real-time monitoring and data visualization in harsh environments.

Restrain:

  • The Rugged Display Market Faces Challenges in Balancing Durability High-Performance Visibility and Next-Gen Integration

The critical obstacle in the rugged display market deals with the technology that is restricted by ruggedness. Rugged displays withstand extreme conditions however providing high-performance features like ultra-high resolution, fast refresh rates, and advanced touch without losing on durability is a challenge. While there have been improvements in anti-glare and high-brightness technologies, visibility problems under direct sunlight, still linger among many rugged displays. Further, human-machine interface with glove-wearers and wet-condition usage is still seen as a technical challenge for industries like defense, aviation, and industrial automation, employing workers in harsh working situations. Rugged display manufacturers are also suffering from integration challenges when it comes to compatibility with next-gen connectivity standards, i.e., 5G and AI-based interfaces.

Opportunity: 

  • Rugged Display Market Sees Growth with Industry 40 Smart Factories 5G Expansion and Defense Modernization

Emerging markets and Industry 4.0 are expected to offer significant opportunities as rugged displays are increasingly used in smart factories, mines, and construction sites. 5G expansion and edge computing, are also predicted to increase connectivity and productivity for ruggedized mobile devices. Moreover, increasing investment in defense modernization and the advent of autonomous military vehicles is creating profitable growth opportunities for rugged display manufacturers. Going forward, companies that balance lightweight, low-energy and AI-driven rugged displays will have a competitive advantage.

Challenges:

  • Rugged Display Market Faces Challenges with Size Weight Ergonomics and Lack of Industry Standardization

Size and weight limitations can be also a huge restraint besides the above which can affect how portable and usable a rugged display is in applications where small size and weight are important. The high level of added protection of rugged displays tends to result in very bulky designs, which lose some degree of ergonomic comfort for handheld and wearable applications. Fragmentation is also created in the market as there is little standardization across industries which also means that manufacturers often cannot build rugged displays that will be compatible across all sectors. Solving these problems will demand advances in material science, engineering display efficiency, and ergonomics to mitigate the often very high-performance display features at the compromise of durability.

Segment Analysis

By Product

The Smartphone & Handheld Computer segment held the largest share of the rugged display market with 34.6% of the total market share in 2023. Growing demand for rugged smartphones and handheld devices in military, logistics, construction, and field services has fueled this dominance. This is useful for professionals whose work environments may be harsh therefore these devices have extra durability,  impact resistance, and water/dust protection. The 5G connectivity,  AI applications, and an advanced touchscreen have fueled their adoption.

During the forecast period 2024 to 2032, the Vehicle-Mounted Computer segment is expected to grow at the most rapid CAGR. This growth comes from increasing demand for fleet management solutions, warehouse automation, and military vehicle systems. Features such as Real-time data access, GPS tracking, and communication further improve the operational efficiency offered by these rugged displays. The growing demand for autonomous vehicles, smart logistics, and connected transportation has also been driving market growth.

By Display Size

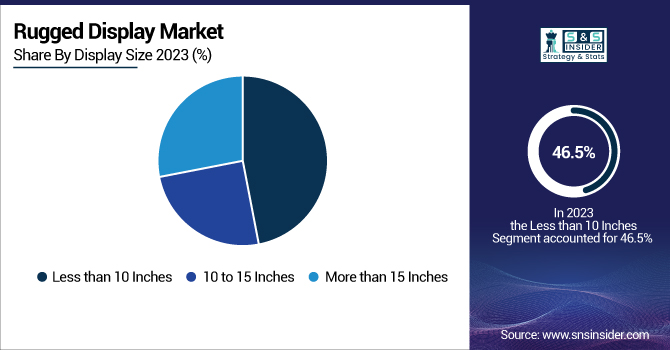
The Less than 10 Inches segment dominated the market share with 46.5% in 2023 and is anticipated to grow at the fastest CAGR from 2024 to 2032 The growth is attributed to rugged smartphones,  handheld computers, and handheld industrial devices gaining widespread usage in industries including logistics, defense, healthcare, and manufacturing. These smaller-sized rugged displays are portable, and robust, and can support high-performance touchscreen operation making them perfect for field applications and rough environments Other trends such as sunlight-readable displays, impact-resistant screens, and energy-efficient technologies are also contributing to their increasing demand. Additionally, the growing focus on IoT-based smart devices, real-time data monitoring, and AI-based industrial automation is further prompting the rapid growth of this segment.

By Level of Ruggedness

The Fully Rugged segment accounted for the largest market share as of 2023 with 45.7% as it continues to see the most penetration in military, aerospace, industrial, and public safety applications. These displays are designed for mission-critical operations where durability, exposure to extreme temperatures, shock, and moisture are a must. The growth of market growth is further fueled by Government and Defense as well as Industrial use of rugged laptops, tablets, and hand devices. Moreover, improvements in touch panels with impact resistance, sunlight-readable displays, and connectivity features have added to the demand for fully rugged displays.

Due to the increasing demand for high durability required for mining, oil & gas, and military operations, the Ultra-Rugged segment will witness the fastest CAGR from 2024-2032. These screens are created to be used under the most extreme conditions,  involving high pressure, significant impact, and highly corrosive material. Relentless demand is expected as rugged displays fit in line with industries' preference for uncompromised reliability and lifespan.

By Vertical

The Automotive & Transportation segment held the largest market share in 2023 at 34.9%, attributed to the growing adoption of rugged displays for use in commercial vehicles, fleet management as well as railway systems. This information will also be displayed on many of the in-car displays which are playing an ever-expanding role in GPS and infotainment systems as well as advanced driver-assistance systems (ADAS) to aid in operational performance and optimize safety. This dominance is due to an increased trend towards connected and autonomous vehicles as well as the growing need for rugged, high-performance touch screens in vehicles. Also, improvements in sunlight-readable and vibration-resistant display technologies have driven more adoption in trucking, aviation, and maritime applications.

Due to the quick uptake of Industry 4.0 and IoT-enabled manufacturing,  as well as the usage of automation technology, the Industrial segment is anticipated to achieve the highest CAGR from 2024 to 2032. Rugged displays serve in factories, warehouses, and outdoor industrial sites, where extreme conditions need a shockproof screen and a waterproof and dustproof screen. This increasing need for smart and connected industrial systems will propel this market ahead.

Regional Analysis

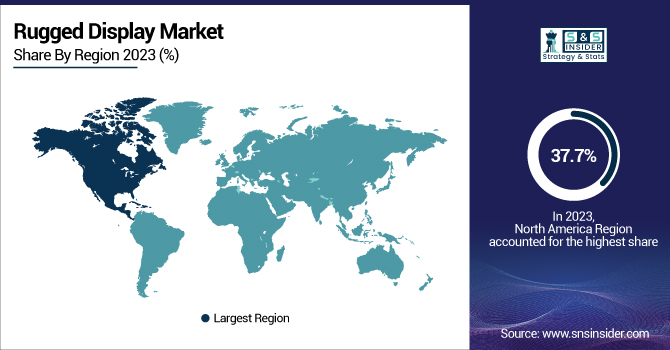
In 2023, North America was the leading regional market for rugged displays with a 37.7% share, supported by the military, aerospace, automotive, and industrial applications. Shifts in the ruggedized mission-critical displays market Ruggedized mission-critical displays have experienced an upward shift, following the arrival of prime defense contractors Lockheed Martin, Boeing, and Raytheon. Tesla and Ford use rugged displays in autonomous vehicle systems due to innovative uses in fleet management solutions in the automotive and transportation sectors. Furthermore, smart warehouses & automated logistics gaining traction, spearheaded by Amazon and FedEx, have witnessed increased demand for rugged handheld computers and vehicle-mounted displays in logistics and supply chain management. R&D Enhancement in this region and government initiatives to modernize the defense sector and defense manufacturing industry are contributing to the regional market growth.

Due to rapid industrialization, growing military expenditure, and a strong automotive industry, Asia Pacific is projected to register the highest CAGR during the years 2024 to 2032. With China and India heavily investing in defense and aerospace, the demand for ultra-rugged displays is expected to increase in military vehicles and aircraft. For instance, in the manufacturing sector, companies such as Foxconn and Tata Group are integrating rugged displays in smart factories and automated production lines. With the increasing logistics and e-commerce sector presence and expansion of domestic giants such as Alibaba and Flipkart in the region, demand for rugged tablets and handheld devices for warehouse automation and last-mile delivery is expected to spur significantly. Asia Pacific is anticipated to be one of the fastest-growing markets due to the rapid rollout of 5G connectivity, IoT integration, and smart city projects.

Key players

Some of the major players in the Rugged Display Market are:

  • Dell Inc. (Latitude Rugged Series),

  • Getac Technology Corp. (Getac F110 Rugged Tablet),

  • General Dynamics Corp. (Itronix GD8000),

  • Zebra Technologies Corp. (Zebra ET5X Rugged Tablet),

  • L3 Technologies Inc. (L3 Ruggedized Display Systems),

  • Panasonic Corporation (Toughbook Series),

  • Curtiss-Wright Corp. (Rugged LCD Mission Displays),

  • Aayur Technology Solutions Pvt. Ltd (Custom Rugged Flat Panel Displays),

  • Vista Consoles Electronics Pvt Ltd (MIL Grade Rugged Displays),

  • E3 Displays (Rugged Industrial Touchscreen Solutions),

  • Mulder-Hardenberg (Marine and Military Rugged Displays),

  • Sparton Corp. (Ruggedized Displays for Defense Applications),

  • SCIO Teq (Rugged Avionics Displays),

  • Honeywell International Inc. (Rugged Mobile Computers),

  • Trimble Inc. (Rugged Handheld Computers).

Recent Trends

  • In November 2024, Dell's new Pro Rugged 14 laptop now features the NVIDIA RTX 500 Ada GPU, enhancing graphics and AI performance for demanding field applications.

  • In March 2025, Hertz deployed Getac’s UX10 rugged tablets to enhance customer service and streamline operations, reducing wait times and improving efficiency. The devices aid in damage documentation, VIN scanning, and seamless vehicle tracking, ensuring reliability in various conditions.

Rugged Display Market Report Scope:

Report Attributes Details
Market Size in 2023 USD 10.63 Billion
Market Size by 2032 USD 18.02 Billion
CAGR CAGR of 6.08% From 2024 to 2032
Base Year 2023
Forecast Period 2024-2032
Historical Data 2020-2022
Report Scope & Coverage Market Size, Segments Analysis, Competitive  Landscape, Regional Analysis, DROC & SWOT Analysis, Forecast Outlook
Key Segments • By Product (Smartphone & Handheld Computer, Tablet PC, Panel PC & Mission-Critical Display, Laptop & Notebook, Avionics Display, Vehicle-Mounted Computer)
• By Display Size (Less than 10 Inches, 10 to 15 Inches, More than 15 Inches)
• By Level of Ruggedness (Ultra-Rugged, Fully Rugged, Semi-Rugged)
• By Vertical (Automotive & Transportation, Government, Defense, & Aerospace, Healthcare, Industrial, Others)
Regional Analysis/Coverage North America (US, Canada, Mexico), Europe (Eastern Europe [Poland, Romania, Hungary, Turkey, Rest of Eastern Europe] Western Europe] Germany, France, UK, Italy, Spain, Netherlands, Switzerland, Austria, Rest of Western Europe]), Asia Pacific (China, India, Japan, South Korea, Vietnam, Singapore, Australia, Rest of Asia Pacific), Middle East & Africa (Middle East [UAE, Egypt, Saudi Arabia, Qatar, Rest of Middle East], Africa [Nigeria, South Africa, Rest of Africa], Latin America (Brazil, Argentina, Colombia, Rest of Latin America)
Company Profiles Dell Inc., Getac Technology Corp., General Dynamics Corp., Zebra Technologies Corp., L3 Technologies Inc., Panasonic Corporation, Curtiss-Wright Corp., Aayur Technology Solutions Pvt. Ltd, Vista Consoles Electronics Pvt Ltd, E3 Displays, Mulder-Hardenberg, Sparton Corp., SCIO Teq, Honeywell International Inc., Trimble Inc.

Frequently Asked Questions

Ans:  The Rugged Display Market is expected to grow at a CAGR of 6.08%.

Ans: The Rugged Display Market size was USD 10.63 billion in 2023 and is expected to Reach USD 18.02 billion by 2032.

Ans: The major key drivers for the growth of the Rugged Display Market include increasing demand from defense, industrial automation, automotive, and transportation sectors, along with advancements in durability, connectivity (5G, IoT), and high-brightness display technologies.

Ans: The Smartphone & Handheld Computer segment dominated the Rugged Display market in 2023.

Ans: In 2023, the North America region led the Rugged Display market, capturing approximately 37.77% of the total market share.

Table of Contents:

1. Introduction

1.1 Market Definition

1.2 Scope (Inclusion and Exclusions)

1.3 Research Assumptions

2. Executive Summary

2.1 Market Overview

2.2 Regional Synopsis

2.3 Competitive Summary

3. Research Methodology

3.1 Top-Down Approach

3.2 Bottom-up Approach

3.3. Data Validation

3.4 Primary Interviews

4. Market Dynamics Impact Analysis

4.1 Market Driving Factors Analysis

4.1.1 Drivers

4.1.2 Restraints

4.1.3 Opportunities

4.1.4 Challenges

4.2 PESTLE Analysis

4.3 Porter’s Five Forces Model

5. Statistical Insights and Trends Reporting

5.1 Rugged Display Technology Trends

5.2 Fab Capacity Utilization

5.3 Connectivity & Integration Trends

5.4 Power Consumption Efficiency Trends

6. Competitive Landscape

6.1 List of Major Companies, By Region

6.2 Market Share Analysis, By Region

6.3 Product Benchmarking

6.3.1 Product specifications and features

6.3.2 Pricing

6.4 Strategic Initiatives

6.4.1 Marketing and promotional activities

6.4.2 Distribution and Supply Chain Strategies

6.4.3 Expansion plans and new product launches

6.4.4 Strategic partnerships and collaborations

6.5 Technological Advancements

6.6 Market Positioning and Branding

7. Rugged Display Market Segmentation, By Product

7.1 Chapter Overview

7.2 Smartphone & Handheld Computer

7.2.1 Smartphone & Handheld Computer Market Trends Analysis (2020-2032)

7.2.2 Smartphone & Handheld Computer Market Size Estimates and Forecasts to 2032 (USD Billion)

7.3 Tablet PC

7.3.1 Tablet PC Market Trends Analysis (2020-2032)

7.3.2 Tablet PC Market Size Estimates and Forecasts to 2032 (USD Billion)

7.4 Panel PC & Mission-Critical Display

7.4.1 Panel PC & Mission-Critical Display Market Trends Analysis (2020-2032)

7.4.2 Panel PC & Mission-Critical Display Market Size Estimates and Forecasts to 2032 (USD Billion)

7.5 Laptop & Notebook

7.5.1 Laptop & Notebook Market Trends Analysis (2020-2032)

7.5.2 Laptop & Notebook Market Size Estimates and Forecasts to 2032 (USD Billion)

7.6 Avionics Display

7.6.1 Avionics Display Market Trends Analysis (2020-2032)

7.6.2 Avionics Display Market Size Estimates and Forecasts to 2032 (USD Billion)

7.7 Vehicle-Mounted Computer

7.7.1 Vehicle-Mounted Computer Market Trends Analysis (2020-2032)

7.7.2 Vehicle-Mounted Computer Market Size Estimates and Forecasts to 2032 (USD Billion)

8. Rugged Display Market Segmentation, By Display Size

8.1 Chapter Overview

8.2 Less than 10 Inches

8.2.1 Less than 10 Inches Market Trends Analysis (2020-2032)

8.2.2 Less than 10 Inches Market Size Estimates and Forecasts to 2032 (USD Billion)

8.3 10 to 15 Inches

8.3.1 10 to 15 Inches Market Trends Analysis (2020-2032)

8.3.2 10 to 15 Inches Market Size Estimates and Forecasts to 2032 (USD Billion)

8.4 More than 15 Inches

8.4.1 More than 15 Inches Market Trends Analysis (2020-2032)

8.4.2 More than 15 Inches Market Size Estimates and Forecasts to 2032 (USD Billion)

9. Rugged Display Market Segmentation, By Level of Ruggedness

9.1 Chapter Overview

9.2 Ultra-Rugged

9.2.1 Ultra-Rugged Market Trends Analysis (2020-2032)

9.2.2 Ultra-Rugged Market Size Estimates and Forecasts to 2032 (USD Billion)

9.3 Fully Rugged

9.3.1 Fully Rugged Market Trends Analysis (2020-2032)

9.3.2 Fully Rugged Market Size Estimates and Forecasts to 2032 (USD Billion)

9.4 Semi-Rugged

9.4.1 Semi-Rugged Market Trends Analysis (2020-2032)

9.4.2 Semi-Rugged Market Size Estimates and Forecasts to 2032 (USD Billion)

10. Rugged Display Market Segmentation, By Vertical

10.1 Chapter Overview

10.2 Automotive & Transportation

10.2.1 Automotive & Transportation Market Trends Analysis (2020-2032)

10.2.2 Automotive & Transportation Market Size Estimates and Forecasts to 2032 (USD Billion)

10.3 Government, Defense, & Aerospace

10.3.1 Government, Defense, & Aerospace Market Trends Analysis (2020-2032)

10.3.2 Government, Defense, & Aerospace Market Size Estimates and Forecasts to 2032 (USD Billion)

10.4 Healthcare

10.4.1 Healthcare Market Trends Analysis (2020-2032)

10.4.2 Healthcare Market Size Estimates and Forecasts to 2032 (USD Billion)

10.5 Industrial

10.5.1 Industrial Market Trends Analysis (2020-2032)

10.5.2 Industrial Market Size Estimates and Forecasts to 2032 (USD Billion)

10.6 Others

10.6.1 Others Market Trends Analysis (2020-2032)

10.6.2 Others Market Size Estimates and Forecasts to 2032 (USD Billion)

11. Regional Analysis

11.1 Chapter Overview

11.2 North America

11.2.1 Trends Analysis

11.2.2 North America Rugged Display Market Estimates and Forecasts, by Country (2020-2032) (USD Billion)

11.2.3 North America Rugged Display Market Estimates and Forecasts, By Product (2020-2032) (USD Billion) 

11.2.4 North America Rugged Display Market Estimates and Forecasts, By Display Size (2020-2032) (USD Billion)

11.2.5 North America Rugged Display Market Estimates and Forecasts, By Level of Ruggedness (2020-2032) (USD Billion)

11.2.6 North America Rugged Display Market Estimates and Forecasts, By Vertical (2020-2032) (USD Billion)

11.2.7 USA

11.2.7.1 USA Rugged Display Market Estimates and Forecasts, By Product (2020-2032) (USD Billion)

11.2.7.2 USA Rugged Display Market Estimates and Forecasts, By Display Size (2020-2032) (USD Billion)

11.2.7.3 USA Rugged Display Market Estimates and Forecasts, By Level of Ruggedness (2020-2032) (USD Billion)

11.2.7.4 USA Rugged Display Market Estimates and Forecasts, By Vertical (2020-2032) (USD Billion)

11.2.8 Canada

11.2.8.1 Canada Rugged Display Market Estimates and Forecasts, By Product (2020-2032) (USD Billion)

11.2.8.2 Canada Rugged Display Market Estimates and Forecasts, By Display Size (2020-2032) (USD Billion)

11.2.8.3 Canada Rugged Display Market Estimates and Forecasts, By Level of Ruggedness (2020-2032) (USD Billion)

11.2.8.4 Canada Rugged Display Market Estimates and Forecasts, By Vertical (2020-2032) (USD Billion)

11.2.9 Mexico

11.2.9.1 Mexico Rugged Display Market Estimates and Forecasts, By Product (2020-2032) (USD Billion)

11.2.9.2 Mexico Rugged Display Market Estimates and Forecasts, By Display Size (2020-2032) (USD Billion)

11.2.9.3 Mexico Rugged Display Market Estimates and Forecasts, By Level of Ruggedness (2020-2032) (USD Billion)

11.2.9.4 Mexico Rugged Display Market Estimates and Forecasts, By Vertical (2020-2032) (USD Billion)

11.3 Europe

11.3.1 Eastern Europe

11.3.1.1 Trends Analysis

11.3.1.2 Eastern Europe Rugged Display Market Estimates and Forecasts, by Country (2020-2032) (USD Billion)

11.3.1.3 Eastern Europe Rugged Display Market Estimates and Forecasts, By Product (2020-2032) (USD Billion) 

11.3.1.4 Eastern Europe Rugged Display Market Estimates and Forecasts, By Display Size (2020-2032) (USD Billion)

11.3.1.5 Eastern Europe Rugged Display Market Estimates and Forecasts, By Level of Ruggedness (2020-2032) (USD Billion)

11.3.1.6 Eastern Europe Rugged Display Market Estimates and Forecasts, By Vertical (2020-2032) (USD Billion)

11.3.1.7 Poland

11.3.1.7.1 Poland Rugged Display Market Estimates and Forecasts, By Product (2020-2032) (USD Billion)

11.3.1.7.2 Poland Rugged Display Market Estimates and Forecasts, By Display Size (2020-2032) (USD Billion)

11.3.1.7.3 Poland Rugged Display Market Estimates and Forecasts, By Level of Ruggedness (2020-2032) (USD Billion)

11.3.1.7.4 Poland Rugged Display Market Estimates and Forecasts, By Vertical (2020-2032) (USD Billion)

11.3.1.8 Romania

11.3.1.8.1 Romania Rugged Display Market Estimates and Forecasts, By Product (2020-2032) (USD Billion)

11.3.1.8.2 Romania Rugged Display Market Estimates and Forecasts, By Display Size (2020-2032) (USD Billion)

11.3.1.8.3 Romania Rugged Display Market Estimates and Forecasts, By Level of Ruggedness (2020-2032) (USD Billion)

11.3.1.8.4 Romania Rugged Display Market Estimates and Forecasts, By Vertical (2020-2032) (USD Billion)

11.3.1.9 Hungary

11.3.1.9.1 Hungary Rugged Display Market Estimates and Forecasts, By Product (2020-2032) (USD Billion)

11.3.1.9.2 Hungary Rugged Display Market Estimates and Forecasts, By Display Size (2020-2032) (USD Billion)

11.3.1.9.3 Hungary Rugged Display Market Estimates and Forecasts, By Level of Ruggedness (2020-2032) (USD Billion)

11.3.1.9.4 Hungary Rugged Display Market Estimates and Forecasts, By Vertical (2020-2032) (USD Billion)

11.3.1.10 Turkey

11.3.1.10.1 Turkey Rugged Display Market Estimates and Forecasts, By Product (2020-2032) (USD Billion)

11.3.1.10.2 Turkey Rugged Display Market Estimates and Forecasts, By Display Size (2020-2032) (USD Billion)

11.3.1.10.3 Turkey Rugged Display Market Estimates and Forecasts, By Level of Ruggedness (2020-2032) (USD Billion)

11.3.1.10.4 Turkey Rugged Display Market Estimates and Forecasts, By Vertical (2020-2032) (USD Billion)

11.3.1.11 Rest of Eastern Europe

11.3.1.11.1 Rest of Eastern Europe Rugged Display Market Estimates and Forecasts, By Product (2020-2032) (USD Billion)

11.3.1.11.2 Rest of Eastern Europe Rugged Display Market Estimates and Forecasts, By Display Size (2020-2032) (USD Billion)

11.3.1.11.3 Rest of Eastern Europe Rugged Display Market Estimates and Forecasts, By Level of Ruggedness (2020-2032) (USD Billion)

11.3.1.11.4 Rest of Eastern Europe Rugged Display Market Estimates and Forecasts, By Vertical (2020-2032) (USD Billion)

11.3.2 Western Europe

11.3.2.1 Trends Analysis

11.3.2.2 Western Europe Rugged Display Market Estimates and Forecasts, by Country (2020-2032) (USD Billion)

11.3.2.3 Western Europe Rugged Display Market Estimates and Forecasts, By Product (2020-2032) (USD Billion) 

11.3.2.4 Western Europe Rugged Display Market Estimates and Forecasts, By Display Size (2020-2032) (USD Billion)

11.3.2.5 Western Europe Rugged Display Market Estimates and Forecasts, By Level of Ruggedness (2020-2032) (USD Billion)

11.3.2.6 Western Europe Rugged Display Market Estimates and Forecasts, By Vertical (2020-2032) (USD Billion)

11.3.2.7 Germany

11.3.2.7.1 Germany Rugged Display Market Estimates and Forecasts, By Product (2020-2032) (USD Billion)

11.3.2.7.2 Germany Rugged Display Market Estimates and Forecasts, By Display Size (2020-2032) (USD Billion)

11.3.2.7.3 Germany Rugged Display Market Estimates and Forecasts, By Level of Ruggedness (2020-2032) (USD Billion)

11.3.2.7.4 Germany Rugged Display Market Estimates and Forecasts, By Vertical (2020-2032) (USD Billion)

11.3.2.8 France

11.3.2.8.1 France Rugged Display Market Estimates and Forecasts, By Product (2020-2032) (USD Billion)

11.3.2.8.2 France Rugged Display Market Estimates and Forecasts, By Display Size (2020-2032) (USD Billion)

11.3.2.8.3 France Rugged Display Market Estimates and Forecasts, By Level of Ruggedness (2020-2032) (USD Billion)

11.3.2.8.4 France Rugged Display Market Estimates and Forecasts, By Vertical (2020-2032) (USD Billion)

11.3.2.9 UK

11.3.2.9.1 UK Rugged Display Market Estimates and Forecasts, By Product (2020-2032) (USD Billion)

11.3.2.9.2 UK Rugged Display Market Estimates and Forecasts, By Display Size (2020-2032) (USD Billion)

11.3.2.9.3 UK Rugged Display Market Estimates and Forecasts, By Level of Ruggedness (2020-2032) (USD Billion)

11.3.2.9.4 UK Rugged Display Market Estimates and Forecasts, By Vertical (2020-2032) (USD Billion)

11.3.2.10 Italy

11.3.2.10.1 Italy Rugged Display Market Estimates and Forecasts, By Product (2020-2032) (USD Billion)

11.3.2.10.2 Italy Rugged Display Market Estimates and Forecasts, By Display Size (2020-2032) (USD Billion)

11.3.2.10.3 Italy Rugged Display Market Estimates and Forecasts, By Level of Ruggedness (2020-2032) (USD Billion)

11.3.2.10.4 Italy Rugged Display Market Estimates and Forecasts, By Vertical (2020-2032) (USD Billion)

11.3.2.11 Spain

11.3.2.11.1 Spain Rugged Display Market Estimates and Forecasts, By Product (2020-2032) (USD Billion)

11.3.2.11.2 Spain Rugged Display Market Estimates and Forecasts, By Display Size (2020-2032) (USD Billion)

11.3.2.11.3 Spain Rugged Display Market Estimates and Forecasts, By Level of Ruggedness (2020-2032) (USD Billion)

11.3.2.11.4 Spain Rugged Display Market Estimates and Forecasts, By Vertical (2020-2032) (USD Billion)

11.3.2.12 Netherlands

11.3.2.12.1 Netherlands Rugged Display Market Estimates and Forecasts, By Product (2020-2032) (USD Billion)

11.3.2.12.2 Netherlands Rugged Display Market Estimates and Forecasts, By Display Size (2020-2032) (USD Billion)

11.3.2.12.3 Netherlands Rugged Display Market Estimates and Forecasts, By Level of Ruggedness (2020-2032) (USD Billion)

11.3.2.12.4 Netherlands Rugged Display Market Estimates and Forecasts, By Vertical (2020-2032) (USD Billion)

11.3.2.13 Switzerland

11.3.2.13.1 Switzerland Rugged Display Market Estimates and Forecasts, By Product (2020-2032) (USD Billion)

11.3.2.13.2 Switzerland Rugged Display Market Estimates and Forecasts, By Display Size (2020-2032) (USD Billion)

11.3.2.13.3 Switzerland Rugged Display Market Estimates and Forecasts, By Level of Ruggedness (2020-2032) (USD Billion)

11.3.2.13.4 Switzerland Rugged Display Market Estimates and Forecasts, By Vertical (2020-2032) (USD Billion)

11.3.2.14 Austria

11.3.2.14.1 Austria Rugged Display Market Estimates and Forecasts, By Product (2020-2032) (USD Billion)

11.3.2.14.2 Austria Rugged Display Market Estimates and Forecasts, By Display Size (2020-2032) (USD Billion)

11.3.2.14.3 Austria Rugged Display Market Estimates and Forecasts, By Level of Ruggedness (2020-2032) (USD Billion)

11.3.2.14.4 Austria Rugged Display Market Estimates and Forecasts, By Vertical (2020-2032) (USD Billion)

11.3.2.15 Rest of Western Europe

11.3.2.15.1 Rest of Western Europe Rugged Display Market Estimates and Forecasts, By Product (2020-2032) (USD Billion)

11.3.2.15.2 Rest of Western Europe Rugged Display Market Estimates and Forecasts, By Display Size (2020-2032) (USD Billion)

11.3.2.15.3 Rest of Western Europe Rugged Display Market Estimates and Forecasts, By Level of Ruggedness (2020-2032) (USD Billion)

11.3.2.15.4 Rest of Western Europe Rugged Display Market Estimates and Forecasts, By Vertical (2020-2032) (USD Billion)

11.4 Asia-Pacific

11.4.1 Trends Analysis

11.4.2 Asia-Pacific Rugged Display Market Estimates and Forecasts, by Country (2020-2032) (USD Billion)

11.4.3 Asia-Pacific Rugged Display Market Estimates and Forecasts, By Product (2020-2032) (USD Billion) 

11.4.4 Asia-Pacific Rugged Display Market Estimates and Forecasts, By Display Size (2020-2032) (USD Billion)

11.4.5 Asia-Pacific Rugged Display Market Estimates and Forecasts, By Level of Ruggedness (2020-2032) (USD Billion)

11.4.6 Asia-Pacific Rugged Display Market Estimates and Forecasts, By Vertical (2020-2032) (USD Billion)

11.4.7 China

11.4.7.1 China Rugged Display Market Estimates and Forecasts, By Product (2020-2032) (USD Billion)

11.4.7.2 China Rugged Display Market Estimates and Forecasts, By Display Size (2020-2032) (USD Billion)

11.4.7.3 China Rugged Display Market Estimates and Forecasts, By Level of Ruggedness (2020-2032) (USD Billion)

11.4.7.4 China Rugged Display Market Estimates and Forecasts, By Vertical (2020-2032) (USD Billion)

11.4.8 India

11.4.8.1 India Rugged Display Market Estimates and Forecasts, By Product (2020-2032) (USD Billion)

11.4.8.2 India Rugged Display Market Estimates and Forecasts, By Display Size (2020-2032) (USD Billion)

11.4.8.3 India Rugged Display Market Estimates and Forecasts, By Level of Ruggedness (2020-2032) (USD Billion)

11.4.8.4 India Rugged Display Market Estimates and Forecasts, By Vertical (2020-2032) (USD Billion)

11.4.9 Japan

11.4.9.1 Japan Rugged Display Market Estimates and Forecasts, By Product (2020-2032) (USD Billion)

11.4.9.2 Japan Rugged Display Market Estimates and Forecasts, By Display Size (2020-2032) (USD Billion)

11.4.9.3 Japan Rugged Display Market Estimates and Forecasts, By Level of Ruggedness (2020-2032) (USD Billion)

11.4.9.4 Japan Rugged Display Market Estimates and Forecasts, By Vertical (2020-2032) (USD Billion)

11.4.10 South Korea

11.4.10.1 South Korea Rugged Display Market Estimates and Forecasts, By Product (2020-2032) (USD Billion)

11.4.10.2 South Korea Rugged Display Market Estimates and Forecasts, By Display Size (2020-2032) (USD Billion)

11.4.10.3 South Korea Rugged Display Market Estimates and Forecasts, By Level of Ruggedness (2020-2032) (USD Billion)

11.4.10.4 South Korea Rugged Display Market Estimates and Forecasts, By Vertical (2020-2032) (USD Billion)

11.4.11 Vietnam

11.4.11.1 Vietnam Rugged Display Market Estimates and Forecasts, By Product (2020-2032) (USD Billion)

11.4.11.2 Vietnam Rugged Display Market Estimates and Forecasts, By Display Size (2020-2032) (USD Billion)

11.4.11.3 Vietnam Rugged Display Market Estimates and Forecasts, By Level of Ruggedness (2020-2032) (USD Billion)

11.4.11.4 Vietnam Rugged Display Market Estimates and Forecasts, By Vertical (2020-2032) (USD Billion)

11.4.12 Singapore

11.4.12.1 Singapore Rugged Display Market Estimates and Forecasts, By Product (2020-2032) (USD Billion)

11.4.12.2 Singapore Rugged Display Market Estimates and Forecasts, By Display Size (2020-2032) (USD Billion)

11.4.12.3 Singapore Rugged Display Market Estimates and Forecasts, By Level of Ruggedness (2020-2032) (USD Billion)

11.4.12.4 Singapore Rugged Display Market Estimates and Forecasts, By Vertical (2020-2032) (USD Billion)

11.4.13 Australia

11.4.13.1 Australia Rugged Display Market Estimates and Forecasts, By Product (2020-2032) (USD Billion)

11.4.13.2 Australia Rugged Display Market Estimates and Forecasts, By Display Size (2020-2032) (USD Billion)

11.4.13.3 Australia Rugged Display Market Estimates and Forecasts, By Level of Ruggedness (2020-2032) (USD Billion)

11.4.13.4 Australia Rugged Display Market Estimates and Forecasts, By Vertical (2020-2032) (USD Billion)

11.4.14 Rest of Asia-Pacific

11.4.14.1 Rest of Asia-Pacific Rugged Display Market Estimates and Forecasts, By Product (2020-2032) (USD Billion)

11.4.14.2 Rest of Asia-Pacific Rugged Display Market Estimates and Forecasts, By Display Size (2020-2032) (USD Billion)

11.4.14.3 Rest of Asia-Pacific Rugged Display Market Estimates and Forecasts, By Level of Ruggedness (2020-2032) (USD Billion)

11.4.14.4 Rest of Asia-Pacific Rugged Display Market Estimates and Forecasts, By Vertical (2020-2032) (USD Billion)

11.5 Middle East and Africa

11.5.1 Middle East

11.5.1.1 Trends Analysis

11.5.1.2 Middle East Rugged Display Market Estimates and Forecasts, by Country (2020-2032) (USD Billion)

11.5.1.3 Middle East Rugged Display Market Estimates and Forecasts, By Product (2020-2032) (USD Billion) 

11.5.1.4 Middle East Rugged Display Market Estimates and Forecasts, By Display Size (2020-2032) (USD Billion)

11.5.1.5 Middle East Rugged Display Market Estimates and Forecasts, By Level of Ruggedness (2020-2032) (USD Billion)

11.5.1.6 Middle East Rugged Display Market Estimates and Forecasts, By Vertical (2020-2032) (USD Billion)

11.5.1.7 UAE

11.5.1.7.1 UAE Rugged Display Market Estimates and Forecasts, By Product (2020-2032) (USD Billion)

11.5.1.7.2 UAE Rugged Display Market Estimates and Forecasts, By Display Size (2020-2032) (USD Billion)

11.5.1.7.3 UAE Rugged Display Market Estimates and Forecasts, By Level of Ruggedness (2020-2032) (USD Billion)

11.5.1.7.4 UAE Rugged Display Market Estimates and Forecasts, By Vertical (2020-2032) (USD Billion)

11.5.1.8 Egypt

11.5.1.8.1 Egypt Rugged Display Market Estimates and Forecasts, By Product (2020-2032) (USD Billion)

11.5.1.8.2 Egypt Rugged Display Market Estimates and Forecasts, By Display Size (2020-2032) (USD Billion)

11.5.1.8.3 Egypt Rugged Display Market Estimates and Forecasts, By Level of Ruggedness (2020-2032) (USD Billion)

11.5.1.8.4 Egypt Rugged Display Market Estimates and Forecasts, By Vertical (2020-2032) (USD Billion)

11.5.1.9 Saudi Arabia

11.5.1.9.1 Saudi Arabia Rugged Display Market Estimates and Forecasts, By Product (2020-2032) (USD Billion)

11.5.1.9.2 Saudi Arabia Rugged Display Market Estimates and Forecasts, By Display Size (2020-2032) (USD Billion)

11.5.1.9.3 Saudi Arabia Rugged Display Market Estimates and Forecasts, By Level of Ruggedness (2020-2032) (USD Billion)

11.5.1.9.4 Saudi Arabia Rugged Display Market Estimates and Forecasts, By Vertical (2020-2032) (USD Billion)

11.5.1.10 Qatar

11.5.1.10.1 Qatar Rugged Display Market Estimates and Forecasts, By Product (2020-2032) (USD Billion)

11.5.1.10.2 Qatar Rugged Display Market Estimates and Forecasts, By Display Size (2020-2032) (USD Billion)

11.5.1.10.3 Qatar Rugged Display Market Estimates and Forecasts, By Level of Ruggedness (2020-2032) (USD Billion)

11.5.1.10.4 Qatar Rugged Display Market Estimates and Forecasts, By Vertical (2020-2032) (USD Billion)

11.5.1.11 Rest of Middle East

11.5.1.11.1 Rest of Middle East Rugged Display Market Estimates and Forecasts, By Product (2020-2032) (USD Billion)

11.5.1.11.2 Rest of Middle East Rugged Display Market Estimates and Forecasts, By Display Size (2020-2032) (USD Billion)

11.5.1.11.3 Rest of Middle East Rugged Display Market Estimates and Forecasts, By Level of Ruggedness (2020-2032) (USD Billion)

11.5.1.11.4 Rest of Middle East Rugged Display Market Estimates and Forecasts, By Vertical (2020-2032) (USD Billion)

11.5.2 Africa

11.5.2.1 Trends Analysis

11.5.2.2 Africa Rugged Display Market Estimates and Forecasts, by Country (2020-2032) (USD Billion)

11.5.2.3 Africa Rugged Display Market Estimates and Forecasts, By Product (2020-2032) (USD Billion) 

11.5.2.4 Africa Rugged Display Market Estimates and Forecasts, By Display Size (2020-2032) (USD Billion)

11.5.2.5 Africa Rugged Display Market Estimates and Forecasts, By Level of Ruggedness (2020-2032) (USD Billion)

11.5.2.6 Africa Rugged Display Market Estimates and Forecasts, By Vertical (2020-2032) (USD Billion)

11.5.2.7 South Africa

11.5.2.7.1 South Africa Rugged Display Market Estimates and Forecasts, By Product (2020-2032) (USD Billion)

11.5.2.7.2 South Africa Rugged Display Market Estimates and Forecasts, By Display Size (2020-2032) (USD Billion)

11.5.2.7.3 South Africa Rugged Display Market Estimates and Forecasts, By Level of Ruggedness (2020-2032) (USD Billion)

11.5.2.7.4 South Africa Rugged Display Market Estimates and Forecasts, By Vertical (2020-2032) (USD Billion)

11.5.2.8 Nigeria

11.5.2.8.1 Nigeria Rugged Display Market Estimates and Forecasts, By Product (2020-2032) (USD Billion)

11.5.2.8.2 Nigeria Rugged Display Market Estimates and Forecasts, By Display Size (2020-2032) (USD Billion)

11.5.2.8.3 Nigeria Rugged Display Market Estimates and Forecasts, By Level of Ruggedness (2020-2032) (USD Billion)

11.5.2.8.4 Nigeria Rugged Display Market Estimates and Forecasts, By Vertical (2020-2032) (USD Billion)

11.5.2.9 Rest of Africa

11.5.2.9.1 Rest of Africa Rugged Display Market Estimates and Forecasts, By Product (2020-2032) (USD Billion)

11.5.2.9.2 Rest of Africa Rugged Display Market Estimates and Forecasts, By Display Size (2020-2032) (USD Billion)

11.5.2.9.3 Rest of Africa Rugged Display Market Estimates and Forecasts, By Level of Ruggedness (2020-2032) (USD Billion)

11.5.2.9.4 Rest of Africa Rugged Display Market Estimates and Forecasts, By Vertical (2020-2032) (USD Billion)

11.6 Latin America

11.6.1 Trends Analysis

11.6.2 Latin America Rugged Display Market Estimates and Forecasts, by Country (2020-2032) (USD Billion)

11.6.3 Latin America Rugged Display Market Estimates and Forecasts, By Product (2020-2032) (USD Billion) 

11.6.4 Latin America Rugged Display Market Estimates and Forecasts, By Display Size (2020-2032) (USD Billion)

11.6.5 Latin America Rugged Display Market Estimates and Forecasts, By Level of Ruggedness (2020-2032) (USD Billion)

11.6.6 Latin America Rugged Display Market Estimates and Forecasts, By Vertical (2020-2032) (USD Billion)

11.6.7 Brazil

11.6.7.1 Brazil Rugged Display Market Estimates and Forecasts, By Product (2020-2032) (USD Billion)

11.6.7.2 Brazil Rugged Display Market Estimates and Forecasts, By Display Size (2020-2032) (USD Billion)

11.6.7.3 Brazil Rugged Display Market Estimates and Forecasts, By Level of Ruggedness (2020-2032) (USD Billion)

11.6.7.4 Brazil Rugged Display Market Estimates and Forecasts, By Vertical (2020-2032) (USD Billion)

11.6.8 Argentina

11.6.8.1 Argentina Rugged Display Market Estimates and Forecasts, By Product (2020-2032) (USD Billion)

11.6.8.2 Argentina Rugged Display Market Estimates and Forecasts, By Display Size (2020-2032) (USD Billion)

11.6.8.3 Argentina Rugged Display Market Estimates and Forecasts, By Level of Ruggedness (2020-2032) (USD Billion)

11.6.8.4 Argentina Rugged Display Market Estimates and Forecasts, By Vertical (2020-2032) (USD Billion)

11.6.9 Colombia

11.6.9.1 Colombia Rugged Display Market Estimates and Forecasts, By Product (2020-2032) (USD Billion)

11.6.9.2 Colombia Rugged Display Market Estimates and Forecasts, By Display Size (2020-2032) (USD Billion)

11.6.9.3 Colombia Rugged Display Market Estimates and Forecasts, By Level of Ruggedness (2020-2032) (USD Billion)

11.6.9.4 Colombia Rugged Display Market Estimates and Forecasts, By Vertical (2020-2032) (USD Billion)

11.6.10 Rest of Latin America

11.6.10.1 Rest of Latin America Rugged Display Market Estimates and Forecasts, By Product (2020-2032) (USD Billion)

11.6.10.2 Rest of Latin America Rugged Display Market Estimates and Forecasts, By Display Size (2020-2032) (USD Billion)

11.6.10.3 Rest of Latin America Rugged Display Market Estimates and Forecasts, By Level of Ruggedness (2020-2032) (USD Billion)

11.6.10.4 Rest of Latin America Rugged Display Market Estimates and Forecasts, By Vertical (2020-2032) (USD Billion)

12. Company Profiles

12.1 Dell Inc

12.1.1 Company Overview

12.1.2 Financial

12.1.3 Products/ Services Offered

12.1.4 SWOT Analysis

12.2 Getac Technology Corp.

12.2.1 Company Overview

12.2.2 Financial

12.2.3 Products/ Services Offered

12.2.4 SWOT Analysis

12.3 General Dynamics Corp

12.3.1 Company Overview

12.3.2 Financial

12.3.3 Products/ Services Offered

12.3.4 SWOT Analysis

12.4 Zebra Technologies Corp

12.4.1 Company Overview

12.4.2 Financial

12.4.3 Products/ Services Offered

12.4.4 SWOT Analysis

12.5 L3 Technologies Inc

12.5.1 Company Overview

12.5.2 Financial

12.5.3 Products/ Services Offered

12.5.4 SWOT Analysis

12.6 Panasonic Corporation

12.6.1 Company Overview

12.6.2 Financial

12.6.3 Products/ Services Offered

12.6.4 SWOT Analysis

12.7 Curtiss-Wright Corp

12.7.1 Company Overview

12.7.2 Financial

12.7.3 Products/ Services Offered

12.7.4 SWOT Analysis

12.8 Aayur Technology Solutions Pvt. Ltd

12.8.1 Company Overview

12.8.2 Financial

12.8.3 Products/ Services Offered

12.8.4 SWOT Analysis

12.9 Vista Consoles Electronics Pvt Ltd

12.9.1 Company Overview

12.9.2 Financial

12.9.3 Products/ Services Offered

12.9.4 SWOT Analysis

12.10 E3 Displays

12.10.1 Company Overview

12.10.2 Financial

12.10.3 Products/ Services Offered

12.10.4 SWOT Analysis

13. Use Cases and Best Practices

14. Conclusion

An accurate research report requires proper strategizing as well as implementation. There are multiple factors involved in the completion of good and accurate research report and selecting the best methodology to compete the research is the toughest part. Since the research reports we provide play a crucial role in any company’s decision-making process, therefore we at SNS Insider always believe that we should choose the best method which gives us results closer to reality. This allows us to reach at a stage wherein we can provide our clients best and accurate investment to output ratio.

Each report that we prepare takes a timeframe of 350-400 business hours for production. Starting from the selection of titles through a couple of in-depth brain storming session to the final QC process before uploading our titles on our website we dedicate around 350 working hours. The titles are selected based on their current market cap and the foreseen CAGR and growth.


The 5 steps process:

Step 1: Secondary Research:

Secondary Research or Desk Research is as the name suggests is a research process wherein, we collect data through the readily available information. In this process we use various paid and unpaid databases which our team has access to and gather data through the same. This includes examining of listed companies’ annual reports, Journals, SEC filling etc. Apart from this our team has access to various associations across the globe across different industries. Lastly, we have exchange relationships with various university as well as individual libraries.

Secondary Research

Step 2: Primary Research

When we talk about primary research, it is a type of study in which the researchers collect relevant data samples directly, rather than relying on previously collected data.  This type of research is focused on gaining content specific facts that can be sued to solve specific problems. Since the collected data is fresh and first hand therefore it makes the study more accurate and genuine.

We at SNS Insider have divided Primary Research into 2 parts.

Part 1 wherein we interview the KOLs of major players as well as the upcoming ones across various geographic regions. This allows us to have their view over the market scenario and acts as an important tool to come closer to the accurate market numbers. As many as 45 paid and unpaid primary interviews are taken from both the demand and supply side of the industry to make sure we land at an accurate judgement and analysis of the market.

This step involves the triangulation of data wherein our team analyses the interview transcripts, online survey responses and observation of on filed participants. The below mentioned chart should give a better understanding of the part 1 of the primary interview.

Primary Research

Part 2: In this part of primary research the data collected via secondary research and the part 1 of the primary research is validated with the interviews from individual consultants and subject matter experts.

Consultants are those set of people who have at least 12 years of experience and expertise within the industry whereas Subject Matter Experts are those with at least 15 years of experience behind their back within the same space. The data with the help of two main processes i.e., FGDs (Focused Group Discussions) and IDs (Individual Discussions). This gives us a 3rd party nonbiased primary view of the market scenario making it a more dependable one while collation of the data pointers.

Step 3: Data Bank Validation

Once all the information is collected via primary and secondary sources, we run that information for data validation. At our intelligence centre our research heads track a lot of information related to the market which includes the quarterly reports, the daily stock prices, and other relevant information. Our data bank server gets updated every fortnight and that is how the information which we collected using our primary and secondary information is revalidated in real time.

Data Bank Validation

Step 4: QA/QC Process

After all the data collection and validation our team does a final level of quality check and quality assurance to get rid of any unwanted or undesired mistakes. This might include but not limited to getting rid of the any typos, duplication of numbers or missing of any important information. The people involved in this process include technical content writers, research heads and graphics people. Once this process is completed the title gets uploader on our platform for our clients to read it.

Step 5: Final QC/QA Process:

This is the last process and comes when the client has ordered the study. In this process a final QA/QC is done before the study is emailed to the client. Since we believe in giving our clients a good experience of our research studies, therefore, to make sure that we do not lack at our end in any way humanly possible we do a final round of quality check and then dispatch the study to the client.

Key Segments:

By Product

  • Smartphone & Handheld Computer

  • Tablet PC

  • Panel PC & Mission-Critical Display

  • Laptop & Notebook

  • Avionics Display

  • Vehicle-Mounted Computer

By Display Size

  • Less than 10 Inches

  • 10 to 15 Inches

  • More than 15 Inches

By Level of Ruggedness

  • Ultra-Rugged

  • Fully Rugged

  • Semi-Rugged

By Vertical

  • Automotive & Transportation

  • Government, Defense, & Aerospace

  • Healthcare

  • Industrial

  • Others

Request for Segment Customization as per your Business Requirement: Segment Customization Request

Regional Coverage:

North America

  • US

  • Canada

  • Mexico

Europe

  • Eastern Europe

    • Poland

    • Romania

    • Hungary

    • Turkey

    • Rest of Eastern Europe

  • Western Europe

    • Germany

    • France

    • UK

    • Italy

    • Spain

    • Netherlands

    • Switzerland

    • Austria

    • Rest of Western Europe

Asia Pacific

  • China

  • India

  • Japan

  • South Korea

  • Vietnam

  • Singapore

  • Australia

  • Rest of Asia Pacific

Middle East & Africa

  • Middle East

    • UAE

    • Egypt

    • Saudi Arabia

    • Qatar

    • Rest of Middle East

  • Africa

    • Nigeria

    • South Africa

    • Rest of Africa

Latin America

  • Brazil

  • Argentina

  • Colombia

  • Rest of Latin America

Request for Country Level Research Report: Country Level Customization Request

Available Customization

With the given market data, SNS Insider offers customization as per the company’s specific needs. The following customization options are available for the report:

  • Detailed Volume Analysis

  • Criss-Cross segment analysis (e.g. Product X Application)

  • Competitive Product Benchmarking

  • Geographic Analysis

  • Additional countries in any of the regions

  • Customized Data Representation

  • Detailed analysis and profiling of additional market players


  •            5000 (33% Discount)


  •            8950 (40% Discount)


  •            3050 (23% Discount)

Start a Conversation

Hi! Click one of our member below to chat on Phone