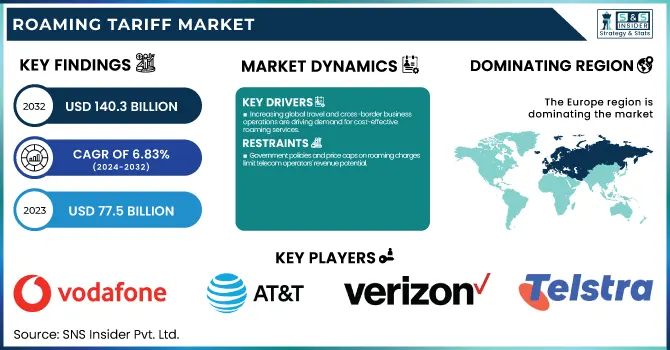
The Roaming Tariff Market was valued at USD 77.5 Billion in 2023 and is expected to reach USD 140.3 Billion by 2032, growing at a CAGR of 6.83% from 2024-2032.
To Get more information on Roaming Tariff Market - Request Free Sample Report
The Roaming Tariff Market is undergoing significant changes due to evolving consumer preferences and regulatory shifts. International roaming revenues vary across regions based on pricing strategies, telecom partnerships, and fluctuating travel patterns. Consumers are increasingly opting for bundled or unlimited roaming plans, driving higher adoption rates. The cost of roaming services, including voice, data, and SMS, is influenced by regional competition and regulatory interventions aimed at reducing excessive charges. Additionally, cross-border roaming traffic is rising, fueled by growing data consumption as global travel rebounds. Emerging trends include the adoption of eSIM technology, strategic alliances among telecom operators for seamless connectivity, and policy-driven reductions in roaming fees to enhance affordability.
Drivers
Increasing global travel and cross-border business operations are driving demand for cost-effective roaming services.
The rising volume of international travellers, business expansions, and globalization directly influence the roaming tariff market. As more people travel for work, leisure, and study, the need for affordable and seamless roaming services is skyrocketing. Further, enterprises engaged in cross-border operations need access to robust and continuously available connectivity, which is fuelling the demand for affordable roaming packages from the telecom operator. With digital nomads and remote work culture booming, roaming services are rising. Additionally, as the travel industry picked up after the pandemic, we are also roaming more and consuming data while roaming, and so are the telecom providers improving their competitive rate plans packages. Collectively, these factors are some of the key enablers that facilitate the growth of roaming tariff market, regionally.
Restraints
Government policies and price caps on roaming charges limit telecom operators' revenue potential.
Roaming tariffs are inapplicable through government regulation and international agreements, which remains to be the most serious problem for the telecom operator. Other areas including the European Union have adopted "Roam Like at Home" rules, which mean no additional costs for roaming within the same region. These legal regulations restrict operator revenue potential and force them to find alternative monetization methods. And regulatory authorities are imposing price caps on roaming tariffs and limiting profit margins, making it impossible for telecom providers to continue reaping high revenues. Traditional roaming business unit are being disrupted by the increasing drive from the government for fair tariffs, forcing operator to either reinvent themself by diversifying their offering through data-driven packages, partnerships, and bundle services.
Opportunity
The rise of eSIMs and telecom partnerships is enabling seamless, flexible, and cost-efficient roaming services.
With eSIM technology adoption surging globally, there is a large opportunity to unlock in the roaming tariff market. With the support of eSIMs, mobile networks become easy to activate while travelling without purchasing physical SIM cards, as well as any mobile number. Global roaming industry trend offers telecoms flexibility and competitiveness in their roaming plans. Also, MNOs and MVNOs partnerships are increasing global coverage and reducing price. Telecom companies can meet the growing demand for affordable, seamless connectivity through eSIM solutions and strategic partnerships to unlock innovation and revenues in the roaming market.
Challenges
Local SIM cards, Wi-Fi hotspots, and OTT communication apps are reducing dependency on traditional roaming services.
Alternative connectivity options, including local SIM cards, Wi-Fi hotspots, and over-the-top communication apps such as WhatsApp, Zoom, and Skype, are straining competition in the roaming tariff market. To avoid exorbitant roaming costs, numerous travelers are purchasing temporary local SIM cards or data-only plans. In addition, the presence of free Wi-Fi in public areas and commercial centers limits the use of traditional roaming services. Competition has ratcheted up even more due to the emergence of travel SIM providers and global connectivity solutions that support flat-rate data plans. To overcome this, telecom operators have to innovate with affordable and flexible roaming options that are designed to enhance customer satisfaction, cost-effectively, and ensure borderless connectivity.
By Roaming Type
In 2023, the National roaming segment dominated the market and accounted for 68% of revenue share, owing to high volume of domestic travelers, rural connectivity, and network sharing agreements amongst telecom operators. To broaden coverage in sparsely populated areas, in several countries, telecom suppliers give players accessibility to many networks while within national limitations. The rise of domestic tourism, business travel, and penetration of smart devices also needs seamless national roaming services, which is bridging the gap and further increasing the demand.
The international roaming segment is expected to boast the fastest CAGR throughout the forecast period. Due to the increase of global travelling and the rise of digital nomad culture along with the tendency to use eSIM technology, as businesses ease into a post-covid world, expanding their reach to different markets, and tourism again flourishing, the need for effortless connections across borders is rising. In response to these trends, telecom operators are rolling out inexpensive roaming packages, unlimited data plans, and forming collaborations to improve global coverage. With 5G networks and IoT-driven applications, data usage while roaming is only going to increase. Furthermore, the regulatory framework for the standardization of multinational roaming prices will further boost the market.
By Distribution Channel
In 2023, the retail roaming segment dominated the market and holds the largest share in the market owing to the increasing individual consumer requirement, coupled with business travelers and tourists who travel frequently for work and leisure purposes, by needing a smooth mobile connectivity. Adoption has been fuelled by the growing number of inexpensive roaming plans, bundled services, and unlimited data packages. In a phased manner, telecom operators have started using these strategic alliances to provide better coverage and in most cases, a cheaper rate for retail roaming as well.
The wholesale roaming is expected to register the fastest CAGR during the forecast period, which is driven by the upper level of inter-operator agreements and sharing network. Telecom operators are joining forces to improve coverage, cut down costs, and help others gain access to services, especially in under-served regions. Additional wholesale roaming demand is being driven by the growth in IoT devices, connected cars, and industrial IoT applications as well. Moreover, the deployment of 5G networks and the growth of Mobile Virtual Network Operators are boosting wholesale traffic.
By Service
The data segment dominated the market and accounted for significant revenue share in 2023, due to the rapid subscription of 5G, continued rise in cloud-based services, and usage of video conferencing platforms. As travelers rely more on data-heavy apps, such as social media, video calls, and online entertainment, telecom players are aiming at providing unlimited and affordable roaming data plans.
The voice segment is anticipated to register the fastest CAGR during the forecast period, due to the demand for reliable international calling services, especially for business travelers and expatriates. Voice calls, the original way of communicating over the phone, have been brought down by the VoIP services, and therefore telecom operators are implementing high-definition voice technology and competitive roaming tariffs to catch users. The wide reach of 5G networks is improving the quality of calls, and it is reducing latency, thus providing a better user experience. Telecom providers are also giving incentives for usage with bundled packages of voice and data.
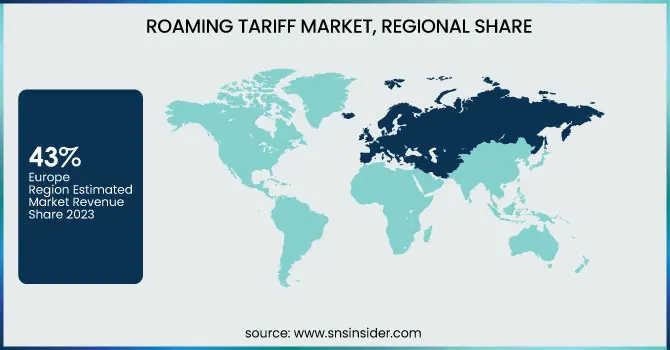
Europe dominated the market and accounted for 43% of revenue share in 2023, owing to stringent regulatory conditions, higher frequency of travels, and established telecom infrastructure in the region. The implementation of “ Roam Like at Home ” policy in the European Union has eliminated extra charges for intra-regional roaming, thereby encouraging more users to consider the service. Europe also has major telecom operators, extensive deployment of 5G and wider adoption of eSIM.
Asia-Pacific is expected to register the fastest CAGR during the forecast period. The rapidly increasing level of digitalization, a growing number of international travels, and increasing penetration of mobile phones are expected to act as major propellant for tariff roaming. Increasing business travels, tourism, and cross-border trade are other factors which are accelerating this demand. China, India, and ASEAN nations are witnessing a high level of international travel, which is resulting in a high adaptation of roaming services. Wider deployment of 5G, slumping price of smartphones and increasing adoption of eSIM coupled with various government initiatives to control the charges levied on roaming are expected to drive the market.
Get Customized Report as per Your Business Requirement - Enquiry Now
The major key players along with their products are
Vodafone Group – Vodafone Roaming Services
AT&T Inc. – International Day Pass
Verizon Communications – TravelPass
T-Mobile US, Inc. – Magenta Max Roaming
Orange S.A. – Orange Travel Pass
Telefónica S.A. – Movistar Roaming Plans
Deutsche Telekom AG – Global Roaming Plus
China Mobile Limited – GoTone Roaming Packages
China Telecom Corporation – 5G Global Roaming Plan
China Unicom – International Roaming Service
Reliance Jio – Jio International Roaming Packs
Bharti Airtel – Airtel World Pass
Singtel – ReadyRoam
Telstra – International Roaming Day Pass
NTT Docomo – World Wing Roaming
October 2024: Ofcom Regulation Implemented new rules requiring UK mobile providers to alert customers when they start roaming in the EU or other regions, aiming to protect holidaymakers from unexpected charges.
|
Report Attributes |
Details |
|
Market Size in 2023 |
USD 77.5 Billion |
|
Market Size by 2032 |
USD 140.3 Billion |
|
CAGR |
CAGR of 6.83% From 2024 to 2032 |
|
Base Year |
2023 |
|
Forecast Period |
2024-2032 |
|
Historical Data |
2020-2022 |
|
Report Scope & Coverage |
Market Size, Segments Analysis, Competitive Landscape, Regional Analysis, DROC & SWOT Analysis, Forecast Outlook |
|
Key Segments |
• By Roaming Type (National, International) |
|
Regional Analysis/Coverage |
North America (US, Canada, Mexico), Europe (Eastern Europe [Poland, Romania, Hungary, Turkey, Rest of Eastern Europe] Western Europe] Germany, France, UK, Italy, Spain, Netherlands, Switzerland, Austria, Rest of Western Europe]), Asia Pacific (China, India, Japan, South Korea, Vietnam, Singapore, Australia, Rest of Asia Pacific), Middle East & Africa (Middle East [UAE, Egypt, Saudi Arabia, Qatar, Rest of Middle East], Africa [Nigeria, South Africa, Rest of Africa], Latin America (Brazil, Argentina, Colombia, Rest of Latin America) |
|
Company Profiles |
Vodafone Group, AT&T Inc., Verizon Communications, T-Mobile US, Inc., Orange S.A., Telefónica S.A., Deutsche Telekom AG, China Mobile Limited, China Telecom Corporation, China Unicom, Reliance Jio, Bharti Airtel, Singtel, Telstra, NTT Docomo |
Ans - The Roaming Tariff Market was valued at USD 77.5 Billion in 2023 and is expected to reach USD 140.3 Billion by 2032
Ans- The CAGR of the Roaming Tariff Market during the forecast period is 6.83% from 2024-2032.
Ans- Asia-Pacific is expected to register the fastest CAGR during the forecast period.
Ans- Increasing global travel and cross-border business operations are driving demand for cost-effective roaming services.
Ans- Local SIM cards, Wi-Fi hotspots, and OTT communication apps are reducing dependency on traditional roaming services.
Table of Content
1. Introduction
1.1 Market Definition
1.2 Scope (Inclusion and Exclusions)
1.3 Research Assumptions
2. Executive Summary
2.1 Market Overview
2.2 Regional Synopsis
2.3 Competitive Summary
3. Research Methodology
3.1 Top-Down Approach
3.2 Bottom-up Approach
3.3. Data Validation
3.4 Primary Interviews
4. Market Dynamics Impact Analysis
4.1 Market Driving Factors Analysis
4.1.1 Drivers
4.1.2 Restraints
4.1.3 Opportunities
4.1.4 Challenges
4.2 PESTLE Analysis
4.3 Porter’s Five Forces Model
5. Statistical Insights and Trends Reporting
5.1 International Roaming Revenue Trends, by Region
5.2 Subscriber Adoption of Roaming Packages, by Region
5.3 Average Roaming Tariff Rates, by Service Type (Voice, Data, SMS)
5.4 Cross-Border Roaming Traffic Volume, by Region
6. Competitive Landscape
6.1 List of Major Companies, By Region
6.2 Market Share Analysis, By Region
6.3 Product Benchmarking
6.3.1 Product specifications and features
6.3.2 Pricing
6.4 Strategic Initiatives
6.4.1 Marketing and promotional activities
6.4.2 Distribution and supply chain strategies
6.4.3 Expansion plans and new product launches
6.4.4 Strategic partnerships and collaborations
6.5 Technological Advancements
6.6 Market Positioning and Branding
7. Roaming Tariff Market Segmentation, By Roaming Type
7.1 Chapter Overview
7.2 National
7.2.1 National Market Trends Analysis (2020-2032)
7.2.2 National Market Size Estimates and Forecasts to 2032 (USD Billion)
7.3 International
7.3.1 International Market Trends Analysis (2020-2032)
7.3.2 International Market Size Estimates and Forecasts to 2032 (USD Billion)
8. Roaming Tariff Market Segmentation, by Distribution Channel
8.1 Chapter Overview
8.2 Retail Roaming
8.2.1 Retail Roaming Market Trends Analysis (2020-2032)
8.2.2 Retail Roaming Market Size Estimates and Forecasts to 2032 (USD Billion)
8.3 Wholesale Roaming
8.3.1 Wholesale Roaming Market Trends Analysis (2020-2032)
8.3.2 Wholesale Roaming Market Size Estimates and Forecasts to 2032 (USD Billion)
9. Roaming Tariff Market Segmentation, by Application
9.1 Chapter Overview
9.2 Voice
9.2.1 Voice Market Trends Analysis (2020-2032)
9.2.2 Voice Market Size Estimates and Forecasts to 2032 (USD Billion)
9.3 SMS
9.3.1 SMS Market Trends Analysis (2020-2032)
9.3.2 SMS Market Size Estimates and Forecasts to 2032 (USD Billion)
9.4Data
9.4.1Data Market Trends Analysis (2020-2032)
9.4.2Data Market Size Estimates and Forecasts to 2032 (USD Billion)
10. Regional Analysis
10.1 Chapter Overview
10.2 North America
10.2.1 Trends Analysis
10.2.2 North America Roaming Tariff Market Estimates and Forecasts, by Country (2020-2032) (USD Billion)
10.2.3 North America Roaming Tariff Market Estimates and Forecasts, By Roaming Type (2020-2032) (USD Billion)
10.2.4 North America Roaming Tariff Market Estimates and Forecasts, by Distribution Channel (2020-2032) (USD Billion)
10.2.5 North America Roaming Tariff Market Estimates and Forecasts, by Service (2020-2032) (USD Billion)
10.2.6 USA
10.2.6.1 USA Roaming Tariff Market Estimates and Forecasts, By Roaming Type (2020-2032) (USD Billion)
10.2.6.2 USA Roaming Tariff Market Estimates and Forecasts, by Distribution Channel (2020-2032) (USD Billion)
10.2.6.3 USA Roaming Tariff Market Estimates and Forecasts, by Service (2020-2032) (USD Billion)
10.2.7 Canada
10.2.7.1 Canada Roaming Tariff Market Estimates and Forecasts, By Roaming Type (2020-2032) (USD Billion)
10.2.7.2 Canada Roaming Tariff Market Estimates and Forecasts, by Distribution Channel (2020-2032) (USD Billion)
10.2.7.3 Canada Roaming Tariff Market Estimates and Forecasts, by Service (2020-2032) (USD Billion)
10.2.8 Mexico
10.2.8.1 Mexico Roaming Tariff Market Estimates and Forecasts, By Roaming Type (2020-2032) (USD Billion)
10.2.8.2 Mexico Roaming Tariff Market Estimates and Forecasts, by Distribution Channel (2020-2032) (USD Billion)
10.2.8.3 Mexico Roaming Tariff Market Estimates and Forecasts, by Service (2020-2032) (USD Billion)
10.3 Europe
10.3.1 Eastern Europe
10.3.1.1 Trends Analysis
10.3.1.2 Eastern Europe Roaming Tariff Market Estimates and Forecasts, by Country (2020-2032) (USD Billion)
10.3.1.3 Eastern Europe Roaming Tariff Market Estimates and Forecasts, By Roaming Type (2020-2032) (USD Billion)
10.3.1.4 Eastern Europe Roaming Tariff Market Estimates and Forecasts, by Distribution Channel (2020-2032) (USD Billion)
10.3.1.5 Eastern Europe Roaming Tariff Market Estimates and Forecasts, by Service (2020-2032) (USD Billion)
10.3.1.6 Poland
10.3.1.6.1 Poland Roaming Tariff Market Estimates and Forecasts, By Roaming Type (2020-2032) (USD Billion)
10.3.1.6.2 Poland Roaming Tariff Market Estimates and Forecasts, by Distribution Channel (2020-2032) (USD Billion)
10.3.1.6.3 Poland Roaming Tariff Market Estimates and Forecasts, by Service (2020-2032) (USD Billion)
10.3.1.7 Romania
10.3.1.7.1 Romania Roaming Tariff Market Estimates and Forecasts, By Roaming Type (2020-2032) (USD Billion)
10.3.1.7.2 Romania Roaming Tariff Market Estimates and Forecasts, by Distribution Channel (2020-2032) (USD Billion)
10.3.1.7.3 Romania Roaming Tariff Market Estimates and Forecasts, by Service (2020-2032) (USD Billion)
10.3.1.8 Hungary
10.3.1.8.1 Hungary Roaming Tariff Market Estimates and Forecasts, By Roaming Type (2020-2032) (USD Billion)
10.3.1.8.2 Hungary Roaming Tariff Market Estimates and Forecasts, by Distribution Channel (2020-2032) (USD Billion)
10.3.1.8.3 Hungary Roaming Tariff Market Estimates and Forecasts, by Service (2020-2032) (USD Billion)
10.3.1.9 Turkey
10.3.1.9.1 Turkey Roaming Tariff Market Estimates and Forecasts, By Roaming Type (2020-2032) (USD Billion)
10.3.1.9.2 Turkey Roaming Tariff Market Estimates and Forecasts, by Distribution Channel (2020-2032) (USD Billion)
10.3.1.9.3 Turkey Roaming Tariff Market Estimates and Forecasts, by Service (2020-2032) (USD Billion)
10.3.1.10 Rest of Eastern Europe
10.3.1.10.1 Rest of Eastern Europe Roaming Tariff Market Estimates and Forecasts, By Roaming Type (2020-2032) (USD Billion)
10.3.1.10.2 Rest of Eastern Europe Roaming Tariff Market Estimates and Forecasts, by Distribution Channel (2020-2032) (USD Billion)
10.3.1.10.3 Rest of Eastern Europe Roaming Tariff Market Estimates and Forecasts, by Service (2020-2032) (USD Billion)
10.3.2 Western Europe
10.3.2.1 Trends Analysis
10.3.2.2 Western Europe Roaming Tariff Market Estimates and Forecasts, by Country (2020-2032) (USD Billion)
10.3.2.3 Western Europe Roaming Tariff Market Estimates and Forecasts, By Roaming Type (2020-2032) (USD Billion)
10.3.2.4 Western Europe Roaming Tariff Market Estimates and Forecasts, by Distribution Channel (2020-2032) (USD Billion)
10.3.2.5 Western Europe Roaming Tariff Market Estimates and Forecasts, by Service (2020-2032) (USD Billion)
10.3.2.6 Germany
10.3.2.6.1 Germany Roaming Tariff Market Estimates and Forecasts, By Roaming Type (2020-2032) (USD Billion)
10.3.2.6.2 Germany Roaming Tariff Market Estimates and Forecasts, by Distribution Channel (2020-2032) (USD Billion)
10.3.2.6.3 Germany Roaming Tariff Market Estimates and Forecasts, by Service (2020-2032) (USD Billion)
10.3.2.7 France
10.3.2.7.1 France Roaming Tariff Market Estimates and Forecasts, By Roaming Type (2020-2032) (USD Billion)
10.3.2.7.2 France Roaming Tariff Market Estimates and Forecasts, by Distribution Channel (2020-2032) (USD Billion)
10.3.2.7.3 France Roaming Tariff Market Estimates and Forecasts, by Service (2020-2032) (USD Billion)
10.3.2.8 UK
10.3.2.8.1 UK Roaming Tariff Market Estimates and Forecasts, By Roaming Type (2020-2032) (USD Billion)
10.3.2.8.2 UK Roaming Tariff Market Estimates and Forecasts, by Distribution Channel (2020-2032) (USD Billion)
10.3.2.8.3 UK Roaming Tariff Market Estimates and Forecasts, by Service (2020-2032) (USD Billion)
10.3.2.9 Italy
10.3.2.9.1 Italy Roaming Tariff Market Estimates and Forecasts, By Roaming Type (2020-2032) (USD Billion)
10.3.2.9.2 Italy Roaming Tariff Market Estimates and Forecasts, by Distribution Channel (2020-2032) (USD Billion)
10.3.2.9.3 Italy Roaming Tariff Market Estimates and Forecasts, by Service (2020-2032) (USD Billion)
10.3.2.10 Spain
10.3.2.10.1 Spain Roaming Tariff Market Estimates and Forecasts, By Roaming Type (2020-2032) (USD Billion)
10.3.2.10.2 Spain Roaming Tariff Market Estimates and Forecasts, by Distribution Channel (2020-2032) (USD Billion)
10.3.2.10.3 Spain Roaming Tariff Market Estimates and Forecasts, by Service (2020-2032) (USD Billion)
10.3.2.11 Netherlands
10.3.2.11.1 Netherlands Roaming Tariff Market Estimates and Forecasts, By Roaming Type (2020-2032) (USD Billion)
10.3.2.11.2 Netherlands Roaming Tariff Market Estimates and Forecasts, by Distribution Channel (2020-2032) (USD Billion)
10.3.2.11.3 Netherlands Roaming Tariff Market Estimates and Forecasts, by Service (2020-2032) (USD Billion)
10.3.2.12 Switzerland
10.3.2.12.1 Switzerland Roaming Tariff Market Estimates and Forecasts, By Roaming Type (2020-2032) (USD Billion)
10.3.2.12.2 Switzerland Roaming Tariff Market Estimates and Forecasts, by Distribution Channel (2020-2032) (USD Billion)
10.3.2.12.3 Switzerland Roaming Tariff Market Estimates and Forecasts, by Service (2020-2032) (USD Billion)
10.3.2.13 Austria
10.3.2.13.1 Austria Roaming Tariff Market Estimates and Forecasts, By Roaming Type (2020-2032) (USD Billion)
10.3.2.13.2 Austria Roaming Tariff Market Estimates and Forecasts, by Distribution Channel (2020-2032) (USD Billion)
10.3.2.13.3 Austria Roaming Tariff Market Estimates and Forecasts, by Service (2020-2032) (USD Billion)
10.3.2.14 Rest of Western Europe
10.3.2.14.1 Rest of Western Europe Roaming Tariff Market Estimates and Forecasts, By Roaming Type (2020-2032) (USD Billion)
10.3.2.14.2 Rest of Western Europe Roaming Tariff Market Estimates and Forecasts, by Distribution Channel (2020-2032) (USD Billion)
10.3.2.14.3 Rest of Western Europe Roaming Tariff Market Estimates and Forecasts, by Service (2020-2032) (USD Billion)
10.4 Asia Pacific
10.4.1 Trends Analysis
10.4.2 Asia Pacific Roaming Tariff Market Estimates and Forecasts, by Country (2020-2032) (USD Billion)
10.4.3 Asia Pacific Roaming Tariff Market Estimates and Forecasts, By Roaming Type (2020-2032) (USD Billion)
10.4.4 Asia Pacific Roaming Tariff Market Estimates and Forecasts, by Distribution Channel (2020-2032) (USD Billion)
10.4.5 Asia Pacific Roaming Tariff Market Estimates and Forecasts, by Service (2020-2032) (USD Billion)
10.4.6 China
10.4.6.1 China Roaming Tariff Market Estimates and Forecasts, By Roaming Type (2020-2032) (USD Billion)
10.4.6.2 China Roaming Tariff Market Estimates and Forecasts, by Display (2020-2032) (USD Billion)
10.4.6.3 China Roaming Tariff Market Estimates and Forecasts, by Service (2020-2032) (USD Billion)
10.4.7 India
10.4.7.1 India Roaming Tariff Market Estimates and Forecasts, By Roaming Type (2020-2032) (USD Billion)
10.4.7.2 India Roaming Tariff Market Estimates and Forecasts, by Distribution Channel (2020-2032) (USD Billion)
10.4.7.3 India Roaming Tariff Market Estimates and Forecasts, by Service (2020-2032) (USD Billion)
10.4.8 Japan
10.4.8.1 Japan Roaming Tariff Market Estimates and Forecasts, By Roaming Type (2020-2032) (USD Billion)
10.4.8.2 Japan Roaming Tariff Market Estimates and Forecasts, by Distribution Channel (2020-2032) (USD Billion)
10.4.8.3 Japan Roaming Tariff Market Estimates and Forecasts, by Service (2020-2032) (USD Billion)
10.4.9 South Korea
10.4.9.1 South Korea Roaming Tariff Market Estimates and Forecasts, By Roaming Type (2020-2032) (USD Billion)
10.4.9.2 South Korea Roaming Tariff Market Estimates and Forecasts, by Distribution Channel (2020-2032) (USD Billion)
10.4.9.3 South Korea Roaming Tariff Market Estimates and Forecasts, by Service (2020-2032) (USD Billion)
10.4.10 Vietnam
10.4.10.1 Vietnam Roaming Tariff Market Estimates and Forecasts, By Roaming Type (2020-2032) (USD Billion)
10.4.10.2 Vietnam Roaming Tariff Market Estimates and Forecasts, by Distribution Channel (2020-2032) (USD Billion)
10.4.10.3 Vietnam Roaming Tariff Market Estimates and Forecasts, by Service (2020-2032) (USD Billion)
10.4.11 Singapore
10.4.11.1 Singapore Roaming Tariff Market Estimates and Forecasts, By Roaming Type (2020-2032) (USD Billion)
10.4.11.2 Singapore Roaming Tariff Market Estimates and Forecasts, by Distribution Channel (2020-2032) (USD Billion)
10.4.11.3 Singapore Roaming Tariff Market Estimates and Forecasts, by Service (2020-2032) (USD Billion)
10.4.12 Australia
10.4.12.1 Australia Roaming Tariff Market Estimates and Forecasts, By Roaming Type (2020-2032) (USD Billion)
10.4.12.2 Australia Roaming Tariff Market Estimates and Forecasts, by Distribution Channel (2020-2032) (USD Billion)
10.4.12.3 Australia Roaming Tariff Market Estimates and Forecasts, by Service (2020-2032) (USD Billion)
10.4.13 Rest of Asia Pacific
10.4.13.1 Rest of Asia Pacific Roaming Tariff Market Estimates and Forecasts, By Roaming Type (2020-2032) (USD Billion)
10.4.13.2 Rest of Asia Pacific Roaming Tariff Market Estimates and Forecasts, by Distribution Channel (2020-2032) (USD Billion)
10.4.13.3 Rest of Asia Pacific Roaming Tariff Market Estimates and Forecasts, by Service (2020-2032) (USD Billion)
10.5 Middle East and Africa
10.5.1 Middle East
10.5.1.1 Trends Analysis
10.5.1.2 Middle East Roaming Tariff Market Estimates and Forecasts, by Country (2020-2032) (USD Billion)
10.5.1.3 Middle East Roaming Tariff Market Estimates and Forecasts, By Roaming Type (2020-2032) (USD Billion)
10.5.1.4 Middle East Roaming Tariff Market Estimates and Forecasts, by Distribution Channel (2020-2032) (USD Billion)
10.5.1.5 Middle East Roaming Tariff Market Estimates and Forecasts, by Service (2020-2032) (USD Billion)
10.5.1.6 UAE
10.5.1.6.1 UAE Roaming Tariff Market Estimates and Forecasts, By Roaming Type (2020-2032) (USD Billion)
10.5.1.6.2 UAE Roaming Tariff Market Estimates and Forecasts, by Distribution Channel (2020-2032) (USD Billion)
10.5.1.6.3 UAE Roaming Tariff Market Estimates and Forecasts, by Service (2020-2032) (USD Billion)
10.5.1.7 Egypt
10.5.1.7.1 Egypt Roaming Tariff Market Estimates and Forecasts, By Roaming Type (2020-2032) (USD Billion)
10.5.1.7.2 Egypt Roaming Tariff Market Estimates and Forecasts, by Distribution Channel (2020-2032) (USD Billion)
10.5.1.7.3 Egypt Roaming Tariff Market Estimates and Forecasts, by Service (2020-2032) (USD Billion)
10.5.1.8 Saudi Arabia
10.5.1.8.1 Saudi Arabia Roaming Tariff Market Estimates and Forecasts, By Roaming Type (2020-2032) (USD Billion)
10.5.1.8.2 Saudi Arabia Roaming Tariff Market Estimates and Forecasts, by Distribution Channel (2020-2032) (USD Billion)
10.5.1.8.3 Saudi Arabia Roaming Tariff Market Estimates and Forecasts, by Service (2020-2032) (USD Billion)
10.5.1.9 Qatar
10.5.1.9.1 Qatar Roaming Tariff Market Estimates and Forecasts, By Roaming Type (2020-2032) (USD Billion)
10.5.1.9.2 Qatar Roaming Tariff Market Estimates and Forecasts, by Distribution Channel (2020-2032) (USD Billion)
10.5.1.9.3 Qatar Roaming Tariff Market Estimates and Forecasts, by Service (2020-2032) (USD Billion)
10.5.1.10 Rest of Middle East
10.5.1.10.1 Rest of Middle East Roaming Tariff Market Estimates and Forecasts, By Roaming Type (2020-2032) (USD Billion)
10.5.1.10.2 Rest of Middle East Roaming Tariff Market Estimates and Forecasts, by Distribution Channel (2020-2032) (USD Billion)
10.5.1.10.3 Rest of Middle East Roaming Tariff Market Estimates and Forecasts, by Service (2020-2032) (USD Billion)
10.5.2 Africa
10.5.2.1 Trends Analysis
10.5.2.2 Africa Roaming Tariff Market Estimates and Forecasts, by Country (2020-2032) (USD Billion)
10.5.2.3 Africa Roaming Tariff Market Estimates and Forecasts, By Roaming Type (2020-2032) (USD Billion)
10.5.2.4 Africa Roaming Tariff Market Estimates and Forecasts, by Distribution Channel (2020-2032) (USD Billion)
10.5.2.5 Africa Roaming Tariff Market Estimates and Forecasts, by Service (2020-2032) (USD Billion)
10.5.2.6 South Africa
10.5.2.6.1 South Africa Roaming Tariff Market Estimates and Forecasts, By Roaming Type (2020-2032) (USD Billion)
10.5.2.6.2 South Africa Roaming Tariff Market Estimates and Forecasts, by Distribution Channel (2020-2032) (USD Billion)
10.5.2.6.3 South Africa Roaming Tariff Market Estimates and Forecasts, by Service (2020-2032) (USD Billion)
10.5.2.7 Nigeria
10.5.2.7.1 Nigeria Roaming Tariff Market Estimates and Forecasts, By Roaming Type (2020-2032) (USD Billion)
10.5.2.7.2 Nigeria Roaming Tariff Market Estimates and Forecasts, by Distribution Channel (2020-2032) (USD Billion)
10.5.2.7.3 Nigeria Roaming Tariff Market Estimates and Forecasts, by Service (2020-2032) (USD Billion)
10.5.2.8 Rest of Africa
10.5.2.8.1 Rest of Africa Roaming Tariff Market Estimates and Forecasts, By Roaming Type (2020-2032) (USD Billion)
10.5.2.8.2 Rest of Africa Roaming Tariff Market Estimates and Forecasts, by Distribution Channel (2020-2032) (USD Billion)
10.5.2.8.3 Rest of Africa Roaming Tariff Market Estimates and Forecasts, by Service (2020-2032) (USD Billion)
10.6 Latin America
10.6.1 Trends Analysis
10.6.2 Latin America Roaming Tariff Market Estimates and Forecasts, by Country (2020-2032) (USD Billion)
10.6.3 Latin America Roaming Tariff Market Estimates and Forecasts, By Roaming Type (2020-2032) (USD Billion)
10.6.4 Latin America Roaming Tariff Market Estimates and Forecasts, by Distribution Channel (2020-2032) (USD Billion)
10.6.5 Latin America Roaming Tariff Market Estimates and Forecasts, by Service (2020-2032) (USD Billion)
10.6.6 Brazil
10.6.6.1 Brazil Roaming Tariff Market Estimates and Forecasts, By Roaming Type (2020-2032) (USD Billion)
10.6.6.2 Brazil Roaming Tariff Market Estimates and Forecasts, by Distribution Channel (2020-2032) (USD Billion)
10.6.6.3 Brazil Roaming Tariff Market Estimates and Forecasts, by Service (2020-2032) (USD Billion)
10.6.7 Argentina
10.6.7.1 Argentina Roaming Tariff Market Estimates and Forecasts, By Roaming Type (2020-2032) (USD Billion)
10.6.7.2 Argentina Roaming Tariff Market Estimates and Forecasts, by Distribution Channel (2020-2032) (USD Billion)
10.6.7.3 Argentina Roaming Tariff Market Estimates and Forecasts, by Service (2020-2032) (USD Billion)
10.6.8 Colombia
10.6.8.1 Colombia Roaming Tariff Market Estimates and Forecasts, By Roaming Type (2020-2032) (USD Billion)
10.6.8.2 Colombia Roaming Tariff Market Estimates and Forecasts, by Distribution Channel (2020-2032) (USD Billion)
10.6.8.3 Colombia Roaming Tariff Market Estimates and Forecasts, by Service (2020-2032) (USD Billion)
10.6.9 Rest of Latin America
10.6.9.1 Rest of Latin America Roaming Tariff Market Estimates and Forecasts, By Roaming Type (2020-2032) (USD Billion)
10.6.9.2 Rest of Latin America Roaming Tariff Market Estimates and Forecasts, by Enterprise Size (2020-2032) (USD Billion)
10.6.9.3 Rest of Latin America Roaming Tariff Market Estimates and Forecasts, by Service (2020-2032) (USD Billion)
11. Company Profiles
11.1 Vodafone Group
11.1.1 Company Overview
11.1.2 Financial
11.1.3 Products/ Services Offered
11.1.4 SWOT Analysis
11.2 AT&T Inc.
11.2.1 Company Overview
11.2.2 Financial
11.2.3 Products/ Services Offered
11.2.4 SWOT Analysis
11.3 Verizon Communications
11.3.1 Company Overview
11.3.2 Financial
11.3.3 Products/ Services Offered
11.3.4 SWOT Analysis
11.4 T-Mobile US, Inc.
11.4.1 Company Overview
11.4.2 Financial
11.4.3 Products/ Services Offered
11.4.4 SWOT Analysis
11.5 Bureau Veritas
11.5.1 Company Overview
11.5.2 Financial
11.5.3 Products/ Services Offered
11.5.4 SWOT Analysis
11.6 Orange S.A.
11.6.1 Company Overview
11.6.2 Financial
11.6.3 Products/ Services Offered
11.6.4 SWOT Analysis
11.7 Telefónica S.A.
11.7.1 Company Overview
11.7.2 Financial
11.7.3 Products/ Services Offered
11.7.4 SWOT Analysis
11.8 Deutsche Telekom AG
11.8.1 Company Overview
11.8.2 Financial
11.8.3 Products/ Services Offered
11.8.4 SWOT Analysis
11.9 China Mobile Limited
11.9.1 Company Overview
11.9.2 Financial
11.9.3 Products/ Services Offered
11.9.4 SWOT Analysis
11.10 China Telecom Corporation
11.10.1 Company Overview
11.10.2 Financial
11.10.3 Products/ Services Offered
11.10.4 SWOT Analysis
12. Use Cases and Best Practices
13. Conclusion
An accurate research report requires proper strategizing as well as implementation. There are multiple factors involved in the completion of good and accurate research report and selecting the best methodology to compete the research is the toughest part. Since the research reports we provide play a crucial role in any company’s decision-making process, therefore we at SNS Insider always believe that we should choose the best method which gives us results closer to reality. This allows us to reach at a stage wherein we can provide our clients best and accurate investment to output ratio.
Each report that we prepare takes a timeframe of 350-400 business hours for production. Starting from the selection of titles through a couple of in-depth brain storming session to the final QC process before uploading our titles on our website we dedicate around 350 working hours. The titles are selected based on their current market cap and the foreseen CAGR and growth.
The 5 steps process:
Step 1: Secondary Research:
Secondary Research or Desk Research is as the name suggests is a research process wherein, we collect data through the readily available information. In this process we use various paid and unpaid databases which our team has access to and gather data through the same. This includes examining of listed companies’ annual reports, Journals, SEC filling etc. Apart from this our team has access to various associations across the globe across different industries. Lastly, we have exchange relationships with various university as well as individual libraries.

Step 2: Primary Research
When we talk about primary research, it is a type of study in which the researchers collect relevant data samples directly, rather than relying on previously collected data. This type of research is focused on gaining content specific facts that can be sued to solve specific problems. Since the collected data is fresh and first hand therefore it makes the study more accurate and genuine.
We at SNS Insider have divided Primary Research into 2 parts.
Part 1 wherein we interview the KOLs of major players as well as the upcoming ones across various geographic regions. This allows us to have their view over the market scenario and acts as an important tool to come closer to the accurate market numbers. As many as 45 paid and unpaid primary interviews are taken from both the demand and supply side of the industry to make sure we land at an accurate judgement and analysis of the market.
This step involves the triangulation of data wherein our team analyses the interview transcripts, online survey responses and observation of on filed participants. The below mentioned chart should give a better understanding of the part 1 of the primary interview.

Part 2: In this part of primary research the data collected via secondary research and the part 1 of the primary research is validated with the interviews from individual consultants and subject matter experts.
Consultants are those set of people who have at least 12 years of experience and expertise within the industry whereas Subject Matter Experts are those with at least 15 years of experience behind their back within the same space. The data with the help of two main processes i.e., FGDs (Focused Group Discussions) and IDs (Individual Discussions). This gives us a 3rd party nonbiased primary view of the market scenario making it a more dependable one while collation of the data pointers.
Step 3: Data Bank Validation
Once all the information is collected via primary and secondary sources, we run that information for data validation. At our intelligence centre our research heads track a lot of information related to the market which includes the quarterly reports, the daily stock prices, and other relevant information. Our data bank server gets updated every fortnight and that is how the information which we collected using our primary and secondary information is revalidated in real time.

Step 4: QA/QC Process
After all the data collection and validation our team does a final level of quality check and quality assurance to get rid of any unwanted or undesired mistakes. This might include but not limited to getting rid of the any typos, duplication of numbers or missing of any important information. The people involved in this process include technical content writers, research heads and graphics people. Once this process is completed the title gets uploader on our platform for our clients to read it.
Step 5: Final QC/QA Process:
This is the last process and comes when the client has ordered the study. In this process a final QA/QC is done before the study is emailed to the client. Since we believe in giving our clients a good experience of our research studies, therefore, to make sure that we do not lack at our end in any way humanly possible we do a final round of quality check and then dispatch the study to the client.
Key Segmentation:
By Roaming Type
National
International
By Distribution Channel
Retail Roaming
Wholesale Roaming
By Service
Voice
SMS
Data
Request for Segment Customization as per your Business Requirement: Segment Customization Request
Regional Coverage:
North America
US
Canada
Mexico
Europe
Eastern Europe
Poland
Romania
Hungary
Turkey
Rest of Eastern Europe
Western Europe
Germany
France
UK
Italy
Spain
Netherlands
Switzerland
Austria
Rest of Western Europe
Asia Pacific
China
India
Japan
South Korea
Vietnam
Singapore
Australia
Rest of Asia Pacific
Middle East & Africa
Middle East
UAE
Egypt
Saudi Arabia
Qatar
Rest of Middle East
Africa
Nigeria
South Africa
Rest of Africa
Latin America
Brazil
Argentina
Colombia
Rest of Latin America
Request for Country Level Research Report: Country Level Customization Request
Available Customization
With the given market data, SNS Insider offers customization as per the company’s specific needs. The following customization options are available for the report:
Detailed Volume Analysis
Criss-Cross segment analysis (e.g. Product X Application)
Competitive Product Benchmarking
Geographic Analysis
Additional countries in any of the regions
Customized Data Representation
Detailed analysis and profiling of additional market players
The Generative AI Market Size was valued at USD 20.21 Billion in 2023 and is expected to reach USD 440 Billion by 2032 and grow at a CAGR of 41.31% over the forecast period 2024-2032.
The Machine Learning as a Service (MLaaS) Market Size was valued at USD 25.3 Billion in 2023 and is expected to reach USD 313.9 Billion by 2032 and grow at a CAGR of 32.3% Over the Forecast Period of 2024-2032.
Social Media Analytics Market size was valued at USD 8.08 billion in 2023. It is expected to hit USD 61.52 Billion by 2032 and grow at a CAGR of 25.3% over the forecast period of 2024-2032.
The Sales Training Software Market Size was valued at USD 2.37 Billion in 2023 and will reach USD 7.82 Billion by 2032 and grow at a CAGR of 14.27% by 2032.
The Contact Center Software Market was valued at USD 42.09 billion in 2023 and will reach USD 227.03 billion by 2032, growing at a CAGR of 20.64% by 2032.
The Containerized Data Center Market size was valued at USD 11.4 billion in 2023 and is expected to reach USD 66.9 Billion by 2032, with a growing at CAGR of 21.73% Over the Forecast Period of 2024-2032.

Hi! Click one of our member below to chat on Phone
© 2025 All Rights Reserved by SNS Insider Pvt Ltd


