Risk Analytics Market Report Scope and Overview:
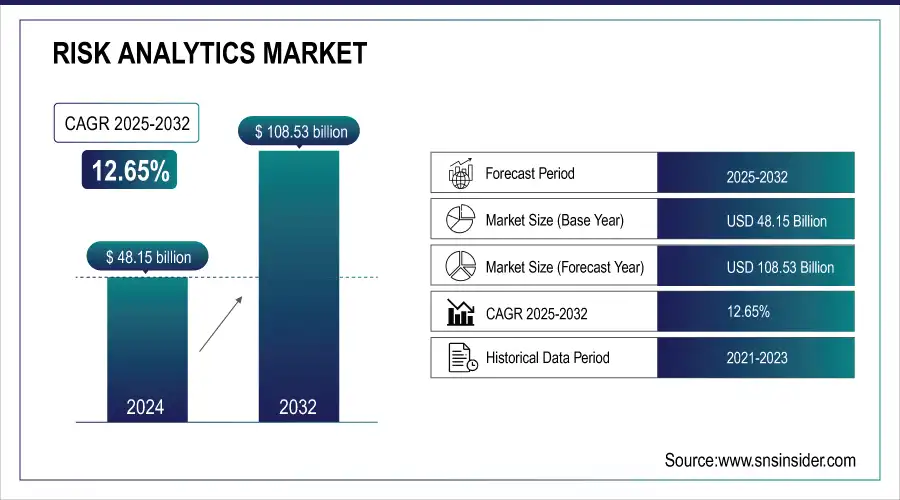
The Risk Analytics Market was valued at USD 48.15 billion in 2024 and is expected to reach USD 108.53 billion by 2032, growing at a CAGR of 12.65% from 2025-2032.
This report covers trends around new technologies adoption rates, customer behavior shift, and satisfaction levels driving industry dynamics. Regulatory and compliance constructs are central to defining the industry's behavior, whereas software integration capabilities impact operational effectiveness. Investment trends indicate an increased emphasis on advanced analytics solutions to better manage risks.In the wake of business-driven decisions, there are increasing expectations for strong risk analytics tools.
Risk Analytics Market Size and Forecast:
-
Market Size in 2024: USD 48.15 Billion
-
Market Size by 2032: USD 108.53 Billion
-
CAGR: 12.65% from 2025 to 2032
-
Base Year: 2024
-
Forecast Period: 2025–2032
-
Historical Data: 2021–2023
To Get More Information on Risk Analytics Market - Request Sample Report
Risk Analytics Market Highlights:
-
Rising cybersecurity threats are driving demand for advanced risk analytics solutions to predict, prevent, and mitigate potential breaches, protecting sensitive business information.
-
According to IBM's 2024 report, the global average cost of a data breach reached USD 4.88 million, increasing by 10% year-over-year, highlighting the need for robust risk management.
-
Risk analytics solutions enable real-time data analysis for early detection of vulnerabilities, reducing financial and reputational damage from cyber incidents.
-
High implementation and maintenance costs, including software, infrastructure, training, and updates, limit adoption among small and medium-sized businesses.
-
AI and machine learning integration enhances predictive capabilities, allowing organizations to detect threats earlier and make strategic, data-driven decisions.
-
Leading providers like SAP and IBM are incorporating AI-powered risk analytics into core business operations, fueling growth and innovation in the market.
Risk Analytics Market Drivers:
-
Rising Cybersecurity Threats Drive Demand for Advanced Risk Analytics to Predict, Prevent, and Mitigate Potential Breaches
According to IBM's 2024 Cost of a Data Breach Report, the worldwide average cost of a data breach was at a high of USD 4.88 million. The rate increased by 10% compared with the last year. Business concerns have now amplified as more advanced and repeated cyberattacks put at stake the secrecy of their most sensitive information while ensuring that its operations run efficiently. Traditional approaches to security seem to become inefficient in addressing ever-changing cyber attacks, thereby increasingly requiring risk analytics solutions that have been upgraded over time.
These solutions help organizations predict, prevent, and mitigate potential breaches by analyzing vast amounts of data in real-time. Early detection of vulnerabilities and actionable insights can significantly reduce the financial and reputational damage caused by cyber incidents. The need for robust, data-driven risk management strategies drives the adoption of risk analytics solutions as cybersecurity becomes a top priority.
Risk Analytics Market Restraints:
-
High Implementation and Maintenance Costs Limit Adoption of Advanced Risk Analytics Solutions, Especially for Small and Medium Businesses
The advanced risk analytics tools' implementation requires an enormous upfront investment, which will not only have the cost of the software but also the expenses of infrastructure, training, and integration. Oracle Risk Management Cloud's Enterprise Edition starts at USD 0.45 per OCPU hour and the Professional Edition at USD 0.15 per OCPU hour. The IBM Enterprise Edition is priced at USD 9,000 and the Essentials Edition at USD 3,300.
Furthermore, maintenance and upgrades cost money, and constant updates put an added burden on the wallet of such systems. For small and medium-sized businesses, such costs can be prohibitive, especially when the return may be seen quite a while hence. Consequently, many firms stick to cheaper options, which bar the widespread adoption of highly advanced analytics solutions regarding risks.
Risk Analytics Market Opportunities:
-
AI and Machine Learning Integration Enhances Predictive Capabilities, Driving Advanced Risk Management and Strategic Decision-Making
The integration of AI and machine learning technologies in risk analytics is changing the way business risks are managed and predicted. According to an IBM report released in June 2024, 72% of organizations have adopted some form of artificial intelligence, up from 17% in 2023. It makes it possible to process high volumes of data fast and accurately, thereby enhancing predictive capabilities.
In 2024, SAP also enabled AI-powered functionality in all of its spaces-including SAP S/4HANA Cloud Public Edition and SAP SuccessFactors-and is bringing AI even further into core business operations. Organisations using algorithm-based AI can detect the threat earlier and more specifically, so react instead of being reactive. The latest development has transformed the risk management direction, making it more informed and data-driven and hence strategic, thus bringing massive growth to the risk analytics market.
Risk Analytics Market Segment Analysis:
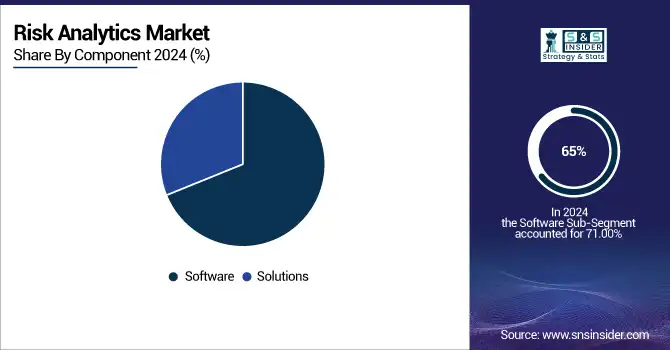
By Component
The Software segment dominated the risk analytics market in 2024, with a revenue share of about 65%, as the increasing adoption of advanced analytics platforms for real-time risk assessment, predictive modeling, and regulatory compliance drives the demand for such tools among businesses to enhance decision-making and security. The Solutions segment is likely to grow at the fastest CAGR of 13.77% from 2024 to 2032, driven by increasing demand for customized risk management frameworks that combine software with consulting and implementation services.
By Deployment Type
In 2024, the On-premise segment domianted the risk analytics market with a revenue share of around 58%. Here, the in-house data security, regulatory compliance, and easy integration with the existing systems became the primary preferences of the enterprises. Large financial and healthcare organizations preferred on-premise deployment due to the requirement for control and privacy. The Cloud segment is projected to have the fastest growth CAGR of 14.19% during 2024 to 2032, based on increasing demand for scalable, cost-effective, and real-time risk analytics solutions.
By Industry Vertical
The BFSI segment dominated the risk analytics market in 2024 with a 28% of the revenue share, primarily driven by strict regulatory compliance needs, rising cyber threats, and the adoption of fraud detection tools on a wide scale. Financial institutions used risk analytics to improve security and decision-making processes. While the Manufacturing segment is likely to grow at the fastest CAGR of 15.22% during 2024-2032, due to the Industry 4.0 advancements, growing complexities in supply chains and demand for predictive maintenance solutions.
By Risk Type Application
Operational Risk accounted for approximately 36% of the market revenue in 2024. It is due to the business disruptions, cyber threats, and process inefficiencies, where operational risk analytics have helped organizations become more resilient and stable in their finances. The Compliance Risk segment is also expected to grow at the fastest CAGR of 14.76% during 2024-2032, driven by more stringent regulations, increased penalties, and the expanding necessity for enterprises to ensure compliance and avoid legal risks.
Risk Analytics Market Regional Analysis:
North America Risk Analytics Market Trends:
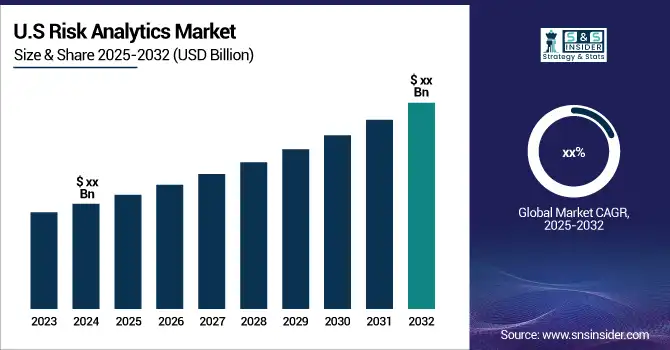
North America region dominated the market in 2024, accounting for around 37% of the revenue share. This was mainly because major technology firms were headquartered here, early adoption of advanced analytics solutions, and stringent regulatory frameworks for the BFSI and healthcare industries, thereby majorly showing leadership in cybersecurity infrastructure and being heavily invested in AI-driven risk management.

Do You Need any Customization Research on Risk Analytics Market - Enquire Now
Asia-Pacific Risk Analytics Market Trends:
The Asia Pacific region is expected to grow at the fastest CAGR of 15.13% from 2025 to 2032, driven by rapid digital transformation, increasing need for regulatory compliance, and elevated cyber threats across industries. The growing investments in cloud-based analytics, expansion in financial services, and growth of Industry 4.0 are accelerating the adoption of more advanced risk management solutions.
Europe Risk Analytics Market Trends:
Europe maintains significant market share, supported by strict regulations such as GDPR, high digitalization in banking and healthcare, and growing cybersecurity awareness. Adoption of AI-driven risk analytics and enterprise-level security solutions is fueling market growth.
Latin America Risk Analytics Market Trends:
Latin America is experiencing steady growth due to modernization of banking and insurance sectors, increasing adoption of cloud-based analytics, cybersecurity investments, and government initiatives promoting digital transformation and compliance.
Middle East & Africa (MEA) Risk Analytics Market Trends:
MEA is gradually expanding its market, driven by rising digitalization, awareness of cyber threats, government initiatives to secure financial and healthcare infrastructures, and increasing adoption of AI-enabled risk management solutions.
Risk Analytics Market Key Players:
-
IBM (IBM Risk Analytics Framework, IBM OpenPages)
-
SAS Institute (SAS Risk Management, SAS Risk Modeling)
-
Oracle (Oracle Risk Management Cloud, Oracle Financial Services Analytical Applications)
-
FIS (FIS Risk, Credit & Lending Solutions, FIS Enterprise Risk Suite)
-
Moody’s Analytics (RiskAnalyst, CreditLens)
-
ProcessUnity (ProcessUnity Vendor Risk Management, ProcessUnity Enterprise Risk Management)
-
ServiceNow (ServiceNow Risk Management, ServiceNow GRC)
-
MarshMcLennan (Marsh Advisory, Marsh Risk Consulting)
-
Aon (Aon RiskConsole, Aon Risk/View)
-
MetricStream (MetricStream Enterprise Risk Management, MetricStream Operational Risk Management)
-
Resolver (Resolver Risk Management Software, Resolver Enterprise Risk Management)
-
SAP (SAP Risk Management, SAP GRC Risk Management)
-
Milliman (Milliman Integrate, Milliman Arius)
-
LogicManager (LogicManager Risk Management Software, LogicManager Enterprise Risk Management)
-
Provenir (Provenir Risk Decisioning Platform, Provenir Data)
-
SAI360 (SAI360 Risk Management Software, SAI360 GRC Software)
-
Deloitte (Deloitte Risk Advisory Services, Deloitte Risk Intelligence)
-
OneTrust (OneTrust GRC, OneTrust Vendor Risk Management)
-
Diligent (Diligent Risk Management, Diligent GRC)
-
Alteryx (Alteryx Designer, Alteryx Server)
-
Crisil (Crisil Risk Solutions, Crisil Credit Risk Assessment)
-
Archer (Archer Enterprise Risk Management, Archer Operational Risk Management)
-
ZestyAI (Z-FIRE, Z-FLOOD)
-
Fusion Risk Management (Fusion Framework System, Fusion Risk Management Software)
-
RiskVille (RiskVille Risk Management System, RiskVille Insurance Management System)
-
Spin Analytics (RISKROBOT, Spin Analytics Credit Risk Modeling)
-
Kyvos Insights (Kyvos BI Acceleration Platform, Kyvos Smart OLAP)
-
Imperva (Imperva Data Security, Imperva Application Security)
-
Cirium (Cirium Risk Analytics, Cirium Ascend)
-
Quantexa (Quantexa Contextual Decision Intelligence Platform, Quantexa Entity Resolution)
-
ClickUp (ClickUp Project Management, ClickUp Task Management)
-
Sprinto (Sprinto Compliance Automation Platform, Sprinto Risk Management)
-
Ventiv (Ventiv Risk Management, Ventiv Claims Management)
-
Adenza (Adenza Risk Management, Adenza Regulatory Reporting)
-
Centrl.AI (Centrl Vendor Risk Management, Centrl Privacy Management)
-
SafetyCulture (iAuditor, SafetyCulture Risk Management)
-
Quantifi (Quantifi Risk, Quantifi Analytics)
-
CubeLogic (CubeLogic RiskCubed, CubeLogic Credit Risk)
-
Onspring (Onspring Risk Management, Onspring GRC)
-
Riskoptics (Riskoptics Risk Management Platform, Riskoptics Compliance Management)
Risk Analytics Market Competitive Landscape:
Union Bank of India: Established in 1919, Union Bank of India is a leading public sector bank headquartered in Mumbai, offering a wide range of banking and financial services including retail, corporate, and investment banking. With a strong national presence, the bank focuses on digital innovation, customer-centric solutions, and financial inclusion to support economic growth across India.
-
In 2024, Union Bank of India enhanced its risk management through SAS, integrating advanced solutions like SAS Stratum and Visual Analytics to strengthen data management, credit risk reporting, and regulatory compliance. This move aims to optimize operational efficiency and risk assessments.
Oracle Corporation: Established in 1977, Oracle Corporation is a global technology leader headquartered in Austin, Texas, specializing in database software, cloud solutions, and enterprise software products. The company provides integrated cloud applications and platform services, helping organizations streamline operations, enhance data management, and drive digital transformation across industries worldwide.
-
In 2024, Oracle launched an AI-powered Financial Services Compliance Agent to assist banks in mitigating anti-money laundering (AML) risks. The service offers enhanced transaction monitoring, proactive risk management, and supports regulatory compliance with efficient testing and evidence-based decision-making.
Milliman, Inc.: Established in 1947, Milliman is a leading global actuarial and consulting firm headquartered in Seattle, Washington. The company provides actuarial, risk management, and advisory services across insurance, healthcare, investment, and employee benefits sectors, helping organizations make informed decisions, manage risks, and optimize financial performance worldwide.
-
In 2024, Milliman unveiled its next-generation MedInsight payer platform, offering advanced healthcare analytics for improved decision-making, cost management, and collaboration between payers and providers
| Report Attributes | Details |
|---|---|
| Market Size in 2024 | USD 48.15 Billion |
| Market Size by 2032 | USD 108.53 Billion |
| CAGR | CAGR of 12.65% From 2025 to 2032 |
| Base Year | 2024 |
| Forecast Period | 2025-2032 |
| Historical Data | 2021-2023 |
| Report Scope & Coverage | Market Size, Segments Analysis, Competitive Landscape, Regional Analysis, DROC & SWOT Analysis, Forecast Outlook |
| Key Segments | • By Component (Software, Solutions) • By Risk Type Application (Operational Risk, Financial Risk, Compliance Risk, Strategic Risk, Others) • By Deployment Type (On-premise, Cloud) • By Industry Vertical (BFSI, Retail, Manufacturing, Telecom & IT, Energy and Utilities, Healthcare, Others) |
| Regional Analysis/Coverage | North America (US, Canada), Europe (Germany, UK, France, Italy, Spain, Russia, Poland, Rest of Europe), Asia Pacific (China, India, Japan, South Korea, Australia, ASEAN Countries, Rest of Asia Pacific), Middle East & Africa (UAE, Saudi Arabia, Qatar, South Africa, Rest of Middle East & Africa), Latin America (Brazil, Argentina, Mexico, Colombia, Rest of Latin America). |
| Company Profiles | IBM, SAS Institute, Oracle, FIS, Moody’s Analytics, ProcessUnity, ServiceNow, MarshMcLennan, Aon, MetricStream, Resolver, SAP, Milliman, LogicManager, Provenir, SAI360, Deloitte, OneTrust, Diligent, Alteryx, Crisil, Archer, ZestyAI, Fusion Risk Management, RiskVille, Spin Analytics, Kyvos Insights, Imperva, Cirium, Quantexa, ClickUp, Sprinto, Ventiv, Adenza, Centrl.AI, SafetyCulture, Quantifi, CubeLogic, Onspring, Riskoptics |
