Get More Information on RF Test Equipment Marke - Request Sample Report
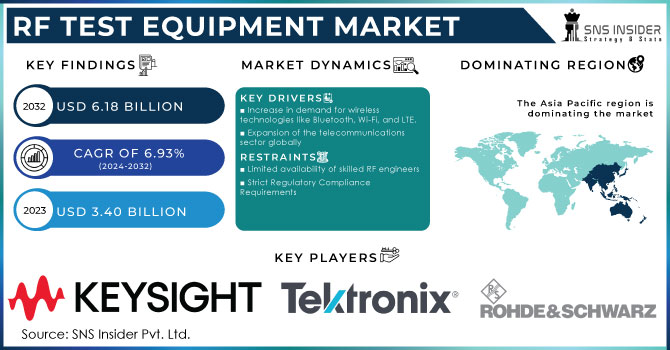
The RF Test Equipment Market size was valued at USD 3.40 billion in 2023 and is expected to reach USD 6.18 billion by 2032 and grow at a CAGR of 6.93% over the forecast period 2024-2032.
The RF test equipment market plays an important role in the expansion and operation of wireless communication systems by maintaining high device performance. RF signals are relevant to the development of telecommunication, automotive, aerospace, and defense systems. Advances in wireless-related technologies, such as 5G, the IoT, and contemporary satellite communications, have prompted the expansion of the RF Test Equipment market. According to the 5G Americas, 5G is the fastest-growing wireless technology that has already exceeded the connection of 4G LTE devices globally and is expected to reach over 3 billion connections by 2028. North America is the leading region that has 151 million of 5G connections in 2023. The introduction of 5G and 6G technologies requires very high frequency and complex modulations and the RF test equipment is capable of handling. For Example, Anritsu’s collaboration with AeroGT Labs in the area of 5G and aerospace testing solutions. The telecommunication industry requires different modulations and high frequencies to operate properly. Governments globally are investing in a high amount for better telecom infrastructure across the countries. For instance, in India, under the PLI scheme around Rs 12,195 crore is allotted for telecom and network products. Precise and reliable RF test equipment is a necessity and is in high demand by all of these stakeholders.
Development, production, and quality assurance of automotive radar systems rely mainly on RF test equipment. One of the key technologies that use CMOS radar is automotive radar systems. As reported by the International Telecommunication Union, it is expected that the availability of automotive radars in Europe will reach 65% by 2030, and in the United States, their availability will reach 50%. The relevant classification of automotive radar is made by dividing the technologies based on ranging capabilities and safety. The long-range category currently has the standard requirement for a 1 GHz bandwidth, and its EIRP maximum is 43 dBm, whereas the EIRP achieved by integrated radars is much lower. The power allowance of the medium/short-range category is lower, and the allowed bandwidth is wider because of the necessity to have higher range resolution for close targets, which is driven by the typical relation of range resolution and bandwidth as Δ R = c / (2 B), where Δ R is the range resolution, c is the speed of light, and B is the used bandwidth.
Drivers
Increase in demand for wireless technologies like Bluetooth, Wi-Fi, and LTE.
New wireless communication standards continue to evolve, requiring more sophisticated RF test equipment to assist in their deployment, development, and optimization. Device performance, signal quality, and wireless connectivity are becoming increasingly important for the given products, and RF test equipment is a vital technology to measure these features. The usage of wireless connections is growing, and equipment is applied to assess such parameters as signal strength, frequency response, modulation quality, or the levels of interference with other systems. The Internet of Things is becoming increasingly popular, and some of its devices do not offer a wired alternative. For instance, street lights or traffic sensors. These gadgets are tested and assessed to be compatible with the rest of the infrastructure of the places and times they work in.
Expansion of the telecommunications sector globally
The extensive growth of global telecommunications infrastructure stimulates the strong demand for RF test equipment. According to IBEF, the telecom industry in India is the second-largest country in APAC with 1.1 billion subscribers of wireless devices in 2024. RF test equipment helps measure the characteristic performance of a variety of network elements, such as base stations, antennas, or transmission lines. A significant driving force for the demand for RF test equipment is the spread of wireless services in the expanding market of developing countries. The substantial growth of global telecommunications infrastructure is an essential driving factor for RF test equipment.
Restraints
Limited availability of skilled RF engineers
The lack of skilled RF engineers is a major drawback for the RF test equipment market. The increasing complexity of RF designs results in the growing demand for engineers with experience in RF measurement and characterization. To reach the goal of overcoming this obstacle, several educational institutions and organizations throughout the industry offer specialized training in RF engineering. Some research about it may be required to ponder upon the problem.
Strict Regulatory Compliance Requirements
The RF test equipment market is affected by regulatory compliance including that being imposed by government agencies and industry standards organizations. These regulations tend to be time-consuming and costly on the part of the equipment manufacturer and the end users. As such, to restrict compliance concerns, manufacturers should invest in research and development to be certain that their products are at pace with the newest requirements and specifications. This also requires the provision of customers with complete documentation and support services, which can easily aid in compliance.
By Type
The oscilloscope segment has captured the maximum market share of over 28.14% in 2023. The growth can be attributed to the positioning of oscilloscopes as a superior signal-analyzing device. Oscilloscopes present a complete picture of a waveform signal in terms of frequencies or any other measurement allowing those devices to be used to design and troubleshoot RF circuits. The versatility of oscilloscopes allowed them to be frequently used in any industry or segment such as telecommunications automotive, aerospace, or consumer electronics. The spectrum analyzers segment is to show the fastest CAGR between 2024 and 2032. The anticipated growth is the result of the increasing demand for such tools throughout the years.
By Frequency Range
The 1-6 GHz segment led the market in 2023 with a market share of 30.16%. The segment is growing rapidly due to its reliability, good performance, and compliance with radio frequency. It provides accurate solutions for complex RF devices which increases the demand for this market. The 1-6 GHz RF test equipment is mostly used for wireless networks like Wi-Fi, Bluetooth, and LTE. The >20 GHz segment is growing at a faster rate due to its mmWave technology which is highly used in the automotive radars.
By Form
The benchtop segment has managed a market share of over 47% in 2023. The rise in the adoption of benchtop RF test equipment is because of the testing and validation it provides in various sectors like aerospace, defense, automotive, and electronics. This form of RD test equipment is flexible for use in high-frequency bands and complex modulation schemes. The modular segment is showing a stable CAGR during the forecast period which can make the segment fastest-growing. This RF test equipment can be customized based on the customers' needs.
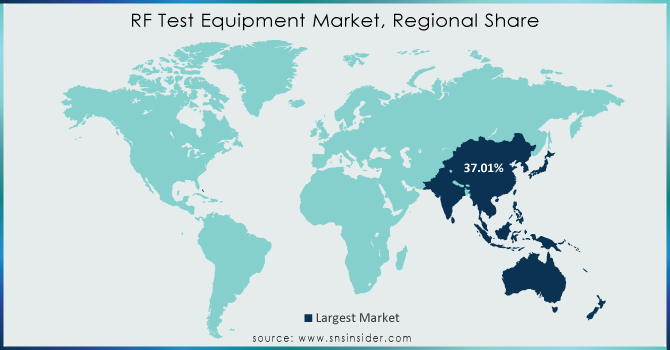
The RF test equipment market in Asia Pacific is dominating with a market share of over 37.00% in 2023. The region is the one experiencing the fastest growth in telecommunications, the manufacturing of electronics, and automotive. Since the Chinese market is developing in all possible directions, it is one of the market leaders in Asia Pacific. The rest of the regional growth factors include stable industries rich in every kind of knowledge and experience and the rising need for equipment. For example, Fortive, a leading supplier of advanced RF test equipment to various industries, stated in its annual report for 2023 that its intelligent operating solution segment has a growth in sales in 2023 of 4.7% in the APAC region. China is considered to be the major market to contribute to the rising sales of the company.
North America’s RF test equipment market is driven primarily by technological innovation, which makes the segment fastest-growing with a steady CAGR. Telecommunications, aerospace, and defense drive the need for ever more advanced testing solutions, and telecommunications infrastructure expansion, growing defense expenditures, and a leading position in electronics manufacturing only add to the growth of this market.
RF Test Equipment manufacturers are Keysight Technologies Inc., Anritsu Group, Rohde & Schwarz, Tektronix, Teledyne Technologies Inc., National Instruments, Yokogawa Electric Corporation, Siemens, Fortive, Chroma, Cobham PLC, EXFO, Giga-Tronics, Atlantic, B&K Corp, and others.
Recent Development
Keysight Technologies launched the P9372A PathWave RF Signal Generator in July 2024, offering enhanced performance and flexibility for wireless communication testing.
Rohde & Schwarz introduced the R&S TSME6/8 Signal and Spectrum Analyzer in [Month, Year], providing advanced capabilities for 5G and beyond testing.
Mobix Labs introduced the MBX3110 SP10T high-power RF switch in April 2024, targeting the land mobile radio market.
Report Attributes | Details |
---|---|
Market Size in 2023 | US$ 3.40 billion |
Market Size by 2032 | US$ 6.18 Billion |
CAGR | CAGR of 6.93 % From 2024 to 2032 |
Base Year | 2023 |
Forecast Period | 2024-2032 |
Historical Data | 2020-2022 |
Report Scope & Coverage | Market Size, Segments Analysis, Competitive Landscape, Regional Analysis, DROC & SWOT Analysis, Forecast Outlook |
Key Segments | • By Type (Oscilloscope, Spectrum Analyzers, Signal Generators, Network Analyzer, Power Meters, Others) • By Frequency Range (<1 GHz, 1-6 GHz, 7-20 GHz, >20 GHz) • By Form (Benchtop, Portable, Modular, Rackmount) • By End-User (telecommunications, Aerospace & Defense, Consumer Electronics, Automotive, Medical Devices, others) |
Regional Analysis/Coverage | North America (US, Canada, Mexico), Europe (Eastern Europe [Poland, Romania, Hungary, Turkey, Rest of Eastern Europe] Western Europe] Germany, France, UK, Italy, Spain, Netherlands, Switzerland, Austria, Rest of Western Europe]), Asia Pacific (China, India, Japan, South Korea, Vietnam, Singapore, Australia, Rest of Asia Pacific), Middle East & Africa (Middle East [UAE, Egypt, Saudi Arabia, Qatar, Rest of Middle East], Africa [Nigeria, South Africa, Rest of Africa], Latin America (Brazil, Argentina, Colombia, Rest of Latin America) |
Company Profiles | Keysight Technologies Inc., Anritsu Group, Rohde & Schwarz, Tektronix, Teledyne Technologies Inc., National Instruments, Yokogawa Electric Corporation, Siemens, Fortive, Chroma, Cobham PLC, EXFO, Giga-Tronics, Atlantic, B&K Corp |
Key Drivers | • Increase in demand for wireless technologies like Bluetooth, Wi-Fi, and LTE. |
RESTRAINTS | • Expansion of the telecommunications sector globally |
Ans: The RF Test Equipment Market is expected to grow at a CAGR of 6.93%.
Ans: RF Test Equipment Market size was USD 3.40 billion in 2023 and is expected to reach USD 6.18 billion by 2032.
Ans: The rise in the telecommunication sector and automotive radar systems is driving the RF Test Equipment Market.
Ans: The Telecommunications segment by End User dominates the RF Test Equipment Market.
Ans: The Asia Pacific region dominates the RF Test Equipment Market.
TABLE OF CONTENTS
1. Introduction
1.1 Market Definition
1.2 Scope
1.3 Research Assumptions
2. Industry Flowchart
3. Research Methodology
4. Market Dynamics
4.1 Drivers
4.2 Restraints
4.3 Opportunities
4.4 Challenges
5. Porter’s 5 Forces Model
6. Pest Analysis
7. RF Test Equipment Market Segmentation, By Type
7.1 Introduction
7.2 Oscilloscope
7.3 Spectrum Analyzer
7.4 Signal Generators
7.5 Network Analyzer
7.6 Power Meters
7.7 Total
8. RF Test Equipment Market Segmentation, By Frequency Range
8.1 Introduction
8.2 <1 GHz
8.3 1-6 GHz
8.4 7-20 GHz
8.5 >20 GHz
9. RF Test Equipment Market Segmentation, By Form
9.1 Introduction
9.2 Bench Top
9.3 Portable
9.4 Modular
9.5 Rackmount
10. RF Test Equipment Market Segmentation, By End-User
10.1 Introduction
10.2 Telecommunications
10.3 Aerospace & Defense
10.4 Consumer Electronics
10.5 Automotive
10.6 Medical Devices
10.7 Others
11. Regional Analysis
11.1 Introduction
11.2 North America
11.2.1 Trend Analysis
11.2.2 North America RF Test Equipment Market by Country
11.2.3 North America RF Test Equipment Market By Type
11.2.4 North America RF Test Equipment Market By Frequency Range
11.2.5 North America RF Test Equipment Market By Form
11.2.6 North America RF Test Equipment Market By End-User
11.2.7 USA
11.2.7.1 USA RF Test Equipment Market By Type
11.2.7.2 USA RF Test Equipment Market By Frequency Range
11.2.7.3 USA RF Test Equipment Market By Form
11.2.7.4 USA RF Test Equipment Market By End-User
11.2.8 Canada
11.2.8.1 Canada RF Test Equipment Market By Type
11.2.8.2 Canada RF Test Equipment Market By Frequency Range
11.2.8.3 Canada RF Test Equipment Market By Form
11.2.8.4 Canada RF Test Equipment Market By End-User
11.2.9 Mexico
11.2.9.1 Mexico RF Test Equipment Market By Type
11.2.9.2 Mexico RF Test Equipment Market By Frequency Range
11.2.9.3 Mexico RF Test Equipment Market By Form
11.2.9.4 Mexico RF Test Equipment Market By End-User
11.3 Europe
11.3.1 Trend Analysis
11.3.2 Eastern Europe
11.3.2.1 Eastern Europe RF Test Equipment Market by Country
11.3.2.2 Eastern Europe RF Test Equipment Market By Type
11.3.2.3 Eastern Europe RF Test Equipment Market By Frequency Range
11.3.2.4 Eastern Europe RF Test Equipment Market By Form
11.3.2.5 Eastern Europe RF Test Equipment Market By End-User
11.3.2.6 Poland
11.3.2.6.1 Poland RF Test Equipment Market By Type
11.3.2.6.2 Poland RF Test Equipment Market By Frequency Range
11.3.2.6.3 Poland RF Test Equipment Market By Form
11.3.2.6.4 Poland RF Test Equipment Market By End-User
11.3.2.7 Romania
11.3.2.7.1 Romania RF Test Equipment Market By Type
11.3.2.7.2 Romania RF Test Equipment Market By Frequency Range
11.3.2.7.3 Romania RF Test Equipment Market By Form
11.3.2.7.4 Romania RF Test Equipment Market By End-User
11.3.2.8 Hungary
11.3.2.8.1 Hungary RF Test Equipment Market By Type
11.3.2.8.2 Hungary RF Test Equipment Market By Frequency Range
11.3.2.8.3 Hungary RF Test Equipment Market By Form
11.3.2.8.4 Hungary RF Test Equipment Market By End-User
11.3.2.9 Turkey
11.3.2.9.1 Turkey RF Test Equipment Market By Type
11.3.2.9.2 Turkey RF Test Equipment Market By Frequency Range
11.3.2.9.3 Turkey RF Test Equipment Market By Form
11.3.2.9.4 Turkey RF Test Equipment Market By End-User
11.3.2.10 Rest of Eastern Europe
11.3.2.10.1 Rest of Eastern Europe RF Test Equipment Market By Type
11.3.2.10.2 Rest of Eastern Europe RF Test Equipment Market By Frequency Range
11.3.2.10.3 Rest of Eastern Europe RF Test Equipment Market By Form
11.3.2.10.4 Rest of Eastern Europe RF Test Equipment Market By End-User
11.3.3 Western Europe
11.3.3.1 Western Europe RF Test Equipment Market by Country
11.3.3.2 Western Europe RF Test Equipment Market By Type
11.3.3.3 Western Europe RF Test Equipment Market By Frequency Range
11.3.3.4 Western Europe RF Test Equipment Market By Form
11.3.3.5 Western Europe RF Test Equipment Market By End-User
11.3.3.6 Germany
11.3.3.6.1 Germany RF Test Equipment Market By Type
11.3.3.6.2 Germany RF Test Equipment Market By Frequency Range
11.3.3.6.3 Germany RF Test Equipment Market By Form
11.3.3.6.4 Germany RF Test Equipment Market By End-User
11.3.3.7 France
11.3.3.7.1 France RF Test Equipment Market By Type
11.3.3.7.2 France RF Test Equipment Market By Frequency Range
11.3.3.7.3 France RF Test Equipment Market By Form
11.3.3.7.4 France RF Test Equipment Market By End-User
11.3.3.8 UK
11.3.3.8.1 UK RF Test Equipment Market By Type
11.3.3.8.2 UK RF Test Equipment Market By Frequency Range
11.3.3.8.3 UK RF Test Equipment Market By Form
11.3.3.8.4 UK RF Test Equipment Market By End-User
11.3.3.9 Italy
11.3.3.9.1 Italy RF Test Equipment Market By Type
11.3.3.9.2 Italy RF Test Equipment Market By Frequency Range
11.3.3.9.3 Italy RF Test Equipment Market By Form
11.3.3.9.4 Italy RF Test Equipment Market By End-User
11.3.3.10 Spain
11.3.3.10.1 Spain RF Test Equipment Market By Type
11.3.3.10.2 Spain RF Test Equipment Market By Frequency Range
11.3.3.10.3 Spain RF Test Equipment Market By Form
11.3.3.10.4 Spain RF Test Equipment Market By End-User
11.3.3.11 Netherlands
11.3.3.11.1 Netherlands RF Test Equipment Market By Type
11.3.3.11.2 Netherlands RF Test Equipment Market By Frequency Range
11.3.3.11.3 Netherlands RF Test Equipment Market By Form
11.3.3.11.4 Netherlands RF Test Equipment Market By End-User
11.3.3.12 Switzerland
11.3.3.12.1 Switzerland RF Test Equipment Market By Type
11.3.3.12.2 Switzerland RF Test Equipment Market By Frequency Range
11.3.3.12.3 Switzerland RF Test Equipment Market By Form
11.3.3.12.4 Switzerland RF Test Equipment Market By End-User
11.3.3.13 Austria
11.3.3.13.1 Austria RF Test Equipment Market By Type
11.3.3.13.2 Austria RF Test Equipment Market By Frequency Range
11.3.3.13.3 Austria RF Test Equipment Market By Form
11.3.3.13.4 Austria RF Test Equipment Market By End-User
11.3.3.14 Rest of Western Europe
11.3.3.14.1 Rest of Western Europe RF Test Equipment Market By Type
11.3.3.14.2 Rest of Western Europe RF Test Equipment Market By Frequency Range
11.3.3.14.3 Rest of Western Europe RF Test Equipment Market By Form
11.3.3.14.4 Rest of Western Europe RF Test Equipment Market By End-User
11.4 Asia-Pacific
11.4.1 Trend Analysis
11.4.2 Asia-Pacific RF Test Equipment Market by Country
11.4.3 Asia-Pacific RF Test Equipment Market By Type
11.4.4 Asia-Pacific RF Test Equipment Market By Frequency Range
11.4.5 Asia-Pacific RF Test Equipment Market By Form
11.4.6 Asia-Pacific RF Test Equipment Market By End-User
11.4.7 China
11.4.7.1 China RF Test Equipment Market By Type
11.4.7.2 China RF Test Equipment Market By Frequency Range
11.4.7.3 China RF Test Equipment Market By Form
11.4.7.4 China RF Test Equipment Market By End-User
11.4.8 India
11.4.8.1 India RF Test Equipment Market By Type
11.4.8.2 India RF Test Equipment Market By Frequency Range
11.4.8.3 India RF Test Equipment Market By Form
11.4.8.4 India RF Test Equipment Market By End-User
11.4.9 Japan
11.4.9.1 Japan RF Test Equipment Market By Type
11.4.9.2 Japan RF Test Equipment Market By Frequency Range
11.4.9.3 Japan RF Test Equipment Market By Form
11.4.9.4 Japan RF Test Equipment Market By End-User
11.4.10 South Korea
11.4.10.1 South Korea RF Test Equipment Market By Type
11.4.10.2 South Korea RF Test Equipment Market By Frequency Range
11.4.10.3 South Korea RF Test Equipment Market By Form
11.4.10.4 South Korea RF Test Equipment Market By End-User
11.4.11 Vietnam
11.4.11.1 Vietnam RF Test Equipment Market By Type
11.4.11.2 Vietnam RF Test Equipment Market By Frequency Range
11.4.11.3 Vietnam RF Test Equipment Market By Form
11.4.11.4 Vietnam RF Test Equipment Market By End-User
11.4.12 Singapore
11.4.12.1 Singapore RF Test Equipment Market By Type
11.4.12.2 Singapore RF Test Equipment Market By Frequency Range
11.4.12.3 Singapore RF Test Equipment Market By Form
11.4.12.4 Singapore RF Test Equipment Market By End-User
11.4.13 Australia
11.4.13.1 Australia RF Test Equipment Market By Type
11.4.13.2 Australia RF Test Equipment Market By Frequency Range
11.4.13.3 Australia RF Test Equipment Market By Form
11.4.13.4 Australia RF Test Equipment Market By End-User
11.4.14 Rest of Asia-Pacific
11.4.14.1 Rest of Asia-Pacific RF Test Equipment Market By Type
11.4.14.2 Rest of Asia-Pacific RF Test Equipment Market By Frequency Range
11.4.14.3 Rest of Asia-Pacific RF Test Equipment Market By Form
11.4.14.4 Rest of Asia-Pacific RF Test Equipment Market By End-User
11.5 Middle East & Africa
11.5.1 Trend Analysis
11.5.2 Middle East
11.5.2.1 Middle East RF Test Equipment Market by Country
11.5.2.2 Middle East RF Test Equipment Market By Type
11.5.2.3 Middle East RF Test Equipment Market By Frequency Range
11.5.2.4 Middle East RF Test Equipment Market By Form
11.5.2.5 Middle East RF Test Equipment Market By End-User
11.5.2.6 UAE
11.5.2.6.1 UAE RF Test Equipment Market By Type
11.5.2.6.2 UAE RF Test Equipment Market By Frequency Range
11.5.2.6.3 UAE RF Test Equipment Market By Form
11.5.2.6.4 UAE RF Test Equipment Market By End-User
11.5.2.7 Egypt
11.5.2.7.1 Egypt RF Test Equipment Market By Type
11.5.2.7.2 Egypt RF Test Equipment Market By Frequency Range
11.5.2.7.3 Egypt RF Test Equipment Market By Form
11.5.2.7.4 Egypt RF Test Equipment Market By End-User
11.5.2.8 Saudi Arabia
11.5.2.8.1 Saudi Arabia RF Test Equipment Market By Type
11.5.2.8.2 Saudi Arabia RF Test Equipment Market By Frequency Range
11.5.2.8.3 Saudi Arabia RF Test Equipment Market By Form
11.5.2.8.4 Saudi Arabia RF Test Equipment Market By End-User
11.5.2.9 Qatar
11.5.2.9.1 Qatar RF Test Equipment Market By Type
11.5.2.9.2 Qatar RF Test Equipment Market By Frequency Range
11.5.2.9.3 Qatar RF Test Equipment Market By Form
11.5.2.9.4 Qatar RF Test Equipment Market By End-User
11.5.2.10 Rest of Middle East
11.5.2.10.1 Rest of Middle East RF Test Equipment Market By Type
11.5.2.10.2 Rest of Middle East RF Test Equipment Market By Frequency Range
11.5.2.10.3 Rest of Middle East RF Test Equipment Market By Form
11.5.2.10.4 Rest of Middle East RF Test Equipment Market By End-User
11.5.3 Africa
11.5.3.1 Africa RF Test Equipment Market by Country
11.5.3.2 Africa RF Test Equipment Market By Type
11.5.3.3 Africa RF Test Equipment Market By Frequency Range
11.5.3.4 Africa RF Test Equipment Market By Form
11.5.3.5 Africa RF Test Equipment Market By End-User
11.5.3.6 Nigeria
11.5.3.6.1 Nigeria RF Test Equipment Market By Type
11.5.3.6.2 Nigeria RF Test Equipment Market By Frequency Range
11.5.3.6.3 Nigeria RF Test Equipment Market By Form
11.5.3.6.4 Nigeria RF Test Equipment Market By End-User
11.5.3.7 South Africa
11.5.3.7.1 South Africa RF Test Equipment Market By Type
11.5.3.7.2 South Africa RF Test Equipment Market By Frequency Range
11.5.3.7.3 South Africa RF Test Equipment Market By Form
11.5.3.7.4 South Africa RF Test Equipment Market By End-User
11.5.3.8 Rest of Africa
11.5.3.8.1 Rest of Africa RF Test Equipment Market By Type
11.5.3.8.2 Rest of Africa RF Test Equipment Market By Frequency Range
11.5.3.8.3 Rest of Africa RF Test Equipment Market By Form
11.5.3.8.4 Rest of Africa RF Test Equipment Market By End-User
11.6 Latin America
11.6.1 Trend Analysis
11.6.2 Latin America RF Test Equipment Market by Country
11.6.3 Latin America RF Test Equipment Market By Type
11.6.4 Latin America RF Test Equipment Market By Frequency Range
11.6.5 Latin America RF Test Equipment Market By Form
11.6.6 Latin America RF Test Equipment Market By End-User
11.6.7 Brazil
11.6.7.1 Brazil RF Test Equipment Market By Type
11.6.7.2 Brazil RF Test Equipment Market By Frequency Range
11.6.7.3 Brazil RF Test Equipment Market By Form
11.6.7.4 Brazil RF Test Equipment Market By End-User
11.6.8 Argentina
11.6.8.1 Argentina RF Test Equipment Market By Type
11.6.8.2 Argentina RF Test Equipment Market By Frequency Range
11.6.8.3 Argentina RF Test Equipment Market By Form
11.6.8.4 Argentina RF Test Equipment Market By End-User
11.6.9 Colombia
11.6.9.1 Colombia RF Test Equipment Market By Type
11.6.9.2 Colombia RF Test Equipment Market By Frequency Range
11.6.9.3 Colombia RF Test Equipment Market By Form
11.6.9.4 Colombia RF Test Equipment Market By End-User
11.6.10 Rest of Latin America
11.6.10.1 Rest of Latin America RF Test Equipment Market By Type
11.6.10.2 Rest of Latin America RF Test Equipment Market By Frequency Range
11.6.10.3 Rest of Latin America RF Test Equipment Market By Form
11.6.10.4 Rest of Latin America RF Test Equipment Market By End-User
12. Company Profiles
12.1 Keysight Technologies Inc.
12.1.1 Company Overview
12.1.2 Financial
12.1.3 Products/ Services Offered
12.1.4 The SNS View
12.2 Anritsu Group
12.2.1 Company Overview
12.2.2 Financial
12.2.3 Products/ Services Offered
12.2.4 The SNS View
12.3 Rohde & Schwarz
12.3.1 Company Overview
12.3.2 Financial
12.3.3 Products/ Services Offered
12.3.4 The SNS View
12.4 Tektronix
12.4.1 Company Overview
12.4.2 Financial
12.4.3 Products/ Services Offered
12.4.4 The SNS View
12.5 Teledyne Technologies Inc.
12.5.1 Company Overview
12.5.2 Financial
12.5.3 Products/ Services Offered
12.5.4 The SNS View
12.6 National Instruments
12.6.1 Company Overview
12.6.2 Financial
12.6.3 Products/ Services Offered
12.6.4 The SNS View
12.7 Yokogawa Electric Corporation
12.7.1 Company Overview
12.7.2 Financial
12.7.3 Products/ Services Offered
12.7.4 The SNS View
12.8 Siemens
12.8.1 Company Overview
12.8.2 Financial
12.8.3 Products/ Services Offered
12.8.4 The SNS View
12.9 Fortive
12.9.1 Company Overview
12.9.2 Financial
12.9.3 Products/ Services Offered
12.9.4 The SNS View
12.10 Chroma
12.10.1 Company Overview
12.10.2 Financial
12.10.3 Products/ Services Offered
12.10.4 The SNS View
13. Competitive Landscape
13.1 Competitive Benchmarking
13.2 Market Share Analysis
13.3 Recent Developments
13.3.1 Industry News
13.3.2 Company News
13.3.3 Mergers & Acquisitions
14. Use Case and Best Practices
15. Conclusion
An accurate research report requires proper strategizing as well as implementation. There are multiple factors involved in the completion of good and accurate research report and selecting the best methodology to compete the research is the toughest part. Since the research reports we provide play a crucial role in any company’s decision-making process, therefore we at SNS Insider always believe that we should choose the best method which gives us results closer to reality. This allows us to reach at a stage wherein we can provide our clients best and accurate investment to output ratio.
Each report that we prepare takes a timeframe of 350-400 business hours for production. Starting from the selection of titles through a couple of in-depth brain storming session to the final QC process before uploading our titles on our website we dedicate around 350 working hours. The titles are selected based on their current market cap and the foreseen CAGR and growth.
The 5 steps process:
Step 1: Secondary Research:
Secondary Research or Desk Research is as the name suggests is a research process wherein, we collect data through the readily available information. In this process we use various paid and unpaid databases which our team has access to and gather data through the same. This includes examining of listed companies’ annual reports, Journals, SEC filling etc. Apart from this our team has access to various associations across the globe across different industries. Lastly, we have exchange relationships with various university as well as individual libraries.
Step 2: Primary Research
When we talk about primary research, it is a type of study in which the researchers collect relevant data samples directly, rather than relying on previously collected data. This type of research is focused on gaining content specific facts that can be sued to solve specific problems. Since the collected data is fresh and first hand therefore it makes the study more accurate and genuine.
We at SNS Insider have divided Primary Research into 2 parts.
Part 1 wherein we interview the KOLs of major players as well as the upcoming ones across various geographic regions. This allows us to have their view over the market scenario and acts as an important tool to come closer to the accurate market numbers. As many as 45 paid and unpaid primary interviews are taken from both the demand and supply side of the industry to make sure we land at an accurate judgement and analysis of the market.
This step involves the triangulation of data wherein our team analyses the interview transcripts, online survey responses and observation of on filed participants. The below mentioned chart should give a better understanding of the part 1 of the primary interview.
Part 2: In this part of primary research the data collected via secondary research and the part 1 of the primary research is validated with the interviews from individual consultants and subject matter experts.
Consultants are those set of people who have at least 12 years of experience and expertise within the industry whereas Subject Matter Experts are those with at least 15 years of experience behind their back within the same space. The data with the help of two main processes i.e., FGDs (Focused Group Discussions) and IDs (Individual Discussions). This gives us a 3rd party nonbiased primary view of the market scenario making it a more dependable one while collation of the data pointers.
Step 3: Data Bank Validation
Once all the information is collected via primary and secondary sources, we run that information for data validation. At our intelligence centre our research heads track a lot of information related to the market which includes the quarterly reports, the daily stock prices, and other relevant information. Our data bank server gets updated every fortnight and that is how the information which we collected using our primary and secondary information is revalidated in real time.
Step 4: QA/QC Process
After all the data collection and validation our team does a final level of quality check and quality assurance to get rid of any unwanted or undesired mistakes. This might include but not limited to getting rid of the any typos, duplication of numbers or missing of any important information. The people involved in this process include technical content writers, research heads and graphics people. Once this process is completed the title gets uploader on our platform for our clients to read it.
Step 5: Final QC/QA Process:
This is the last process and comes when the client has ordered the study. In this process a final QA/QC is done before the study is emailed to the client. Since we believe in giving our clients a good experience of our research studies, therefore, to make sure that we do not lack at our end in any way humanly possible we do a final round of quality check and then dispatch the study to the client.
Key Segments:
By Type
Oscilloscope
Spectrum Analyzer
Signal Generators
Network Analyzer
Power Meters
Total
By Frequency Range
<1 GHz
1-6 GHz
7-20 GHz
>20 GHz
By Form
Benchtop
Portable
Modular
Rackmount
By End-User
Telecommunications
Aerospace & Defense
Consumer Electronics
Automotive
Medical Devices
Others
Request for Segment Customization as per your Business Requirement: Segment Customization Request
REGIONAL COVERAGE:
North America
US
Canada
Mexico
Europe
Eastern Europe
Poland
Romania
Hungary
Turkey
Rest of Eastern Europe
Western Europe
Germany
France
UK
Italy
Spain
Netherlands
Switzerland
Austria
Rest of Western Europe
Asia Pacific
China
India
Japan
South Korea
Vietnam
Singapore
Australia
Rest of Asia Pacific
Middle East & Africa
Middle East
UAE
Egypt
Saudi Arabia
Qatar
Rest of the Middle East
Africa
Nigeria
South Africa
Rest of Africa
Latin America
Brazil
Argentina
Colombia
Request for Country Level Research Report: Country Level Customization Request
Available Customization
With the given market data, SNS Insider offers customization as per the company’s specific needs. The following customization options are available for the report:
Product Analysis
Criss-Cross segment analysis (e.g. Product X Application)
Product Matrix which gives a detailed comparison of product portfolio of each company
Geographic Analysis
Additional countries in any of the regions
Company Information
Detailed analysis and profiling of additional market players (Up to five)
The Contraband Detectors Market Size was valued at USD 4.50 billion in 2023 and is expected to reach USD 8.03 billion by 2031 and grow at a CAGR of 7.5% over the forecast period 2024-2031.
The Wide Bandgap Semiconductor Market size was valued at USD 1.2 billion in 2022 and is expected to grow to USD 7.01 billion by 2030 and grow at a CAGR of 24.7% over the forecast period of 2023-2030
The Call Control (PBX-IP PBX) Market Size was valued at USD 34.66 billion in 2023, and is expected to reach USD 252.71 billion by 2032 and grow at a CAGR of 24.7% over the forecast period 2024-2032.
The Analog Integrated Circuit Market Size was valued at USD 79.33 billion in 2023 and is expected to reach USD 147.74 Billion by 2032 and grow at a CAGR of 7.16% over the forecast period 2024-2032.
The Shock Sensor Market Size was valued at USD 1.10 billion in 2023 and is expected to reach USD 5.12 billion by 2031 and grow at a CAGR of 21.2% over the forecast period 2024-2031.
The RF Test Equipment Market size was valued at USD 3.40 billion in 2023 and is expected to reach USD 6.18 billion by 2032 and grow at a CAGR of 6.93% over the forecast period 2024-2032.
Hi! Click one of our member below to chat on Phone