Get More Information on Retinal Biologics Market - Request Sample Report
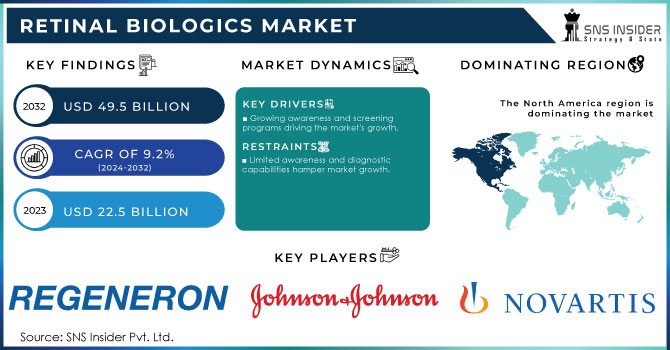
The Retinal Biologics Market Size was valued at USD 22.5 Billion in 2023 and is expected to reach USD 49.5 Billion by 2032 and grow at a CAGR of 9.2% over the forecast period 2024-2032.
The increasing prevalence of retinal diseases is among the most important factors fuelling the need for potent biological treatments. In specific, age-related macular degeneration, diabetic retinopathy, and retinal vein occlusion are increasing due to the global aging process and a higher number of people living with diabetes. The World Health Organization maintains that the number of individuals aged 65 and older is likely to double by 2050, reaching more than 1.5 billion people. As a consequence, the incidence of AMD is also rising because the disease is estimated to affect around 8.7% of the population aged 50 and older. This may increase the demand for retinal biologics market.
Accordingly, diabetic retinopathy, which affects approximately 35% of the population living with diabetes, is becoming a highly prevalent condition. The rising needs are currently being addressed with the help of advanced biological treatments, such as the new class of anti-VEGF medications and gene and cell-based therapies that are entering the market. The increased accessibility of such products is likely to fuel market growth, further increasing the need for novel therapies for the growing population.
There have been significant advances in the sphere of biologic therapies for the treatment of retinal diseases. New treatment options have changed the existing landscape, provided better results for the patients, and expanded the possibilities for care. For example, newer anti-VEGF molecular agents, such as aflibercept and brolucizumab, help achieve better control of conditions like AMD or diabetic retinopathy. Compared to their predecessors, these agents are more effective in treating retinal edema and improving visual acuity.
Additionally, there are ongoing advances in applied therapies, including novel targeted approaches and options for gene or cell manipulation that have the potential to become highly beneficial. RGX-314, for example, is a promising gene therapy candidate that could reduce the need for frequent injections by establishing sustained production of the necessary protein. I believe that these innovational opportunities are beneficial both in terms of the quality of care and the treatment effectiveness.
In 2024, Regeneron received FDA approval for EYLEA (aflibercept) 8 mg, a higher dose of its flagship anti-VEGF therapy. This extended dosing interval option is designed to improve patient adherence and reduce the burden of frequent injections.
Market Dynamics
Drivers
There is growing awareness of retinal diseases and comprehensive screening programs which are being conducted at regular intervals. Early detection and intervention are key factors that influence the demand for efficient retinal biologics. Public awareness and training programs conducted by hospitals and government health organizations highlight the need for regular eye examinations. With the detection of retinal disorders and degenerations in the early stages of development, individuals may be benefited by the timely intervention provided by clinics and treatment organizations. Therefore, it is reasonable to assume that public awareness and regular screening programs help spot retinal diseases responsible for affecting vision and promote the demand further. Early intervention programs also offset the progress of retinal disorders and prevent the occurrence of diseases such as diabetic retinopathy and age-related macular degeneration from taking place.
In 2024, the U.S. Food and Drug Administration will have approved Regeneron Pharmaceuticals’ EYLEA and Novartis’ Beovu as the new-generation anti-VEGF therapy. These retinal therapeutics differ from previous treatments in that they are more effective and have longer dosing intervals. The initiative to adopt the new-generation drugs became a timely response to the issue of patients’ needs because these eye drops are in high demand.
Additionally, the government-supported NEI campaigns to raise awareness and the funding of retinal research should contribute to the availability of biologic medications. These developments collectively enhance the demand for retinal biologics by fostering early diagnosis and ensuring more patients have access to advanced therapies.
Restrain
Limited awareness and diagnostic capabilities are significant restraints in the retinal biologics market. Many regions, particularly those with less developed healthcare infrastructures, suffer from a lack of awareness about retinal diseases and their potential impact on vision health. This limited awareness often translates into delayed diagnosis, as individuals may not seek medical attention until the disease has progressed to an advanced stage. Furthermore, diagnostic capabilities in some areas may be inadequate, with insufficient access to advanced imaging technologies and specialized diagnostic tools.
By Drug Class
VEGF-A antagonists held the largest revenue share of 65.1% in 2023. Antagonists of vascular endothelial growth factor A (VEGF-A) are a group of drugs commonly used for the treatment of a broad range of retinal diseases, including, but not limited to age-related macular degeneration and diabetic retinopathy. Among them, ranibizumab and aflibercept are the factors currently belonging to the most widespread class of agents used, as they have been shown to work effectively in inhibiting VEGF-A, a protein responsible for the growth of the blood vessels inside the retina and their subsequent leakage. Both of the aforementioned factors have been extensively tested both in regards to their efficiency in reducing the level of edema within the retina and their effectiveness in improving the visual acuity in patients involved in the test. As a result, they have been adopted quite widely within the clinical practice, and their market has seen a substantial amount of growth.
By Indication
The macular degeneration held the largest revenue share of 35.1% in 2023. This is owing to the increasing launches of drugs for this condition and the rising prevalence of macular degeneration all over the world. For example, the research published by the National Library of Medicine in September 2022, reveals that by the year 2040, about 300 million people will be diagnosed with Age-related macular degeneration worldwide.
Moreover, VEGF-A antagonists have achieved significant market penetration, supported by favorable reimbursement policies in many regions. Their success has been bolstered by the strong clinical evidence backing their use, which has led to greater acceptance by healthcare providers and patients.
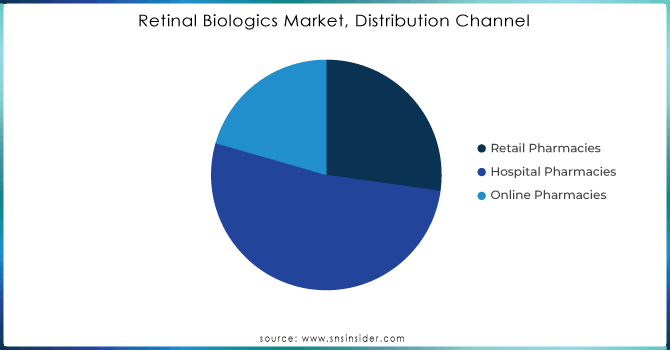
By Distribution Channel
Hospital Pharmacies dominated the market, with the highest share of 52.23% in 2023. This dominance is primarily due to the specialized nature of retinal biologics and the complex administration they often require. Retinal biologics, such as VEGF-A antagonists, are typically administered through intravitreal injections, a procedure that necessitates precise handling and administration by healthcare professionals. Hospital pharmacies are well-equipped to provide these specialized services, ensuring that patients receive the appropriate dosing and monitoring required for effective treatment.
Additionally, hospital pharmacies are often closely integrated with ophthalmology departments, which facilitates seamless patient management and treatment continuity. The availability of advanced diagnostic and treatment facilities within hospitals supports the use of these biologics, making hospital pharmacies the preferred channel for their distribution.
Need any customization research on Retinal Biologics Market - Enquiry Now
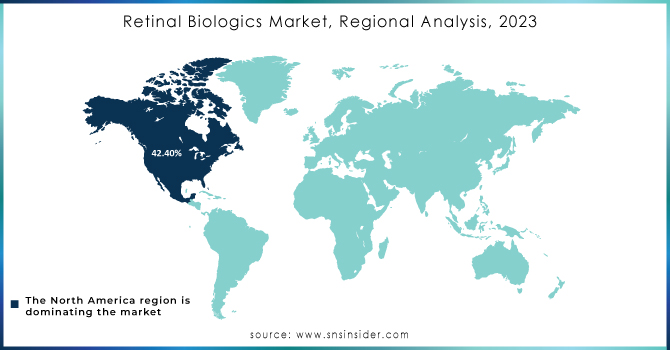
Regional Analysis
North America held the largest share around 42.40% in 2023. The market in the region is projected to be further boosted by the presence of a number of the major players. In addition to this, the leading players present in the region are implementing strategies such as acquisitions, product launches, and partnerships, to reinforce their position in the region. For example, in June 2020, Novoatris revealed that the U.S. FDA approved a label update for Beovu. The update includes the addition of a sub-section that is reserved for retinal vasculitis or retinal vascular occlusion under ‘Warnings and Precautions. The FDA also stated that information on post-marketing cases of retinal vasculitis or retinal vascular occlusion has been added to the Adverse Reactions section. In addition to this, in September 2021, the U.S. FDA approved the first biosimilar, Byooviz positive for macular disease.
Regeneron Pharmaceuticals, Inc. (EYLEA, Dupixent)
Novartis International AG (Lucentis, Beovu)
Roche Holding AG (Avastin, Susvimo)
Bausch + Lomb (Visudyne, Lumevoq)
Allergan plc (Ozurdex, Iluvien)
Pfizer Inc. (Ilaris, Xeljanz)
Boehringer Ingelheim (Vargatef, Ofev)
AbbVie Inc. (Humira, Rinvoq)
Sanofi S.A. (Lantus, Dupixent)
Bristol-Myers Squibb Company (Opdivo, Yervoy)
Johnson & Johnson (Stelara, Tremfya)
Amgen Inc. (Erenumab, Enbrel)
Eli Lilly and Company (Taltz, Cyramza)
AstraZeneca plc (Farxiga, Tagrisso)
Mylan N.V. (EpiPen, Xyrem)
Gilead Sciences, Inc. (Biktarvy, Veklury)
Merck & Co., Inc. (Keytruda, Januvia)
Teva Pharmaceutical Industries Ltd. (Ajovy, Copaxone)
Santen Pharmaceutical Co., Ltd. (Ikervis, Yasmin)
Shionogi & Co., Ltd. (Cresemba, Factive)
Others
Recent Development:
In 2024, Avita Pharmacy announced a strategic collaboration with a leading research institution to develop cutting-edge compounding techniques. This partnership is focused on advancing research in personalized medicine and creating new compounded formulations that offer distinct advantages over standard pharmaceutical products.
In 2023, Medisca rolled out a series of new patient-centric formulations designed to cater to specific needs not addressed by standard pharmaceuticals. This included the development of innovative dosage forms and flavors to enhance patient compliance.
| Report Attributes | Details |
| Market Size in 2023 | US$ 22.5 Billion |
| Market Size by 2032 | US$ 49.5 Billion |
| CAGR | CAGR of 9.2% From 2024 to 2032 |
| Base Year | 2023 |
| Forecast Period | 2024-2032 |
| Historical Data | 2020-2022 |
| Report Scope & Coverage | Market Size, Segments Analysis, Competitive Landscape, Regional Analysis, DROC & SWOT Analysis, Forecast Outlook |
| Key Segments | • By Drug Class (TNF-a Inhibitor, VEGF-A Antagonist) • By Indication (Macular Degeneration, Diabetic Retinopathy, Uveitis, And Others) • By Distribution Channel (Retail Pharmacies, Hospital Pharmacies, and Online Pharmacies) |
| Regional Analysis/Coverage | North America (US, Canada, Mexico), Europe (Eastern Europe [Poland, Romania, Hungary, Turkey, Rest of Eastern Europe] Western Europe] Germany, France, UK, Italy, Spain, Netherlands, Switzerland, Austria, Rest of Western Europe]), Asia Pacific (China, India, Japan, South Korea, Vietnam, Singapore, Australia, Rest of Asia Pacific), Middle East & Africa (Middle East [UAE, Egypt, Saudi Arabia, Qatar, Rest of Middle East], Africa [Nigeria, South Africa, Rest of Africa], Latin America (Brazil, Argentina, Colombia, Rest of Latin America) |
| Company Profiles | Novartis AG, Regeneron Pharmaceuticals, Inc., Roche Holding AG, Bayer AG, Santen Pharmaceutical Co., Ltd., Kodiak Sciences Inc., Zymeworks Inc., Hapten Pharmaceuticals Inc., Apellis Pharmaceuticals, Inc., Oculis SA, and other players. |
| Key Drivers | •Growing awareness and screening programs driving the market's growth. |
| RESTRAINTS | •Limited awareness and diagnostic capabilities hamper market growth. |
Ans. The projected market size for the Retinal Biologics Market is USD 49.5 billion by 2032.
Ans: The Hospital Pharmacies segment dominated the Retinal Biologics Market.
Ans: The North America region dominated the Retinal Biologics Market in 2023, with a 42.40% share.
Ans. The CAGR of the Retinal Biologics Market is 9.2% During the forecast period of 2024-2032.
Ans: Yes, you can customize the report as per your requirements.
Table of Contents
1. Introduction
1.1 Market Definition
1.2 Scope (Inclusion and Exclusions)
1.3 Research Assumptions
2. Executive Summary
2.1 Market Overview
2.2 Regional Synopsis
2.3 Competitive Summary
3. Research Methodology
3.1 Top-Down Approach
3.2 Bottom-up Approach
3.3. Data Validation
3.4 Primary Interviews
4. Market Dynamics Impact Analysis
4.1 Market Driving Factors Analysis
4.1.1 Drivers
4.1.2 Restraints
4.1.3 Opportunities
4.1.4 Challenges
4.2 PESTLE Analysis
4.3 Porter’s Five Forces Model
5. Statistical Insights and Trends Reporting
5.1 Incidence and Prevalence (2023)
5.2 Prescription Trends, (2023), by Region
5.3 Drug Volume: Production and usage volumes of pharmaceuticals.
5.4 Healthcare Spending: Expenditure data by government, insurers, and out-of-pocket by patients
6. Competitive Landscape
6.1 List of Major Companies, By Region
6.2 Market Share Analysis, By Region
6.3 Product Benchmarking
6.3.1 Product specifications and features
6.3.2 Pricing
6.4 Strategic Initiatives
6.4.1 Marketing and promotional activities
6.4.2 Distribution and supply chain strategies
6.4.3 Expansion plans and new product launches
6.4.4 Strategic partnerships and collaborations
6.5 Technological Advancements
6.6 Market Positioning and Branding
7. Retinal Biologics Market Segmentation, by Drug Class
7.1 Chapter Overview
7.2 TNF-a Inhibitor
7.2.1 TNF- a Inhibitor Market Trends Analysis (2020-2032)
7.2.2 TNF- a Inhibitor Market Size Estimates and Forecasts to 2032 (USD Billion)
7.3 VEGF-A Antagonist
7.3.1 VEGF-A Antagonist Market Trends Analysis (2020-2032)
7.3.2 VEGF-A Antagonist Market Size Estimates and Forecasts to 2032 (USD Billion)
8. Retinal Biologics Market Segmentation, by Indication
8.1 Chapter Overview
8.2 Macular Degeneration
8.2.1 Macular Degeneration Market Trends Analysis (2020-2032)
8.2.2 Macular Degeneration Market Size Estimates and Forecasts to 2032 (USD Billion)
8.3 Diabetic Retinopathy
8.3.1 Diabetic Retinopathy Market Trends Analysis (2020-2032)
8.3.2 Diabetic Retinopathy Market Size Estimates and Forecasts to 2032 (USD Billion)
8.4 Uveitis
8.4.1 Uveitis Market Trends Analysis (2020-2032)
8.4.2 Uveitis Market Size Estimates and Forecasts to 2032 (USD Billion)
8.5 Others
8.5.1 Others Market Trends Analysis (2020-2032)
8.5.2 Others Market Size Estimates and Forecasts to 2032 (USD Billion)
9. Retinal Biologics Market Segmentation, by Distribution Channel
9.1 Chapter Overview
9.2 Retail Pharmacies
9.2.1 Retail Pharmacies Market Trends Analysis (2020-2032)
9.2.2 Retail Pharmacies Market Size Estimates and Forecasts to 2032 (USD Billion)
9.3 Hospital Pharmacies
9.3.1 Hospital Pharmacies Market Trends Analysis (2020-2032)
9.3.2 Hospital Pharmacies Market Size Estimates and Forecasts to 2032 (USD Billion)
9.4 Online Pharmacies
9.4.1 Online Pharmacies Market Trends Analysis (2020-2032)
9.4.2 Online Pharmacies Market Size Estimates and Forecasts to 2032 (USD Billion)
10. Regional Analysis
10.1 Chapter Overview
10.2 North America
10.2.1 Trends Analysis
10.2.2 North America Retinal Biologics Market Estimates and Forecasts, by Country (2020-2032) (USD Billion)
10.2.3 North America Retinal Biologics Market Estimates and Forecasts, by Drug Class (2020-2032) (USD Billion)
10.2.4 North America Retinal Biologics Market Estimates and Forecasts, by Indication (2020-2032) (USD Billion)
10.2.5 North America Retinal Biologics Market Estimates and Forecasts, by Distribution Channel (2020-2032) (USD Billion)
10.2.6 USA
10.2.6.1 USA Retinal Biologics Market Estimates and Forecasts, by Drug Class (2020-2032) (USD Billion)
10.2.6.2 USA Retinal Biologics Market Estimates and Forecasts, by Indication (2020-2032) (USD Billion)
10.2.6.3 USA Retinal Biologics Market Estimates and Forecasts, by Distribution Channel (2020-2032) (USD Billion)
10.2.7 Canada
10.2.7.1 Canada Retinal Biologics Market Estimates and Forecasts, by Drug Class (2020-2032) (USD Billion)
10.2.7.2 Canada Retinal Biologics Market Estimates and Forecasts, by Indication (2020-2032) (USD Billion)
10.2.7.3 Canada Retinal Biologics Market Estimates and Forecasts, by Distribution Channel (2020-2032) (USD Billion)
10.2.8 Mexico
10.2.8.1 Mexico Retinal Biologics Market Estimates and Forecasts, by Drug Class (2020-2032) (USD Billion)
10.2.8.2 Mexico Retinal Biologics Market Estimates and Forecasts, by Indication (2020-2032) (USD Billion)
10.2.8.3 Mexico Retinal Biologics Market Estimates and Forecasts, by Distribution Channel (2020-2032) (USD Billion)
10.3 Europe
10.3.1 Eastern Europe
10.3.1.1 Trends Analysis
10.3.1.2 Eastern Europe Retinal Biologics Market Estimates and Forecasts, by Country (2020-2032) (USD Billion)
10.3.1.3 Eastern Europe Retinal Biologics Market Estimates and Forecasts, by Drug Class (2020-2032) (USD Billion)
10.3.1.4 Eastern Europe Retinal Biologics Market Estimates and Forecasts, by Indication (2020-2032) (USD Billion)
10.3.1.5 Eastern Europe Retinal Biologics Market Estimates and Forecasts, by Distribution Channel (2020-2032) (USD Billion)
10.3.1.6 Poland
10.3.1.6.1 Poland Retinal Biologics Market Estimates and Forecasts, by Drug Class (2020-2032) (USD Billion)
10.3.1.6.2 Poland Retinal Biologics Market Estimates and Forecasts, by Indication (2020-2032) (USD Billion)
10.3.1.6.3 Poland Retinal Biologics Market Estimates and Forecasts, by Distribution Channel (2020-2032) (USD Billion)
10.3.1.7 Romania
10.3.1.7.1 Romania Retinal Biologics Market Estimates and Forecasts, by Drug Class (2020-2032) (USD Billion)
10.3.1.7.2 Romania Retinal Biologics Market Estimates and Forecasts, by Indication (2020-2032) (USD Billion)
10.3.1.7.3 Romania Retinal Biologics Market Estimates and Forecasts, by Distribution Channel (2020-2032) (USD Billion)
10.3.1.8 Hungary
10.3.1.8.1 Hungary Retinal Biologics Market Estimates and Forecasts, by Drug Class (2020-2032) (USD Billion)
10.3.1.8.2 Hungary Retinal Biologics Market Estimates and Forecasts, by Indication (2020-2032) (USD Billion)
10.3.1.8.3 Hungary Retinal Biologics Market Estimates and Forecasts, by Distribution Channel (2020-2032) (USD Billion)
10.3.1.9 Turkey
10.3.1.9.1 Turkey Retinal Biologics Market Estimates and Forecasts, by Drug Class (2020-2032) (USD Billion)
10.3.1.9.2 Turkey Retinal Biologics Market Estimates and Forecasts, by Indication (2020-2032) (USD Billion)
10.3.1.9.3 Turkey Retinal Biologics Market Estimates and Forecasts, by Distribution Channel (2020-2032) (USD Billion)
10.3.1.10 Rest of Eastern Europe
10.3.1.10.1 Rest of Eastern Europe Retinal Biologics Market Estimates and Forecasts, by Drug Class (2020-2032) (USD Billion)
10.3.1.10.2 Rest of Eastern Europe Retinal Biologics Market Estimates and Forecasts, by Indication (2020-2032) (USD Billion)
10.3.1.10.3 Rest of Eastern Europe Retinal Biologics Market Estimates and Forecasts, by Distribution Channel (2020-2032) (USD Billion)
10.3.2 Western Europe
10.3.2.1 Trends Analysis
10.3.2.2 Western Europe Retinal Biologics Market Estimates and Forecasts, by Country (2020-2032) (USD Billion)
10.3.2.3 Western Europe Retinal Biologics Market Estimates and Forecasts, by Drug Class (2020-2032) (USD Billion)
10.3.2.4 Western Europe Retinal Biologics Market Estimates and Forecasts, by Indication (2020-2032) (USD Billion)
10.3.2.5 Western Europe Retinal Biologics Market Estimates and Forecasts, by Distribution Channel (2020-2032) (USD Billion)
10.3.2.6 Germany
10.3.2.6.1 Germany Retinal Biologics Market Estimates and Forecasts, by Drug Class (2020-2032) (USD Billion)
10.3.2.6.2 Germany Retinal Biologics Market Estimates and Forecasts, by Indication (2020-2032) (USD Billion)
10.3.2.6.3 Germany Retinal Biologics Market Estimates and Forecasts, by Distribution Channel (2020-2032) (USD Billion)
10.3.2.7 France
10.3.2.7.1 France Retinal Biologics Market Estimates and Forecasts, by Drug Class (2020-2032) (USD Billion)
10.3.2.7.2 France Retinal Biologics Market Estimates and Forecasts, by Indication (2020-2032) (USD Billion)
10.3.2.7.3 France Retinal Biologics Market Estimates and Forecasts, by Distribution Channel (2020-2032) (USD Billion)
10.3.2.8 UK
10.3.2.8.1 UK Retinal Biologics Market Estimates and Forecasts, by Drug Class (2020-2032) (USD Billion)
10.3.2.8.2 UK Retinal Biologics Market Estimates and Forecasts, by Indication (2020-2032) (USD Billion)
10.3.2.8.3 UK Retinal Biologics Market Estimates and Forecasts, by Distribution Channel (2020-2032) (USD Billion)
10.3.2.9 Italy
10.3.2.9.1 Italy Retinal Biologics Market Estimates and Forecasts, by Drug Class (2020-2032) (USD Billion)
10.3.2.9.2 Italy Retinal Biologics Market Estimates and Forecasts, by Indication (2020-2032) (USD Billion)
10.3.2.9.3 Italy Retinal Biologics Market Estimates and Forecasts, by Distribution Channel (2020-2032) (USD Billion)
10.3.2.10 Spain
10.3.2.10.1 Spain Retinal Biologics Market Estimates and Forecasts, by Drug Class (2020-2032) (USD Billion)
10.3.2.10.2 Spain Retinal Biologics Market Estimates and Forecasts, by Indication (2020-2032) (USD Billion)
10.3.2.10.3 Spain Retinal Biologics Market Estimates and Forecasts, by Distribution Channel (2020-2032) (USD Billion)
10.3.2.11 Netherlands
10.3.2.11.1 Netherlands Retinal Biologics Market Estimates and Forecasts, by Drug Class (2020-2032) (USD Billion)
10.3.2.11.2 Netherlands Retinal Biologics Market Estimates and Forecasts, by Indication (2020-2032) (USD Billion)
10.3.2.11.3 Netherlands Retinal Biologics Market Estimates and Forecasts, by Distribution Channel (2020-2032) (USD Billion)
10.3.2.12 Switzerland
10.3.2.12.1 Switzerland Retinal Biologics Market Estimates and Forecasts, by Drug Class (2020-2032) (USD Billion)
10.3.2.12.2 Switzerland Retinal Biologics Market Estimates and Forecasts, by Indication (2020-2032) (USD Billion)
10.3.2.12.3 Switzerland Retinal Biologics Market Estimates and Forecasts, by Distribution Channel (2020-2032) (USD Billion)
10.3.2.13 Austria
10.3.2.13.1 Austria Retinal Biologics Market Estimates and Forecasts, by Drug Class (2020-2032) (USD Billion)
10.3.2.13.2 Austria Retinal Biologics Market Estimates and Forecasts, by Indication (2020-2032) (USD Billion)
10.3.2.13.3 Austria Retinal Biologics Market Estimates and Forecasts, by Distribution Channel (2020-2032) (USD Billion)
10.3.2.14 Rest of Western Europe
10.3.2.14.1 Rest of Western Europe Retinal Biologics Market Estimates and Forecasts, by Drug Class (2020-2032) (USD Billion)
10.3.2.14.2 Rest of Western Europe Retinal Biologics Market Estimates and Forecasts, by Indication (2020-2032) (USD Billion)
10.3.2.14.3 Rest of Western Europe Retinal Biologics Market Estimates and Forecasts, by Distribution Channel (2020-2032) (USD Billion)
10.4 Asia Pacific
10.4.1 Trends Analysis
10.4.2 Asia Pacific Retinal Biologics Market Estimates and Forecasts, by Country (2020-2032) (USD Billion)
10.4.3 Asia Pacific Retinal Biologics Market Estimates and Forecasts, by Drug Class (2020-2032) (USD Billion)
10.4.4 Asia Pacific Retinal Biologics Market Estimates and Forecasts, by Indication (2020-2032) (USD Billion)
10.4.5 Asia Pacific Retinal Biologics Market Estimates and Forecasts, by Distribution Channel (2020-2032) (USD Billion)
10.4.6 China
10.4.6.1 China Retinal Biologics Market Estimates and Forecasts, by Drug Class (2020-2032) (USD Billion)
10.4.6.2 China Retinal Biologics Market Estimates and Forecasts, by Indication (2020-2032) (USD Billion)
10.4.6.3 China Retinal Biologics Market Estimates and Forecasts, by Distribution Channel (2020-2032) (USD Billion)
10.4.7 India
10.4.7.1 India Retinal Biologics Market Estimates and Forecasts, by Drug Class (2020-2032) (USD Billion)
10.4.7.2 India Retinal Biologics Market Estimates and Forecasts, by Indication (2020-2032) (USD Billion)
10.4.7.3 India Retinal Biologics Market Estimates and Forecasts, by Distribution Channel (2020-2032) (USD Billion)
10.4.8 Japan
10.4.8.1 Japan Retinal Biologics Market Estimates and Forecasts, by Drug Class (2020-2032) (USD Billion)
10.4.8.2 Japan Retinal Biologics Market Estimates and Forecasts, by Indication (2020-2032) (USD Billion)
10.4.8.3 Japan Retinal Biologics Market Estimates and Forecasts, by Distribution Channel (2020-2032) (USD Billion)
10.4.9 South Korea
10.4.9.1 South Korea Retinal Biologics Market Estimates and Forecasts, by Drug Class (2020-2032) (USD Billion)
10.4.9.2 South Korea Retinal Biologics Market Estimates and Forecasts, by Indication (2020-2032) (USD Billion)
10.4.9.3 South Korea Retinal Biologics Market Estimates and Forecasts, by Distribution Channel (2020-2032) (USD Billion)
10.4.10 Vietnam
10.4.10.1 Vietnam Retinal Biologics Market Estimates and Forecasts, by Drug Class (2020-2032) (USD Billion)
10.4.10.2 Vietnam Retinal Biologics Market Estimates and Forecasts, by Indication (2020-2032) (USD Billion)
10.4.10.3 Vietnam Retinal Biologics Market Estimates and Forecasts, by Distribution Channel (2020-2032) (USD Billion)
10.4.11 Singapore
10.4.11.1 Singapore Retinal Biologics Market Estimates and Forecasts, by Drug Class (2020-2032) (USD Billion)
10.4.11.2 Singapore Retinal Biologics Market Estimates and Forecasts, by Indication (2020-2032) (USD Billion)
10.4.11.3 Singapore Retinal Biologics Market Estimates and Forecasts, by Distribution Channel (2020-2032) (USD Billion)
10.4.12 Australia
10.4.12.1 Australia Retinal Biologics Market Estimates and Forecasts, by Drug Class (2020-2032) (USD Billion)
10.4.12.2 Australia Retinal Biologics Market Estimates and Forecasts, by Indication (2020-2032) (USD Billion)
10.4.12.3 Australia Retinal Biologics Market Estimates and Forecasts, by Distribution Channel (2020-2032) (USD Billion)
10.4.13 Rest of Asia Pacific
10.4.13.1 Rest of Asia Pacific Retinal Biologics Market Estimates and Forecasts, by Drug Class (2020-2032) (USD Billion)
10.4.13.2 Rest of Asia Pacific Retinal Biologics Market Estimates and Forecasts, by Indication (2020-2032) (USD Billion)
10.4.13.3 Rest of Asia Pacific Retinal Biologics Market Estimates and Forecasts, by Distribution Channel (2020-2032) (USD Billion)
10.5 Middle East and Africa
10.5.1 Middle East
10.5.1.1 Trends Analysis
10.5.1.2 Middle East Retinal Biologics Market Estimates and Forecasts, by Country (2020-2032) (USD Billion)
10.5.1.3 Middle East Retinal Biologics Market Estimates and Forecasts, by Drug Class (2020-2032) (USD Billion)
10.5.1.4 Middle East Retinal Biologics Market Estimates and Forecasts, by Indication (2020-2032) (USD Billion)
10.5.1.5 Middle East Retinal Biologics Market Estimates and Forecasts, by Distribution Channel (2020-2032) (USD Billion)
10.5.1.6 UAE
10.5.1.6.1 UAE Retinal Biologics Market Estimates and Forecasts, by Drug Class (2020-2032) (USD Billion)
10.5.1.6.2 UAE Retinal Biologics Market Estimates and Forecasts, by Indication (2020-2032) (USD Billion)
10.5.1.6.3 UAE Retinal Biologics Market Estimates and Forecasts, by Distribution Channel (2020-2032) (USD Billion)
10.5.1.7 Egypt
10.5.1.7.1 Egypt Retinal Biologics Market Estimates and Forecasts, by Drug Class (2020-2032) (USD Billion)
10.5.1.7.2 Egypt Retinal Biologics Market Estimates and Forecasts, by Indication (2020-2032) (USD Billion)
10.5.1.7.3 Egypt Retinal Biologics Market Estimates and Forecasts, by Distribution Channel (2020-2032) (USD Billion)
10.5.1.8 Saudi Arabia
10.5.1.8.1 Saudi Arabia Retinal Biologics Market Estimates and Forecasts, by Drug Class (2020-2032) (USD Billion)
10.5.1.8.2 Saudi Arabia Retinal Biologics Market Estimates and Forecasts, by Indication (2020-2032) (USD Billion)
10.5.1.8.3 Saudi Arabia Retinal Biologics Market Estimates and Forecasts, by Distribution Channel (2020-2032) (USD Billion)
10.5.1.9 Qatar
10.5.1.9.1 Qatar Retinal Biologics Market Estimates and Forecasts, by Drug Class (2020-2032) (USD Billion)
10.5.1.9.2 Qatar Retinal Biologics Market Estimates and Forecasts, by Indication (2020-2032) (USD Billion)
10.5.1.9.3 Qatar Retinal Biologics Market Estimates and Forecasts, by Distribution Channel (2020-2032) (USD Billion)
10.5.1.10 Rest of Middle East
10.5.1.10.1 Rest of Middle East Retinal Biologics Market Estimates and Forecasts, by Drug Class (2020-2032) (USD Billion)
10.5.1.10.2 Rest of Middle East Retinal Biologics Market Estimates and Forecasts, by Indication (2020-2032) (USD Billion)
10.5.1.10.3 Rest of Middle East Retinal Biologics Market Estimates and Forecasts, by Distribution Channel (2020-2032) (USD Billion)
10.5.2 Africa
10.5.2.1 Trends Analysis
10.5.2.2 Africa Retinal Biologics Market Estimates and Forecasts, by Country (2020-2032) (USD Billion)
10.5.2.3 Africa Retinal Biologics Market Estimates and Forecasts, by Drug Class (2020-2032) (USD Billion)
10.5.2.4 Africa Retinal Biologics Market Estimates and Forecasts, by Indication (2020-2032) (USD Billion)
10.5.2.5 Africa Retinal Biologics Market Estimates and Forecasts, by Distribution Channel (2020-2032) (USD Billion)
10.5.2.6 South Africa
10.5.2.6.1 South Africa Retinal Biologics Market Estimates and Forecasts, by Drug Class (2020-2032) (USD Billion)
10.5.2.6.2 South Africa Retinal Biologics Market Estimates and Forecasts, by Indication (2020-2032) (USD Billion)
10.5.2.6.3 South Africa Retinal Biologics Market Estimates and Forecasts, by Distribution Channel (2020-2032) (USD Billion)
10.5.2.7 Nigeria
10.5.2.7.1 Nigeria Retinal Biologics Market Estimates and Forecasts, by Drug Class (2020-2032) (USD Billion)
10.5.2.7.2 Nigeria Retinal Biologics Market Estimates and Forecasts, by Indication (2020-2032) (USD Billion)
10.5.2.7.3 Nigeria Retinal Biologics Market Estimates and Forecasts, by Distribution Channel (2020-2032) (USD Billion)
10.5.2.8 Rest of Africa
10.5.2.8.1 Rest of Africa Retinal Biologics Market Estimates and Forecasts, by Drug Class (2020-2032) (USD Billion)
10.5.2.8.2 Rest of Africa Retinal Biologics Market Estimates and Forecasts, by Indication (2020-2032) (USD Billion)
10.5.2.8.3 Rest of Africa Retinal Biologics Market Estimates and Forecasts, by Distribution Channel (2020-2032) (USD Billion)
10.6 Latin America
10.6.1 Trends Analysis
10.6.2 Latin America Retinal Biologics Market Estimates and Forecasts, by Country (2020-2032) (USD Billion)
10.6.3 Latin America Retinal Biologics Market Estimates and Forecasts, by Drug Class (2020-2032) (USD Billion)
10.6.4 Latin America Retinal Biologics Market Estimates and Forecasts, by Indication (2020-2032) (USD Billion)
10.6.5 Latin America Retinal Biologics Market Estimates and Forecasts, by Distribution Channel (2020-2032) (USD Billion)
10.6.6 Brazil
10.6.6.1 Brazil Retinal Biologics Market Estimates and Forecasts, by Drug Class (2020-2032) (USD Billion)
10.6.6.2 Brazil Retinal Biologics Market Estimates and Forecasts, by Indication (2020-2032) (USD Billion)
10.6.6.3 Brazil Retinal Biologics Market Estimates and Forecasts, by Distribution Channel (2020-2032) (USD Billion)
10.6.7 Argentina
10.6.7.1 Argentina Retinal Biologics Market Estimates and Forecasts, by Drug Class (2020-2032) (USD Billion)
10.6.7.2 Argentina Retinal Biologics Market Estimates and Forecasts, by Indication (2020-2032) (USD Billion)
10.6.7.3 Argentina Retinal Biologics Market Estimates and Forecasts, by Distribution Channel (2020-2032) (USD Billion)
10.6.8 Colombia
10.6.8.1 Colombia Retinal Biologics Market Estimates and Forecasts, by Drug Class (2020-2032) (USD Billion)
10.6.8.2 Colombia Retinal Biologics Market Estimates and Forecasts, by Indication (2020-2032) (USD Billion)
10.6.8.3 Colombia Retinal Biologics Market Estimates and Forecasts, by Distribution Channel (2020-2032) (USD Billion)
10.6.9 Rest of Latin America
10.6.9.1 Rest of Latin America Retinal Biologics Market Estimates and Forecasts, by Drug Class (2020-2032) (USD Billion)
10.6.9.2 Rest of Latin America Retinal Biologics Market Estimates and Forecasts, by Indication (2020-2032) (USD Billion)
10.6.9.3 Rest of Latin America Retinal Biologics Market Estimates and Forecasts, by Distribution Channel (2020-2032) (USD Billion)
11. Company Profiles
11.1 Novartis AG
11.1.1 Company Overview
11.1.2 Financial
11.1.3 Products/ Services Offered
11.1.4 SWOT Analysis
11.2 Regeneron Pharmaceuticals, Inc.
11.2.1 Company Overview
11.2.2 Financial
11.2.3 Products/ Services Offered
11.2.4 SWOT Analysis
11.3 Roche Holding AG
11.3.1 Company Overview
11.3.2 Financial
11.3.3 Products/ Services Offered
11.3.4 SWOT Analysis
11.4 Bayer AG
11.4.1 Company Overview
11.4.2 Financial
11.4.3 Products/ Services Offered
11.4.4 SWOT Analysis
11.5 Santen Pharmaceutical Co., Ltd.
11.5.1 Company Overview
11.5.2 Financial
11.5.3 Products/ Services Offered
11.5.4 SWOT Analysis
11.6 Kodiak Sciences Inc.
11.6.1 Company Overview
11.6.2 Financial
11.6.3 Products/ Services Offered
11.6.4 SWOT Analysis
11.7 Zymeworks Inc.
11.7.1 Company Overview
11.7.2 Financial
11.7.3 Products/ Services Offered
11.7.4 SWOT Analysis
11.8 Hapten Pharmaceuticals Inc.
11.8.1 Company Overview
11.8.2 Financial
11.8.3 Products/ Services Offered
11.8.4 SWOT Analysis
11.9 Apellis Pharmaceuticals, Inc.
11.9.1 Company Overview
11.9.2 Financial
11.9.3 Products/ Services Offered
11.9.4 SWOT Analysis
11.10 Oculis SA
11.10.1 Company Overview
11.10.2 Financial
11.10.3 Products/ Services Offered
11.10.4 SWOT Analysis
12. Use Cases and Best Practices
13. Conclusion
An accurate research report requires proper strategizing as well as implementation. There are multiple factors involved in the completion of good and accurate research report and selecting the best methodology to compete the research is the toughest part. Since the research reports we provide play a crucial role in any company’s decision-making process, therefore we at SNS Insider always believe that we should choose the best method which gives us results closer to reality. This allows us to reach at a stage wherein we can provide our clients best and accurate investment to output ratio.
Each report that we prepare takes a timeframe of 350-400 business hours for production. Starting from the selection of titles through a couple of in-depth brain storming session to the final QC process before uploading our titles on our website we dedicate around 350 working hours. The titles are selected based on their current market cap and the foreseen CAGR and growth.
The 5 steps process:
Step 1: Secondary Research:
Secondary Research or Desk Research is as the name suggests is a research process wherein, we collect data through the readily available information. In this process we use various paid and unpaid databases which our team has access to and gather data through the same. This includes examining of listed companies’ annual reports, Journals, SEC filling etc. Apart from this our team has access to various associations across the globe across different industries. Lastly, we have exchange relationships with various university as well as individual libraries.

Step 2: Primary Research
When we talk about primary research, it is a type of study in which the researchers collect relevant data samples directly, rather than relying on previously collected data. This type of research is focused on gaining content specific facts that can be sued to solve specific problems. Since the collected data is fresh and first hand therefore it makes the study more accurate and genuine.
We at SNS Insider have divided Primary Research into 2 parts.
Part 1 wherein we interview the KOLs of major players as well as the upcoming ones across various geographic regions. This allows us to have their view over the market scenario and acts as an important tool to come closer to the accurate market numbers. As many as 45 paid and unpaid primary interviews are taken from both the demand and supply side of the industry to make sure we land at an accurate judgement and analysis of the market.
This step involves the triangulation of data wherein our team analyses the interview transcripts, online survey responses and observation of on filed participants. The below mentioned chart should give a better understanding of the part 1 of the primary interview.

Part 2: In this part of primary research the data collected via secondary research and the part 1 of the primary research is validated with the interviews from individual consultants and subject matter experts.
Consultants are those set of people who have at least 12 years of experience and expertise within the industry whereas Subject Matter Experts are those with at least 15 years of experience behind their back within the same space. The data with the help of two main processes i.e., FGDs (Focused Group Discussions) and IDs (Individual Discussions). This gives us a 3rd party nonbiased primary view of the market scenario making it a more dependable one while collation of the data pointers.
Step 3: Data Bank Validation
Once all the information is collected via primary and secondary sources, we run that information for data validation. At our intelligence centre our research heads track a lot of information related to the market which includes the quarterly reports, the daily stock prices, and other relevant information. Our data bank server gets updated every fortnight and that is how the information which we collected using our primary and secondary information is revalidated in real time.

Step 4: QA/QC Process
After all the data collection and validation our team does a final level of quality check and quality assurance to get rid of any unwanted or undesired mistakes. This might include but not limited to getting rid of the any typos, duplication of numbers or missing of any important information. The people involved in this process include technical content writers, research heads and graphics people. Once this process is completed the title gets uploader on our platform for our clients to read it.
Step 5: Final QC/QA Process:
This is the last process and comes when the client has ordered the study. In this process a final QA/QC is done before the study is emailed to the client. Since we believe in giving our clients a good experience of our research studies, therefore, to make sure that we do not lack at our end in any way humanly possible we do a final round of quality check and then dispatch the study to the client.
Key Market Segments:
By Drug Class
TNF-a Inhibitor
VEGF-A Antagonist
By Indication
Macular Degeneration
Diabetic Retinopathy
Uveitis
Others
By Distribution Channel
Retail Pharmacies
Hospital Pharmacies
Online Pharmacies
Request for Segment Customization as per your Business Requirement: Segment Customization Request
Regional Coverage:
North America
US
Canada
Mexico
Europe
Eastern Europe
Poland
Romania
Hungary
Turkey
Rest of Eastern Europe
Western Europe
Germany
France
UK
Italy
Spain
Netherlands
Switzerland
Austria
Rest of Western Europe
Asia Pacific
China
India
Japan
South Korea
Vietnam
Singapore
Australia
Rest of Asia Pacific
Middle East & Africa
Middle East
UAE
Egypt
Saudi Arabia
Qatar
Rest of Middle East
Africa
Nigeria
South Africa
Rest of Africa
Latin America
Brazil
Argentina
Colombia
Rest of Latin America
Request for Country Level Research Report: Country Level Customization Request
Available Customization
With the given market data, SNS Insider offers customization as per the company’s specific needs. The following customization options are available for the report:
Product Analysis
Criss-Cross segment analysis (e.g. Product X Application)
Product Matrix which gives a detailed comparison of the product portfolio of each company
Geographic Analysis
Additional countries in any of the regions
Company Information
Detailed analysis and profiling of additional market players (Up to five)
The Hip Replacement Market Size was valued at USD 7.7 Bn in 2023 and is expected to reach USD 11.20 Bn by 2031 and grow at a CAGR of 4.8% over the forecast period of 2024-2031.
The Digital Neuro Biomarkers Market size was valued at USD 538.96 million in 2023 and is projected to reach USD 4592.14 million by 2032, growing at a CAGR of 25.96%.
The diabetic ulcer treatment market size was USD 8.22 Billion in 2023 and is expected to reach USD 14.35 Billion by 2032 and grow at a CAGR of 7.21% over the forecast period of 2024-2032.
The Compounding Pharmacies Market Size was valued at USD 12.6 Billion in 2023 and will hit USD 19.9 Billion by 2032 with an emerging CAGR of 5.2% Over the Forecast Period of 2024-2032.
The Periodontal Therapeutics Market was valued at USD 859.13 million in 2023 and is expected to reach USD 1666.11 million by 2032, growing at a CAGR of 7.62% from 2024-2032.
The Pet Sitting Market was valued at USD 2.62 billion in 2023 and is expected to reach USD 6.5 billion by 2032, growing at a CAGR of 10.64% over the forecast period 2024-2032.

Hi! Click one of our member below to chat on Phone
© 2025 All Rights Reserved by SNS Insider Pvt Ltd


