Retail Automation Market Size & Growth:
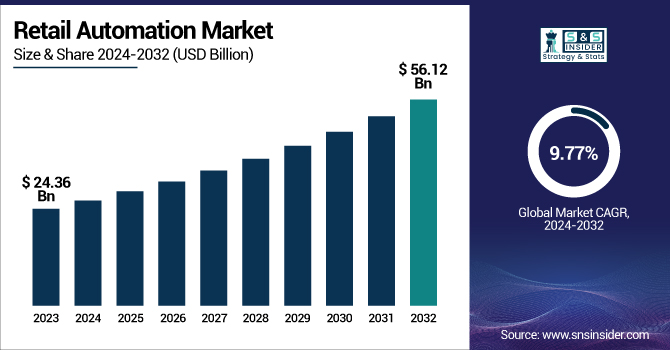
The Retail Automation Market was valued at USD 24.36 billion in 2023 and is expected to reach USD 56.12 billion by 2032, growing at a CAGR of 9.77% over the forecast period 2024-2032.
To Get more information on Retail Automation Market - Request Free Sample Report
The retail automation market is being driven by smart store solutions that emphasize the need for increased operational efficiency and customer experiences. Now, the usage of AI and machine learning during customer engagement leads to individual-based shopping. Robotics is gradually being utilized in the fulfillment and delivery process, allowing you to ease logistics. Retail automation is also a vital part of digital transformation programs, which can enable companies to improve efficiency, reduce costs, and generate frictionless, data-driven consumer experiences.
The U.S. Retail Automation Market is estimated to be USD 5.96 billion in 2023 and is projected to grow at a CAGR of 9.81%. Demand for efficiency, improved customer experiences, and cost reduction drives growth in the U. S. Retail Automation Market. The ongoing advancements of AI, machine learning, robotics, and IoT are accelerating automation in stores and warehouses. Furthermore, digital transformation and contactless solutions drive market growth.
Retail Automation Market Dynamics
Key Drivers:
-
Boosting Retail Automation Market Growth with AI Machine Learning and Contactless Solutions for Enhanced Efficiency
The growing necessity for improved customer experience and operational efficiency is anticipated to bolster the retail automation market growth. Retailers target faster QR payment and real-time service issues by investing in POS systems, Electronic shelf labels, RFID, and Cameras to automate the operations with minimum human Interaction, transformational, and rapid Transactions. In addition, increasing AI and machine learning adoption in the retail ambient provides real-time inventory management and personalized marketing, which further supports market growth. Furthermore, the growing labor cost and the need for contactless, self-checkout solutions.
Restrain:
-
Overcoming Integration Challenges and Resistance to Automation in Retail for Seamless Technological Advancements
The complexity of integrating new automation technologies with existing legacy systems is one of the major restraints in the retail automation market. Most retailers, especially those with decades of history, are stuck with traditional infrastructure that is not compatible with modern automation tools. This lack of integration creates gaps that can disrupt daily operations, create data inconsistencies, and require heavy customization. In addition, skilled personnel for managing and maintaining these automated systems need to be thoroughly trained, and that is a big hindrance, especially for small retailers. Another major roadblock to implementing automated solutions is staff and management resistance to change, as some may not be familiar with such technology or may fear job loss due to automation.
Opportunity:
-
Unlocking Retail Automation Growth in Emerging Economies through IoT, Robotics, AI, and Smart Solutions
Emerging economies are presenting immense growth potential as growing urbanization and organized retail are fuelling demand for automation. As more hypermarkets and supermarkets penetrate tier-2 and tier-3 cities, technology for adoption will generate more opportunities. In addition to this, the merging of IoT technology with retail automation systems is creating new business opportunities for IoT-based smart retail solutions that enable improved customer analytics and dynamic pricing. Retailers have also been exploring robotics and artificial intelligence (AI) surveillance to prevent theft and fortify security. The affordability and scale of the technology are expected to drive automation adoption among small and mid-sized retailers, contributing to the continued growth of the market.
Challenges:
-
Addressing Data Security Challenges and System Maintenance in Retail Automation for Customer Trust and Continuity
Automation Technologies need data from consumer likes to transaction history, which makes them riskier for cyberattacks and data breaches. Customer information is sensitive data, so retailers have to depend on robust cybersecurity frameworks for keeping customer information safe, data protection laws, and maintaining customer trust. A second obstacle is that the systems need to be regularly updated and maintained to function properly, particularly in high-traffic retail environments. Upgrading requires assuring continuity of service and controlling hardware and software suitability across multiple retail touchpoints, all of which can be technically complicated and labor-intensive.
Retail Automation Market Segment Analysis
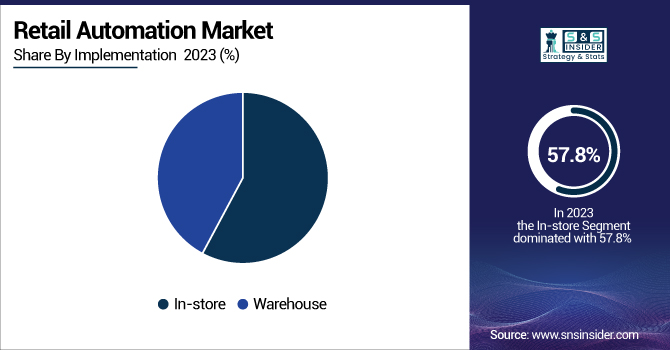
By Implementation
The in-store segment led the retail automation market by holding 57.8% of the overall market in 2023. Systems like self-checkout machines, electronic shelf labels, interactive kiosks, and smart surveillance in brick-and-mortar retail locations have powered this dominance. Such technologies have the benefits of improving customer experience, lowering checkout times, and enhancing inventory accuracy, making them extremely appealing to retailers looking to improve on the front-end while maximizing in-store engagement.
The warehouse segment is projected to be the fastest-growing (CAGR) segment between 2024 and 2032. The booming need for supply chain efficiency, rapid-fill orders, and quick inventory tracking is what is leading to automation adoption in warehouse operations. New technologies, including robotics, artificial intelligence-driven sorting systems, and automated guided vehicles (AGVs), are reinventing traditional warehousing by reducing human involvement, while improving accuracy, throughput, and scalability as the growth of e-commerce and omnichannel (multi-channel) retail strategies continues to accelerate.
By Product
The retail automation market by Point-of-Sale (POS) segment held the largest market share of 37.6% in 2023. The reason for this dominance is the heavy reliance in the retail sector on POS systems to handle sales transactions, inventory management, customer data, and analytics across every retail format. With mobile and cloud capabilities and up-to-the-minute reporting, modern point of sale solutions can help you streamline checkout and improve the customer experience. They also integrate with loyalty programs and crm systems which solidifies this category of devices in retail.
The camera segment is expected to register the fastest CAGR in the range of 2024 to 2032. Many more advanced applications today use cameras for not only security but also for customer behavior analysis, heat mapping, and automated checkout. AI and computer vision have moved into the market of retail, to make real-time analytics possible through cameras, which is why the device is being integrated very rapidly into operational intelligence for smart retail setups.
By End-Use
Supermarkets had the highest market share in the retail automation market with 36.3% in 2023. The high adoption of automation solutions, including self-checkout kiosks, electronic shelf labels, barcode scanners, and POS (point of sale) systems to optimize operational efficiency and improve customer shopping experience, is contributing to this dominance. As a supermarket can have a high footfall and varied SKUs, automation of inventory, quick check-outs store operations becomes important. Moreover, the increasing preference for contactless shopping and timely updates of real-time inventory has only sped up the automation of this sector.
The hypermarkets segment accounted for the largest market share in 2024 and is projected to register the fastest CAGR by 2032. The hypermarket market is expanding more around the world, and the hypermarket market is increasingly adopting advanced technologies such as AI-powered analytics, smart carts, and automated checkouts to lower the dependence on human labor and facilitate mass-scale operations. The sheer scale and the complexity of the hypermarket make it an ideal ground to go in for automation at an enterprise level, thus fast-tracking the growth of this model.
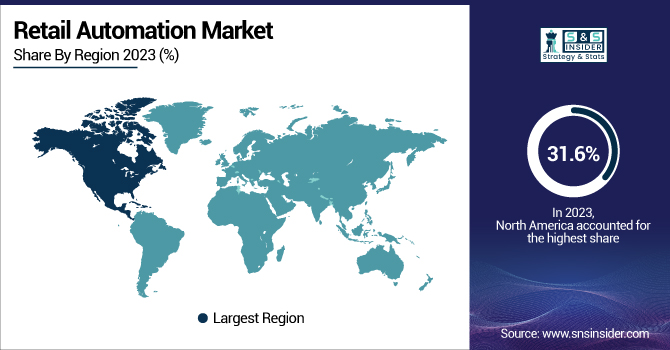
Retail Automation Market Regional Outlook
North America held the highest market share of 31.6% in the retail automation market in 2023. It is mainly because the presence of modern retail infrastructure and technology adoption is early in the U.S. and Canada that this leadership is being driven. Massive retail chains such as Walmart, Kroger, and Costco have made significant investments in automation solutions such as self-checkout systems, smart shelves, AI-driven analysis, and robotic process automation. North American retailers are also utilizing data analytics and consumer behavior tracking to offer unique shopping experiences and simplify operations. Automation adaptation has been further propelled by the region's strong focus on contactless shopping and streamlined customer service, especially in a post-pandemic world.
Asia Pacific is expected to be the fastest-growing region with the highest CAGR from 2024 to 2032 due to the rapid urbanization, growing disposable income, and expansion of organized retail. This growth is being particularly led by countries such as China, Japan, South Korea, and India. Examples include the fully automated checkouts, robotic kitchens, and app-based shopping integration of Alibaba's Hema supermarkets in China. Likewise, Japan seems to be also planning for electronic shelf labels and cashier-less stores with the Lawson and Family Mart chains. Across Asia Pacific, tremendous opportunities for retail automation are emerging, driven by the influx of tech-savvy consumers, coupled with the support rendered by the governments in various countries for digital transformation.
Get Customized Report as per Your Business Requirement - Enquiry Now
Key Players Listed in the Retail Automation Market are:
-
Toshiba Global Commerce Solutions (TCx™ Elevate Platform)
-
NCR Corporation (NCR FastLane SelfServ Checkout)
-
Diebold Nixdorf (Vynamic™ Retail Platform)
-
Fujitsu (U-Scan® Genesis II)
-
Honeywell (Voyager XP 1470g Barcode Scanner)
-
Zebra Technologies (DS9900 Series Scanner)
-
Panasonic (JS970 Point-of-Sale Terminal)
-
First Data (now part of Fiserv) (Clover POS System)
-
Oracle Corporation (Oracle Retail Xstore POS)
-
SAP SE (SAP Customer Activity Repository)
-
Posiflex Technology Inc. (RT-5016 POS Terminal)
-
ECR Software Corporation (ECRS) (CATAPULT Retail Automation Suite)
-
Blue Yonder (formerly JDA Software) (Luminate Platform)
-
Wincor Nixdorf (merged with Diebold) (BEETLE /iPOS plus Advanced)
-
Square Inc. (Square POS System)
Retail Automation Market - Recent Trends
-
In January 2025, Toshiba showcased its latest AI-powered POS systems and self-checkout innovations at NRF 2025, reinforcing its commitment to retail transformation. Key highlights included the versatile TCx 820 and MxP Vision Kiosk with biometric capabilities.
-
In May 2024, Zebra Technologies introduced new industrial automation solutions at Automate 2024, enhancing connected factory operations. Highlights included the FS42 fixed scanner, 3S Series 3D sensors, and Symmetry™ Fulfillment solution for improved productivity.
| Report Attributes | Details |
|---|---|
| Market Size in 2023 | USD 24.36 Billion |
| Market Size by 2032 | USD 56.12 Billion |
| CAGR | CAGR of 9.77% From 2024 to 2032 |
| Base Year | 2023 |
| Forecast Period | 2024-2032 |
| Historical Data | 2020-2022 |
| Report Scope & Coverage | Market Size, Segments Analysis, Competitive Landscape, Regional Analysis, DROC & SWOT Analysis, Forecast Outlook |
| Key Segments | • By Implementation (In-store, Warehouse) • By Product (Point-of-Sale (POS), RFID & Barcode, Camera, Electronic Shelf Label, Warehouse Robotics, Others) • By End-Use (Hypermarkets, Single Item Stores, Supermarkets, Fuel Stations, Retail Pharmacies, Others) |
| Regional Analysis/Coverage | North America (US, Canada, Mexico), Europe (Eastern Europe [Poland, Romania, Hungary, Turkey, Rest of Eastern Europe] Western Europe] Germany, France, UK, Italy, Spain, Netherlands, Switzerland, Austria, Rest of Western Europe]), Asia Pacific (China, India, Japan, South Korea, Vietnam, Singapore, Australia, Rest of Asia Pacific), Middle East & Africa (Middle East [UAE, Egypt, Saudi Arabia, Qatar, Rest of Middle East], Africa [Nigeria, South Africa, Rest of Africa], Latin America (Brazil, Argentina, Colombia, Rest of Latin America) |
| Company Profiles | Toshiba Global Commerce Solutions, NCR Corporation, Diebold Nixdorf, Fujitsu, Honeywell, Zebra Technologies, Panasonic, First Data (now part of Fiserv), Oracle Corporation, SAP SE, Posiflex Technology Inc., ECR Software Corporation (ECRS), Blue Yonder (formerly JDA Software), Wincor Nixdorf (merged with Diebold), Square Inc. |
