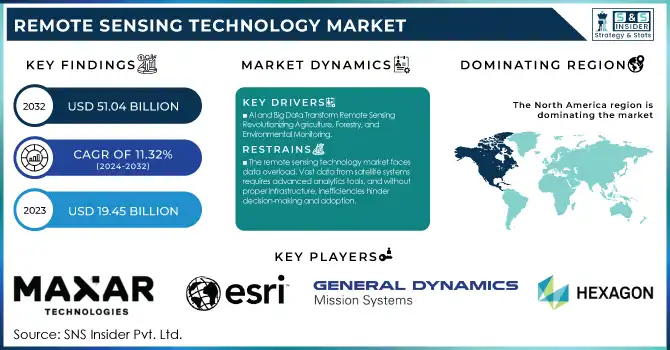
The Remote Sensing Technology Market size was valued at USD 19.45 billion in 2023 and is expected to grow to USD 51.04 billion by 2032 and grow at a CAGR of 11.32% over the forecast period of 2024-2032.
This market's growth is driven by increasing adoption rates across regions, with significant investments and funding from both private and public sectors, especially in defense, agriculture, and environmental monitoring. Geospatial data production is expanding rapidly as more satellites and sensors are deployed globally.
To get more information on Remote Sensing Technology Market - Request Free Sample Report
Additionally, innovations in remote sensing technologies and the rising demand for real-time data analytics are propelling market advancements, making it a crucial tool for governments, businesses, and industries aiming to enhance operational efficiency and decision-making capabilities.
Drivers:
AI and Big Data Transform Remote Sensing Revolutionizing Agriculture, Forestry, and Environmental Monitoring
The integration of AI and big data analytics is revolutionizing remote sensing technology by enhancing data processing, enabling real-time decision-making, and driving predictive analysis. Industries such as agriculture are increasingly using AI and remote sensing to simulate crop production scenarios and improve yield forecasting, marking a significant shift toward precision management. AI is also enhancing environmental monitoring by enabling applications like real-time tree sorting and ecosystem analysis. This convergence of AI with remote sensing technology is transforming sectors from agriculture to environmental conservation, driving innovation and boosting efficiency. The upcoming democratization of embedded analytics in 2025 is set to further amplify AI’s impact on these advancements. Nearly all (97%) industry leaders believe generative AI will be a game-changer for their companies, with 44% already making substantial investments. In the forestry sector, satellite-based harvest detection and digital photogrammetry are enabling scalable, real-time monitoring of planted forests. This technology holds particular value in New Zealand, where 1.8 million hectares of radiata pine forests play a crucial role in the country’s emission trading scheme and the pursuit of net-zero emissions by 2050. Similarly, in South Australia, 40,000 hectares of plantation estates contribute to a USD 3 billion industry, employing 18,000 people and benefiting local economies in construction, manufacturing, and tourism.
Restraints:
The remote sensing technology market faces data overload. Vast data from satellite systems requires advanced analytics tools, and without proper infrastructure, inefficiencies hinder decision-making and adoption.
Remote sensing technologies, particularly satellite-based systems, generate massive volumes of data, which can be difficult to manage and analyze efficiently. Without advanced data management systems and analytics tools, the sheer scale of this data can lead to significant inefficiencies, slowing down decision-making and increasing operational costs. Processing and storing such large datasets require substantial computational resources, which may not be accessible to all organizations, especially those in developing regions. Additionally, the inability to extract actionable insights from vast amounts of data hampers the widespread adoption and potential of remote sensing technologies across industries like agriculture, forestry, and environmental monitoring.
Opportunities:
Satellite Advancements Driving Growth in Remote Sensing Technology
The ongoing advancements in satellite technology, such as the development of smaller, more affordable satellites, are opening new opportunities in the remote sensing technology market. With improved capabilities and reduced costs, these innovations are making remote sensing data more accessible, fueling growth across industries like agriculture, environmental monitoring, and urban planning. Notable projects, such as Iran’s Navak micro-satellite launch and the EU’s secure satellite communication initiatives, showcase the potential for more precise, real-time data collection. As satellite technology evolves, the increased availability of high-quality satellite data will enhance applications ranging from climate monitoring to smart city development.
Challenges:
Integration of Diverse Data Sources as a Key Challenge in Remote Sensing Technology Market
The integration of diverse data sources in remote sensing technology presents a significant challenge, as it involves combining data from various sensors, satellites, and platforms with differing formats and standards. These datasets, including optical, radar, and LiDAR data, must be harmonized to create accurate, comprehensive models. This process requires sophisticated software tools and expertise in data fusion to ensure seamless integration, accurate interpretation, and effective utilization. The complexity increases when data is sourced from different geographical regions, requiring custom solutions to manage inconsistencies in data quality and resolution. Furthermore, real-time data integration demands high computational resources and efficient algorithms, which can be resource-intensive and expensive for organizations, particularly in developing regions.
By Technology
In 2023, the Passive Sensing segment captured the largest share of the remote sensing technology market, accounting for approximately 60% of the total revenue. Passive sensing systems utilize naturally available energy sources (for example, sunlight) to collect and measure environmental data. Such systems are widely used in satellite imaging, where they rely on the capture of either reflected light or thermal radiation emitted from bodies on the Earths surface. Passive sensing is gaining popularity due to its low cost, wide range of applications and high-resolution images for various industries, including agriculture, forestry and environmental monitoring. The growing adoption of passive sensing technologies is expected to continue to play a pivotal role in advancing remote sensing capabilities globally.
The Active Sensing segment is projected to be the fastest-growing segment in the remote sensing technology market from 2024 to 2032. This growth is driven progress in radar and lidar technology actively spraying signals and measuring how the signals bounce back in such a way that you get very precise data even in such challenging environmental conditions as cloud cover or low-light scenarios. Active sensing, capable of capturing accurate temporal data, finds its application in diverse fields ranging from land mapping to environmental monitoring and disaster management. Thus the increasing need for accurate, real-time information for applications such as agriculture, urban planning, and defense is anticipated to further propel the demand for active sensing technologies across the globe during the forecast period.
By Platform
The Aerial Systems segment dominated the remote sensing technology market with the largest share of revenue, accounting for approximately 70% in 2023. Due to the increasing adoption of drones and UAVs in a wide range of industries, including agriculture, environmental monitoring, and defense. Drones offer high-resolution images, real-time data collection and flexibility to reach remote or hard-to-access environments, which makes them suited for applications such as crop monitoring, disaster response, surveillance, and infrastructure inspection.As technological advancements enhance the capabilities of aerial systems, their adoption continues to grow, driving further expansion of this segment in the remote sensing market.
The Satellite segment is expected to be the fastest-growing in the remote sensing technology market from 2024 to 2032. This segment signified a notable demand for high resolution imagery, global extent coverage, as well as the ability to monitor large-scale areas instantaneously, which are all major factors that are expected to increase this segment. Remote sensing applications using satellites are done in various forms in agriculture, environmental studies, climate change and disaster management with continuous improvements in satellite capabilities, the market for satellite-based remote sensing is poised for significant expansion during the forecast period.
By Application
The Military & Intelligence segment dominated the largest share of the remote sensing technology market, accounting for around 40% of revenue in 2023, due to an increased reliance on remote sensing technologies for strategic defense, surveillance, and intelligence purposes. Satellites, drones and aerial systems among others through remote sensing technologies are providing real-time imaging, monitoring and data collection capabilities that are essential for national security operations. Military and intelligence agencies use these technologies for border surveillance, tracking enemy movements, reconnaissance, and reconnaissance during conflicts. With increasing geopolitical tensions as well as improvements in sensor technologies, which would continue propelling significant growth in this sector, as more advanced analytics combined with higher resolution data, improved security features, and more sophisticated strategies stand to help Defence strategies and operations all over the world.
The Disaster Management segment is expected to be the fastest-growing in the remote sensing technology market during the forecast period from 2024 to 2032. This growth is due to the rising demand for real-time data for analyzing and managing natural disasters, such as earthquakes, floods, wildfires, and hurricanes. Satellite imagery, aerial systems, and other remote-sensing technologies offer relevant data to monitor disasters, assess risks, and improve response coordination. They assist agencies and organizations in predicting, tracking and assessing disasters, allowing for greater emergency response planning.
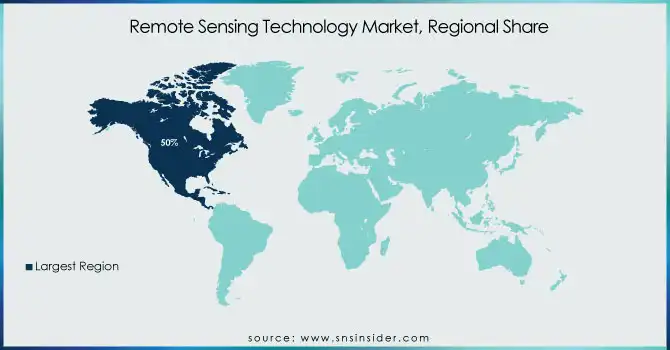
In 2023, North America held the largest market share of around 50% in the remote sensing technology market. The region's dominance can be attributed to the to the presence of major players, huge investments in space and defense technologies, and advanced satellite-based remote sensing systems in the region. R&D activities are focused alongside active and passive remote sensing technologies and are predominantly in North America (mainly the United States). The region's increasing need for remote sensing solutions in various industries such as agriculture, environmental monitoring, and defense also contributed to its market share. The region maintains its prominence in the global marketplace due to heavy government funding and public-private partnerships.
The Asia Pacific region is expected to be the fastest-growing market in remote sensing technology from 2024 to 2032. This growth is driven by rapid industrialization, growing investments in space technologies, and cross-industry embrace of remote sensing solutions in sectors like agriculture, environmental monitoring, and disaster management. Other countries, including China, India, Japan, and South Korea, have made major investments in satellite infrastructure and data analytics capabilities to improve monitoring and predictive analysis for agriculture, urban planning, and natural resource management. Additionally, the increasing focus of government bodies on enhancing environmental preservation measures and disaster management capability in the area is boosting the uptake of advanced remote sensing technologies. The region’s growing economy and technological capabilities will further drive the adoption of these technologies.
Get Customized Report as per Your Business Requirement - Enquiry Now
Some of the major players in Remote Sensing Technology Market along with their product:
Maxar Technologies (USA) (Earth Imaging, Satellite Services)
Esri (USA) (Geospatial Software, GIS Solutions)
General Dynamics Mission Systems, Inc. (USA) (Military Communication Systems, Remote Sensing Systems)
Hexagon AB (Sweden) (Geospatial Solutions, 3D Mapping, Remote Sensing Software)
Lockheed Martin Corporation (USA) (Defense Systems, Aerospace, Satellite Systems)
Orbital Insight (USA) (Geospatial Analytics, Remote Sensing Software)
Planet Labs PBC (USA) (Satellite Imagery, Earth Observation Data)
Northrop Grumman Corporation (USA) (Aerospace, Defense Systems, Space Systems)
General Dynamics Corp. (USA) (Defense & Aerospace Solutions, Remote Sensing Technologies)
Raytheon Corporation (USA) (Defense Systems, Satellite Solutions, Remote Sensing Systems)
Honeywell Technology Solutions Inc. (USA) (Aerospace, Satellite, Remote Sensing Technology)
ITT Corp. (USA) (Defense, Communication, Satellite Solutions)
Lumasense Technologies, Inc. (USA) (Environmental Sensors, Thermal Imaging)
Thales Group (France) (Defense Systems, Aerospace, Remote Sensing Solutions)
Leica Geosystems Holdings AG (Switzerland) (Surveying Instruments, 3D Scanning, Remote Sensing)
DigitalGlobe (USA) (Satellite Imagery, Geospatial Data)
List of suppliers who provide raw materials and components for the remote sensing technology market:
3M Company (USA)
Corning Incorporated (USA)
Teledyne Technologies (USA)
Vishay Intertechnology (USA)
Analog Devices (USA)
STMicroelectronics (Switzerland)
Honeywell International Inc. (USA)
Rohm Semiconductor (Japan)
Flir Systems (USA)
L3 Technologies (USA)
Raytheon Technologies (USA)
Northrop Grumman (USA)
Thales Group (France)
NXP Semiconductors (Netherlands)
Leica Microsystems (Germany)
November 8, 2024 – Maxar Intelligence has sold its Radar and Sensor Technology (RST) group to ARKA Group, a Danbury, Conn.-based government contractor. The deal further strengthens ARKA's capabilities in the fields of synthetic aperture radar (SAR) and geospatial intelligence, and set Maxar on its current path to focus on SAR with its joint partnership with Umbra.
January 12, 2024 – Northrop Grumman and the AUKUS alliance have presented the Deep Space Advanced Radar Capability (DARC) for improving space surveillance and protecting satellites in geosynchronous orbit. With that, the system will provide “24/7 and weather-resilient” coverage in a global net of advanced ground-based sensors, which represents a quantum leap in satellite protection.
| Report Attributes | Details |
|---|---|
| Market Size in 2023 | USD 19.45 Billion |
| Market Size by 2032 | USD 51.04 Billion |
| CAGR | CAGR of 11.32% From 2024 to 2032 |
| Base Year | 2023 |
| Forecast Period | 2024-2032 |
| Historical Data | 2020-2022 |
| Report Scope & Coverage | Market Size, Segments Analysis, Competitive Landscape, Regional Analysis, DROC & SWOT Analysis, Forecast Outlook |
| Key Segments | • By Technology (Active Sensing, Passive Sensing) • By Platform (Satellite, Aerial Systems) • By Application (Agriculture & Living Resources, Military & Intelligence, Disaster Management, Infrastructure, Weather, Others) |
| Regional Analysis/Coverage | North America (US, Canada, Mexico), Europe (Eastern Europe [Poland, Romania, Hungary, Turkey, Rest of Eastern Europe] Western Europe] Germany, France, UK, Italy, Spain, Netherlands, Switzerland, Austria, Rest of Western Europe]), Asia Pacific (China, India, Japan, South Korea, Vietnam, Singapore, Australia, Rest of Asia Pacific), Middle East & Africa (Middle East [UAE, Egypt, Saudi Arabia, Qatar, Rest of Middle East], Africa [Nigeria, South Africa, Rest of Africa], Latin America (Brazil, Argentina, Colombia, Rest of Latin America) |
| Company Profiles | Maxar Technologies (USA), Esri (USA), General Dynamics Mission Systems, Inc. (USA), Hexagon AB (Sweden), Lockheed Martin Corporation (USA), Orbital Insight (USA), Planet Labs PBC (USA), Northrop Grumman Corporation (USA), General Dynamics Corp. (USA), Raytheon Corporation (USA), Honeywell Technology Solutions Inc. (USA), ITT Corp. (USA), Lumasense Technologies, Inc. (USA), Thales Group (France), Leica Geosystems Holdings AG (Switzerland), DigitalGlobe (USA). |
Ans: The remote sensing technology market faces challenges such as high costs, data overload, accuracy and calibration issues, regulatory concerns, environmental interference, and technological limitations.
Ans: The Remote Sensing Technology market is expected to grow at a compound annual growth rate of 11.32% from 2024-2032
Ans: North America dominated the Remote Sensing Technology market
Ans: The global remote sensing technology market size was estimated at USD 19.45 billion in 2023 and is expected to reach USD 51.04 billion in 2032.
Ans: The growing adoption of Internet of Things (IoT) technology in agriculture is anticipated to drive market growth over the forecast period. IoT in agriculture uses remote sensors, drones, robots, and computer imaging to monitor crops and provide data to farmers for effective farm management.
1. Introduction
1.1 Market Definition
1.2 Scope (Inclusion and Exclusions)
1.3 Research Assumptions
2. Executive Summary
2.1 Market Overview
2.2 Regional Synopsis
2.3 Competitive Summary
3. Research Methodology
3.1 Top-Down Approach
3.2 Bottom-up Approach
3.3. Data Validation
3.4 Primary Interviews
4. Market Dynamics Impact Analysis
4.1 Market Driving Factors Analysis
4.1.1 Drivers
4.1.2 Restraints
4.1.3 Opportunities
4.1.4 Challenges
4.2 PESTLE Analysis
4.3 Porter’s Five Forces Model
5. Statistical Insights and Trends Reporting
5.1 Adoption and Usage Rates by Region
5.2 Investment and Funding by Region
5.3 Geospatial Data Production
6. Competitive Landscape
6.1 List of Major Companies, By Region
6.2 Market Share Analysis, By Region
6.3 Product Benchmarking
6.3.1 Product specifications and features
6.3.2 Pricing
6.4 Strategic Initiatives
6.4.1 Marketing and promotional activities
6.4.2 Distribution and supply chain strategies
6.4.3 Expansion plans and new product launches
6.4.4 Strategic partnerships and collaborations
6.5 Technological Advancements
6.6 Market Positioning and Branding
7. Remote Sensing Technology Market Segmentation, by Technology
7.1 Chapter Overview
7.2 Active Sensing
7.2.1 Active Sensing Market Trends Analysis (2020-2032)
7.2.2 Active Sensing Market Size Estimates and Forecasts to 2032 (USD Million)
7.3 Passive Sensing
7.3.1 Passive Sensing Market Trends Analysis (2020-2032)
7.3.2 Passive Sensing Market Size Estimates and Forecasts to 2032 (USD Million)
8. Remote Sensing Technology Market Segmentation, by Platform
8.1 Chapter Overview
8.2 Satellite
8.2.1 Satellite Market Trends Analysis (2020-2032)
8.2.2 Satellite Market Size Estimates and Forecasts to 2032 (USD Million)
8.3 Aerial Systems
8.3.1 Aerial Systems Market Trends Analysis (2020-2032)
8.3.2 Aerial Systems Market Size Estimates and Forecasts to 2032 (USD Billion)
9. Remote Sensing Technology Market Segmentation, by Application
9.1 Chapter Overview
9.2 Agriculture & Living Resources
9.2.1 Agriculture & Living Resources Market Trends Analysis (2020-2032)
9.2.2 Agriculture & Living Resources Market Size Estimates and Forecasts to 2032 (USD Billion)
9.3 Military & Intelligence
9.3.1 Military & Intelligence Market Trends Analysis (2020-2032)
9.3.2 Military & Intelligence Market Size Estimates and Forecasts to 2032 (USD Billion)
9.4 Disaster Management
9.4.1 Disaster Management Market Trends Analysis (2020-2032)
9.4.2 Disaster Management Market Size Estimates and Forecasts to 2032 (USD Billion)
9.5 Infrastructure
9.5.1 Infrastructure Market Trends Analysis (2020-2032)
9.5.2 Infrastructure Market Size Estimates and Forecasts to 2032 (USD Billion)
9.6 Weather
9.6.1 Weather Market Trends Analysis (2020-2032)
9.6.2 Weather Market Size Estimates and Forecasts to 2032 (USD Billion)
9.7 Others
9.7.1 Others Market Trends Analysis (2020-2032)
9.7.2 Others Market Size Estimates and Forecasts to 2032 (USD Billion)
10. Regional Analysis
10.1 Chapter Overview
10.2 North America
10.2.1 Trends Analysis
10.2.2 North America Remote Sensing Technology Market Estimates and Forecasts, by Country (2020-2032) (USD Billion)
10.2.3 North America Remote Sensing Technology Market Estimates and Forecasts, by Technology (2020-2032) (USD Billion)
10.2.4 North America Remote Sensing Technology Market Estimates and Forecasts, by Platform (2020-2032) (USD Billion)
10.2.5 North America Remote Sensing Technology Market Estimates and Forecasts, by Application (2020-2032) (USD Billion)
10.2.6 USA
10.2.6.1 USA Remote Sensing Technology Market Estimates and Forecasts, by Technology (2020-2032) (USD Billion)
10.2.6.2 USA Remote Sensing Technology Market Estimates and Forecasts, by Platform (2020-2032) (USD Billion)
10.2.6.3 USA Remote Sensing Technology Market Estimates and Forecasts, by Application (2020-2032) (USD Billion)
10.2.7 Canada
10.2.7.1 Canada Remote Sensing Technology Market Estimates and Forecasts, by Technology (2020-2032) (USD Billion)
10.2.7.2 Canada Remote Sensing Technology Market Estimates and Forecasts, by Platform (2020-2032) (USD Billion)
10.2.7.3 Canada Remote Sensing Technology Market Estimates and Forecasts, by Application (2020-2032) (USD Billion)
10.2.8 Mexico
10.2.8.1 Mexico Remote Sensing Technology Market Estimates and Forecasts, by Technology (2020-2032) (USD Billion)
10.2.8.2 Mexico Remote Sensing Technology Market Estimates and Forecasts, by Platform (2020-2032) (USD Billion)
10.2.8.3 Mexico Remote Sensing Technology Market Estimates and Forecasts, by Application (2020-2032) (USD Billion)
10.3 Europe
10.3.1 Eastern Europe
10.3.1.1 Trends Analysis
10.3.1.2 Eastern Europe Remote Sensing Technology Market Estimates and Forecasts, by Country (2020-2032) (USD Billion)
10.3.1.3 Eastern Europe Remote Sensing Technology Market Estimates and Forecasts, by Technology (2020-2032) (USD Billion)
10.3.1.4 Eastern Europe Remote Sensing Technology Market Estimates and Forecasts, by Platform (2020-2032) (USD Billion)
10.3.1.5 Eastern Europe Remote Sensing Technology Market Estimates and Forecasts, by Application (2020-2032) (USD Billion)
10.3.1.6 Poland
10.3.1.6.1 Poland Remote Sensing Technology Market Estimates and Forecasts, by Technology (2020-2032) (USD Billion)
10.3.1.6.2 Poland Remote Sensing Technology Market Estimates and Forecasts, by Platform (2020-2032) (USD Billion)
10.3.1.6.3 Poland Remote Sensing Technology Market Estimates and Forecasts, by Application (2020-2032) (USD Billion)
10.3.1.7 Romania
10.3.1.7.1 Romania Remote Sensing Technology Market Estimates and Forecasts, by Technology (2020-2032) (USD Billion)
10.3.1.7.2 Romania Remote Sensing Technology Market Estimates and Forecasts, by Platform (2020-2032) (USD Billion)
10.3.1.7.3 Romania Remote Sensing Technology Market Estimates and Forecasts, by Application (2020-2032) (USD Billion)
10.3.1.8 Hungary
10.3.1.8.1 Hungary Remote Sensing Technology Market Estimates and Forecasts, by Technology (2020-2032) (USD Billion)
10.3.1.8.2 Hungary Remote Sensing Technology Market Estimates and Forecasts, by Platform (2020-2032) (USD Billion)
10.3.1.8.3 Hungary Remote Sensing Technology Market Estimates and Forecasts, by Application (2020-2032) (USD Billion)
10.3.1.9 Turkey
10.3.1.9.1 Turkey Remote Sensing Technology Market Estimates and Forecasts, by Technology (2020-2032) (USD Billion)
10.3.1.9.2 Turkey Remote Sensing Technology Market Estimates and Forecasts, by Platform (2020-2032) (USD Billion)
10.3.1.9.3 Turkey Remote Sensing Technology Market Estimates and Forecasts, by Application (2020-2032) (USD Billion)
10.3.1.10 Rest of Eastern Europe
10.3.1.10.1 Rest of Eastern Europe Remote Sensing Technology Market Estimates and Forecasts, by Technology (2020-2032) (USD Billion)
10.3.1.10.2 Rest of Eastern Europe Remote Sensing Technology Market Estimates and Forecasts, by Platform (2020-2032) (USD Billion)
10.3.1.10.3 Rest of Eastern Europe Remote Sensing Technology Market Estimates and Forecasts, by Application (2020-2032) (USD Billion)
10.3.2 Western Europe
10.3.2.1 Trends Analysis
10.3.2.2 Western Europe Remote Sensing Technology Market Estimates and Forecasts, by Country (2020-2032) (USD Billion)
10.3.2.3 Western Europe Remote Sensing Technology Market Estimates and Forecasts, by Technology (2020-2032) (USD Billion)
10.3.2.4 Western Europe Remote Sensing Technology Market Estimates and Forecasts, by Platform (2020-2032) (USD Billion)
10.3.2.5 Western Europe Remote Sensing Technology Market Estimates and Forecasts, by Application (2020-2032) (USD Billion)
10.3.2.6 Germany
10.3.2.6.1 Germany Remote Sensing Technology Market Estimates and Forecasts, by Technology (2020-2032) (USD Billion)
10.3.2.6.2 Germany Remote Sensing Technology Market Estimates and Forecasts, by Platform (2020-2032) (USD Billion)
10.3.2.6.3 Germany Remote Sensing Technology Market Estimates and Forecasts, by Application (2020-2032) (USD Billion)
10.3.2.7 France
10.3.2.7.1 France Remote Sensing Technology Market Estimates and Forecasts, by Technology (2020-2032) (USD Billion)
10.3.2.7.2 France Remote Sensing Technology Market Estimates and Forecasts, by Platform (2020-2032) (USD Billion)
10.3.2.7.3 France Remote Sensing Technology Market Estimates and Forecasts, by Application (2020-2032) (USD Billion)
10.3.2.8 UK
10.3.2.8.1 UK Remote Sensing Technology Market Estimates and Forecasts, by Technology (2020-2032) (USD Billion)
10.3.2.8.2 UK Remote Sensing Technology Market Estimates and Forecasts, by Platform (2020-2032) (USD Billion)
10.3.2.8.3 UK Remote Sensing Technology Market Estimates and Forecasts, by Application (2020-2032) (USD Billion)
10.3.2.9 Italy
10.3.2.9.1 Italy Remote Sensing Technology Market Estimates and Forecasts, by Technology (2020-2032) (USD Billion)
10.3.2.9.2 Italy Remote Sensing Technology Market Estimates and Forecasts, by Platform (2020-2032) (USD Billion)
10.3.2.9.3 Italy Remote Sensing Technology Market Estimates and Forecasts, by Application (2020-2032) (USD Billion)
10.3.2.10 Spain
10.3.2.10.1 Spain Remote Sensing Technology Market Estimates and Forecasts, by Technology (2020-2032) (USD Billion)
10.3.2.10.2 Spain Remote Sensing Technology Market Estimates and Forecasts, by Platform (2020-2032) (USD Billion)
10.3.2.10.3 Spain Remote Sensing Technology Market Estimates and Forecasts, by Application (2020-2032) (USD Billion)
10.3.2.11 Netherlands
10.3.2.11.1 Netherlands Remote Sensing Technology Market Estimates and Forecasts, by Technology (2020-2032) (USD Billion)
10.3.2.11.2 Netherlands Remote Sensing Technology Market Estimates and Forecasts, by Platform (2020-2032) (USD Billion)
10.3.2.11.3 Netherlands Remote Sensing Technology Market Estimates and Forecasts, by Application (2020-2032) (USD Billion)
10.3.2.12 Switzerland
10.3.2.12.1 Switzerland Remote Sensing Technology Market Estimates and Forecasts, by Technology (2020-2032) (USD Billion)
10.3.2.12.2 Switzerland Remote Sensing Technology Market Estimates and Forecasts, by Platform (2020-2032) (USD Billion)
10.3.2.12.3 Switzerland Remote Sensing Technology Market Estimates and Forecasts, by Application (2020-2032) (USD Billion)
10.3.2.13 Austria
10.3.2.13.1 Austria Remote Sensing Technology Market Estimates and Forecasts, by Technology (2020-2032) (USD Billion)
10.3.2.13.2 Austria Remote Sensing Technology Market Estimates and Forecasts, by Platform (2020-2032) (USD Billion)
10.3.2.13.3 Austria Remote Sensing Technology Market Estimates and Forecasts, by Application (2020-2032) (USD Billion)
10.3.2.14 Rest of Western Europe
10.3.2.14.1 Rest of Western Europe Remote Sensing Technology Market Estimates and Forecasts, by Technology (2020-2032) (USD Billion)
10.3.2.14.2 Rest of Western Europe Remote Sensing Technology Market Estimates and Forecasts, by Platform (2020-2032) (USD Billion)
10.3.2.14.3 Rest of Western Europe Remote Sensing Technology Market Estimates and Forecasts, by Application (2020-2032) (USD Billion)
10.4 Asia Pacific
10.4.1 Trends Analysis
10.4.2 Asia Pacific Remote Sensing Technology Market Estimates and Forecasts, by Country (2020-2032) (USD Billion)
10.4.3 Asia Pacific Remote Sensing Technology Market Estimates and Forecasts, by Technology (2020-2032) (USD Billion)
10.4.4 Asia Pacific Remote Sensing Technology Market Estimates and Forecasts, by Platform (2020-2032) (USD Billion)
10.4.5 Asia Pacific Remote Sensing Technology Market Estimates and Forecasts, by Application (2020-2032) (USD Billion)
10.4.6 China
10.4.6.1 China Remote Sensing Technology Market Estimates and Forecasts, by Technology (2020-2032) (USD Billion)
10.4.6.2 China Remote Sensing Technology Market Estimates and Forecasts, by Platform (2020-2032) (USD Billion)
10.4.6.3 China Remote Sensing Technology Market Estimates and Forecasts, by Application (2020-2032) (USD Billion)
10.4.7 India
10.4.7.1 India Remote Sensing Technology Market Estimates and Forecasts, by Technology (2020-2032) (USD Billion)
10.4.7.2 India Remote Sensing Technology Market Estimates and Forecasts, by Platform (2020-2032) (USD Billion)
10.4.7.3 India Remote Sensing Technology Market Estimates and Forecasts, by Application (2020-2032) (USD Billion)
10.4.8 Japan
10.4.8.1 Japan Remote Sensing Technology Market Estimates and Forecasts, by Technology (2020-2032) (USD Billion)
10.4.8.2 Japan Remote Sensing Technology Market Estimates and Forecasts, by Platform (2020-2032) (USD Billion)
10.4.8.3 Japan Remote Sensing Technology Market Estimates and Forecasts, by Application (2020-2032) (USD Billion)
10.4.9 South Korea
10.4.9.1 South Korea Remote Sensing Technology Market Estimates and Forecasts, by Technology (2020-2032) (USD Billion)
10.4.9.2 South Korea Remote Sensing Technology Market Estimates and Forecasts, by Platform (2020-2032) (USD Billion)
10.4.9.3 South Korea Remote Sensing Technology Market Estimates and Forecasts, by Application (2020-2032) (USD Billion)
10.4.10 Vietnam
10.4.10.1 Vietnam Remote Sensing Technology Market Estimates and Forecasts, by Technology (2020-2032) (USD Billion)
10.4.10.2 Vietnam Remote Sensing Technology Market Estimates and Forecasts, by Platform (2020-2032) (USD Billion)
10.4.10.3 Vietnam Remote Sensing Technology Market Estimates and Forecasts, by Application (2020-2032) (USD Billion)
10.4.11 Singapore
10.4.11.1 Singapore Remote Sensing Technology Market Estimates and Forecasts, by Technology (2020-2032) (USD Billion)
10.4.11.2 Singapore Remote Sensing Technology Market Estimates and Forecasts, by Platform (2020-2032) (USD Billion)
10.4.11.3 Singapore Remote Sensing Technology Market Estimates and Forecasts, by Application (2020-2032) (USD Billion)
10.4.12 Australia
10.4.12.1 Australia Remote Sensing Technology Market Estimates and Forecasts, by Technology (2020-2032) (USD Billion)
10.4.12.2 Australia Remote Sensing Technology Market Estimates and Forecasts, by Platform (2020-2032) (USD Billion)
10.4.12.3 Australia Remote Sensing Technology Market Estimates and Forecasts, by Application (2020-2032) (USD Billion)
10.4.13 Rest of Asia Pacific
10.4.13.1 Rest of Asia Pacific Remote Sensing Technology Market Estimates and Forecasts, by Technology (2020-2032) (USD Billion)
10.4.13.2 Rest of Asia Pacific Remote Sensing Technology Market Estimates and Forecasts, by Platform (2020-2032) (USD Billion)
10.4.13.3 Rest of Asia Pacific Remote Sensing Technology Market Estimates and Forecasts, by Application (2020-2032) (USD Billion)
10.5 Middle East and Africa
10.5.1 Middle East
10.5.1.1 Trends Analysis
10.5.1.2 Middle East Remote Sensing Technology Market Estimates and Forecasts, by Country (2020-2032) (USD Billion)
10.5.1.3 Middle East Remote Sensing Technology Market Estimates and Forecasts, by Technology (2020-2032) (USD Billion)
10.5.1.4 Middle East Remote Sensing Technology Market Estimates and Forecasts, by Platform (2020-2032) (USD Billion)
10.5.1.5 Middle East Remote Sensing Technology Market Estimates and Forecasts, by Application (2020-2032) (USD Billion)
10.5.1.6 UAE
10.5.1.6.1 UAE Remote Sensing Technology Market Estimates and Forecasts, by Technology (2020-2032) (USD Billion)
10.5.1.6.2 UAE Remote Sensing Technology Market Estimates and Forecasts, by Platform (2020-2032) (USD Billion)
10.5.1.6.3 UAE Remote Sensing Technology Market Estimates and Forecasts, by Application (2020-2032) (USD Billion)
10.5.1.7 Egypt
10.5.1.7.1 Egypt Remote Sensing Technology Market Estimates and Forecasts, by Technology (2020-2032) (USD Billion)
10.5.1.7.2 Egypt Remote Sensing Technology Market Estimates and Forecasts, by Platform (2020-2032) (USD Billion)
10.5.1.7.3 Egypt Remote Sensing Technology Market Estimates and Forecasts, by Application (2020-2032) (USD Billion)
10.5.1.8 Saudi Arabia
10.5.1.8.1 Saudi Arabia Remote Sensing Technology Market Estimates and Forecasts, by Technology (2020-2032) (USD Billion)
10.5.1.8.2 Saudi Arabia Remote Sensing Technology Market Estimates and Forecasts, by Platform (2020-2032) (USD Billion)
10.5.1.8.3 Saudi Arabia Remote Sensing Technology Market Estimates and Forecasts, by Application (2020-2032) (USD Billion)
10.5.1.9 Qatar
10.5.1.9.1 Qatar Remote Sensing Technology Market Estimates and Forecasts, by Technology (2020-2032) (USD Billion)
10.5.1.9.2 Qatar Remote Sensing Technology Market Estimates and Forecasts, by Platform (2020-2032) (USD Billion)
10.5.1.9.3 Qatar Remote Sensing Technology Market Estimates and Forecasts, by Application (2020-2032) (USD Billion)
10.5.1.10 Rest of Middle East
10.5.1.10.1 Rest of Middle East Remote Sensing Technology Market Estimates and Forecasts, by Technology (2020-2032) (USD Billion)
10.5.1.10.2 Rest of Middle East Remote Sensing Technology Market Estimates and Forecasts, by Platform (2020-2032) (USD Billion)
10.5.1.10.3 Rest of Middle East Remote Sensing Technology Market Estimates and Forecasts, by Application (2020-2032) (USD Billion)
10.5.2 Africa
10.5.2.1 Trends Analysis
10.5.2.2 Africa Remote Sensing Technology Market Estimates and Forecasts, by Country (2020-2032) (USD Billion)
10.5.2.3 Africa Remote Sensing Technology Market Estimates and Forecasts, by Technology (2020-2032) (USD Billion)
10.5.2.4 Africa Remote Sensing Technology Market Estimates and Forecasts, by Platform (2020-2032) (USD Billion)
10.5.2.5 Africa Remote Sensing Technology Market Estimates and Forecasts, by Application (2020-2032) (USD Billion)
10.5.2.6 South Africa
10.5.2.6.1 South Africa Remote Sensing Technology Market Estimates and Forecasts, by Technology (2020-2032) (USD Billion)
10.5.2.6.2 South Africa Remote Sensing Technology Market Estimates and Forecasts, by Platform (2020-2032) (USD Billion)
10.5.2.6.3 South Africa Remote Sensing Technology Market Estimates and Forecasts, by Application (2020-2032) (USD Billion)
10.5.2.7 Nigeria
10.5.2.7.1 Nigeria Remote Sensing Technology Market Estimates and Forecasts, by Technology (2020-2032) (USD Billion)
10.5.2.7.2 Nigeria Remote Sensing Technology Market Estimates and Forecasts, by Platform (2020-2032) (USD Billion)
10.5.2.7.3 Nigeria Remote Sensing Technology Market Estimates and Forecasts, by Application (2020-2032) (USD Billion)
10.5.2.8 Rest of Africa
10.5.2.8.1 Rest of Africa Remote Sensing Technology Market Estimates and Forecasts, by Technology (2020-2032) (USD Billion)
10.5.2.8.2 Rest of Africa Remote Sensing Technology Market Estimates and Forecasts, by Platform (2020-2032) (USD Billion)
10.5.2.8.3 Rest of Africa Remote Sensing Technology Market Estimates and Forecasts, by Application (2020-2032) (USD Billion)
10.6 Latin America
10.6.1 Trends Analysis
10.6.2 Latin America Remote Sensing Technology Market Estimates and Forecasts, by Country (2020-2032) (USD Billion)
10.6.3 Latin America Remote Sensing Technology Market Estimates and Forecasts, by Technology (2020-2032) (USD Billion)
10.6.4 Latin America Remote Sensing Technology Market Estimates and Forecasts, by Platform (2020-2032) (USD Billion)
10.6.5 Latin America Remote Sensing Technology Market Estimates and Forecasts, by Application (2020-2032) (USD Billion)
10.6.6 Brazil
10.6.6.1 Brazil Remote Sensing Technology Market Estimates and Forecasts, by Technology (2020-2032) (USD Billion)
10.6.6.2 Brazil Remote Sensing Technology Market Estimates and Forecasts, by Platform (2020-2032) (USD Billion)
10.6.6.3 Brazil Remote Sensing Technology Market Estimates and Forecasts, by Application (2020-2032) (USD Billion)
10.6.7 Argentina
10.6.7.1 Argentina Remote Sensing Technology Market Estimates and Forecasts, by Technology (2020-2032) (USD Billion)
10.6.7.2 Argentina Remote Sensing Technology Market Estimates and Forecasts, by Platform (2020-2032) (USD Billion)
10.6.7.3 Argentina Remote Sensing Technology Market Estimates and Forecasts, by Application (2020-2032) (USD Billion)
10.6.8 Colombia
10.6.8.1 Colombia Remote Sensing Technology Market Estimates and Forecasts, by Technology (2020-2032) (USD Billion)
10.6.8.2 Colombia Remote Sensing Technology Market Estimates and Forecasts, by Platform (2020-2032) (USD Billion)
10.6.8.3 Colombia Remote Sensing Technology Market Estimates and Forecasts, by Application (2020-2032) (USD Billion)
10.6.9 Rest of Latin America
10.6.9.1 Rest of Latin America Remote Sensing Technology Market Estimates and Forecasts, by Technology (2020-2032) (USD Billion)
10.6.9.2 Rest of Latin America Remote Sensing Technology Market Estimates and Forecasts, by Platform (2020-2032) (USD Billion)
10.6.9.3 Rest of Latin America Remote Sensing Technology Market Estimates and Forecasts, by Application (2020-2032) (USD Billion)
11. Company Profiles
11.1 Maxar Technologies
11.1.1 Company Overview
11.1.2 Financial
11.1.3 Products/ Services Offered
11.1.4 SWOT Analysis
11.2 Esri
11.2.1 Company Overview
11.2.2 Financial
11.2.3 Products/ Services Offered
11.2.4 SWOT Analysis
11.3 General Dynamics Mission Systems, Inc.
11.3.1 Company Overview
11.3.2 Financial
11.3.3 Products/ Services Offered
11.3.4 SWOT Analysis
11.4 Hexagon AB
11.4.1 Company Overview
11.4.2 Financial
11.4.3 Products/ Services Offered
11.4.4 SWOT Analysis
11.5 Lockheed Martin Corporation
11.5.1 Company Overview
11.5.2 Financial
11.5.3 Products/ Services Offered
11.5.4 SWOT Analysis
11.6 Orbital Insight
11.6.1 Company Overview
11.6.2 Financial
11.6.3 Products/ Services Offered
11.6.4 SWOT Analysis
11.7 Planet Labs PBC
11.7.1 Company Overview
11.7.2 Financial
11.7.3 Products/ Services Offered
11.7.4 SWOT Analysis
11.8 Northrop Grumman Corporation
11.8.1 Company Overview
11.8.2 Financial
11.8.3 Products/ Services Offered
11.8.4 SWOT Analysis
11.9 General Dynamics Corp.
11.9.1 Company Overview
11.9.2 Financial
11.9.3 Products/ Services Offered
11.9.4 SWOT Analysis
11.10 Raytheon Corporation
11.10.1 Company Overview
11.10.2 Financial
11.10.3 Products/ Services Offered
11.10.4 SWOT Analysis
12. Use Cases and Best Practices
13. Conclusion
An accurate research report requires proper strategizing as well as implementation. There are multiple factors involved in the completion of good and accurate research report and selecting the best methodology to compete the research is the toughest part. Since the research reports we provide play a crucial role in any company’s decision-making process, therefore we at SNS Insider always believe that we should choose the best method which gives us results closer to reality. This allows us to reach at a stage wherein we can provide our clients best and accurate investment to output ratio.
Each report that we prepare takes a timeframe of 350-400 business hours for production. Starting from the selection of titles through a couple of in-depth brain storming session to the final QC process before uploading our titles on our website we dedicate around 350 working hours. The titles are selected based on their current market cap and the foreseen CAGR and growth.
The 5 steps process:
Step 1: Secondary Research:
Secondary Research or Desk Research is as the name suggests is a research process wherein, we collect data through the readily available information. In this process we use various paid and unpaid databases which our team has access to and gather data through the same. This includes examining of listed companies’ annual reports, Journals, SEC filling etc. Apart from this our team has access to various associations across the globe across different industries. Lastly, we have exchange relationships with various university as well as individual libraries.

Step 2: Primary Research
When we talk about primary research, it is a type of study in which the researchers collect relevant data samples directly, rather than relying on previously collected data. This type of research is focused on gaining content specific facts that can be sued to solve specific problems. Since the collected data is fresh and first hand therefore it makes the study more accurate and genuine.
We at SNS Insider have divided Primary Research into 2 parts.
Part 1 wherein we interview the KOLs of major players as well as the upcoming ones across various geographic regions. This allows us to have their view over the market scenario and acts as an important tool to come closer to the accurate market numbers. As many as 45 paid and unpaid primary interviews are taken from both the demand and supply side of the industry to make sure we land at an accurate judgement and analysis of the market.
This step involves the triangulation of data wherein our team analyses the interview transcripts, online survey responses and observation of on filed participants. The below mentioned chart should give a better understanding of the part 1 of the primary interview.

Part 2: In this part of primary research the data collected via secondary research and the part 1 of the primary research is validated with the interviews from individual consultants and subject matter experts.
Consultants are those set of people who have at least 12 years of experience and expertise within the industry whereas Subject Matter Experts are those with at least 15 years of experience behind their back within the same space. The data with the help of two main processes i.e., FGDs (Focused Group Discussions) and IDs (Individual Discussions). This gives us a 3rd party nonbiased primary view of the market scenario making it a more dependable one while collation of the data pointers.
Step 3: Data Bank Validation
Once all the information is collected via primary and secondary sources, we run that information for data validation. At our intelligence centre our research heads track a lot of information related to the market which includes the quarterly reports, the daily stock prices, and other relevant information. Our data bank server gets updated every fortnight and that is how the information which we collected using our primary and secondary information is revalidated in real time.

Step 4: QA/QC Process
After all the data collection and validation our team does a final level of quality check and quality assurance to get rid of any unwanted or undesired mistakes. This might include but not limited to getting rid of the any typos, duplication of numbers or missing of any important information. The people involved in this process include technical content writers, research heads and graphics people. Once this process is completed the title gets uploader on our platform for our clients to read it.
Step 5: Final QC/QA Process:
This is the last process and comes when the client has ordered the study. In this process a final QA/QC is done before the study is emailed to the client. Since we believe in giving our clients a good experience of our research studies, therefore, to make sure that we do not lack at our end in any way humanly possible we do a final round of quality check and then dispatch the study to the client.
By Technology
Active Sensing
Passive Sensing
By Platform
Satellite
Aerial Systems
By Application
Agriculture & Living Resources
Military & Intelligence
Disaster Management
Infrastructure
Weather
Others
Request for Segment Customization as per your Business Requirement: Segment Customization Request
Regional Coverage:
North America
US
Canada
Mexico
Europe
Eastern Europe
Poland
Romania
Hungary
Turkey
Rest of Eastern Europe
Western Europe
Germany
France
UK
Italy
Spain
Netherlands
Switzerland
Austria
Rest of Western Europe
Asia Pacific
China
India
Japan
South Korea
Vietnam
Singapore
Australia
Rest of Asia Pacific
Middle East & Africa
Middle East
UAE
Egypt
Saudi Arabia
Qatar
Rest of Middle East
Africa
Nigeria
South Africa
Rest of Africa
Latin America
Brazil
Argentina
Colombia
Rest of Latin America
Request for Country Level Research Report: Country Level Customization Request
Available Customization
With the given market data, SNS Insider offers customization as per the company’s specific needs. The following customization options are available for the report:
Detailed Volume Analysis
Criss-Cross segment analysis (e.g. Product X Application)
Competitive Product Benchmarking
Geographic Analysis
Additional countries in any of the regions
Customized Data Representation
Detailed analysis and profiling of additional market players
The Rugged Servers Market Size was valued at USD 614.3 million in 2023 and is expected to reach USD994.6 Million by 2032 and grow at a CAGR of 5.5% over the forecast period 2024-2032.
The Smart Greenhouse Market Size was valued at USD 1.91 Billion in 2023 and is expected to grow at a CAGR of 9.72% to reach USD 4.39 Billion by 2032.
The Amplifiers Market Size was valued at USD 29.75 billion in 2023 and is expected to grow at a CAGR of 7.2%, reaching USD 55.62 billion by 2032.
The Full-body Scanners Market Size was valued at USD 351.23 million in 2023 and is expected to reach USD 973.9 million by 2032, growing at a CAGR of 12% over the forecast period 2024-2032.
The 5G mm-Wave Technology Market Size was USD 3.04 billion in 2023 and will reach USD 10.49 Billion by 2032, growing at a CAGR of 14.77% from 2024-2032.
The Baggage Handling System Market size was valued at USD 10.57billion in 2023 and is expected to grow to USD 18.92 billion by 2032 and grow at a CAGR of 6.68% over the forecast period of 2024-2032

Hi! Click one of our member below to chat on Phone
© 2025 All Rights Reserved by SNS Insider Pvt Ltd


