image

Regenerative Agriculture Market Report Scope & Overview:

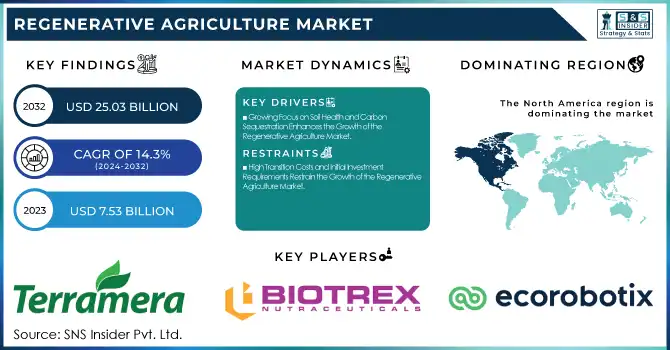
The Regenerative Agriculture Market Size was valued at USD 7.53 Billion in 2023 and is expected to reach USD 25.03 Billion by 2032 and grow at a CAGR of 14.3% over the forecast period 2024-2032. Regenerative agriculture is emerging as a sustainable alternative to conventional farming, emphasizing soil health, biodiversity, and carbon sequestration. Techniques like cover cropping, reduced tillage, and agroforestry boost productivity while mitigating climate change. Increasing consumer demand, government incentives, and corporate sustainability commitments are driving adoption. Farms using regenerative methods report improved soil carbon sequestration and up to 30% higher water efficiency. Investments in soil health, carbon markets, and digital monitoring are rising. Despite challenges like transition costs and measurement standardization, regenerative agriculture offers long-term benefits for food security and climate resilience, with market growth expected to accelerate.

Market Dynamics

Key Drivers:

  • Growing Focus on Soil Health and Carbon Sequestration Enhances the Growth of the Regenerative Agriculture Market

The increasing emphasis on soil health and carbon sequestration is a key driver of the regenerative agriculture market. Governments, corporations, and farmers recognize the urgent need to restore soil fertility and combat climate change by adopting sustainable agricultural practices. Regenerative farming techniques such as cover cropping, agroforestry, and rotational grazing enhance soil organic matter, improve microbial activity, and increase carbon sequestration, thereby reducing greenhouse gas emissions. Additionally, consumer awareness of sustainable food production has surged, leading food companies to integrate regenerative sourcing into their supply chains.

Financial incentives and policy frameworks are also driving adoption, with governments offering subsidies for sustainable farming initiatives. The integration of digital tools, including soil monitoring and carbon credit platforms, further encourages farmers to transition. As soil degradation threatens long-term agricultural productivity, regenerative practices provide a viable solution for maintaining yield stability while ensuring environmental sustainability. With global food security concerns rising and climate change mitigation becoming a priority, the demand for regenerative agriculture continues to expand, positioning it as a vital approach to the future of farming.

Restrain:

  • High Transition Costs and Initial Investment Requirements Restrain the Growth of the Regenerative Agriculture Market

One of the primary restraints limiting the widespread adoption of regenerative agriculture is the high transition costs and upfront investment required. Shifting from conventional to regenerative farming involves significant changes in land management, requiring farmers to invest in soil regeneration practices, diverse crop rotations, and alternative pest management techniques. These transitions often demand new equipment, training, and technical expertise, which can be financially burdensome, especially for small and mid-sized farms. Furthermore, the return on investment is not immediate, as soil health improvements and increased productivity may take several years to materialize. Farmers may also face challenges accessing financial support, as traditional agricultural financing structures favor conventional farming methods.

Additionally, market volatility, fluctuating commodity prices, and the unpredictability of weather conditions create further hesitation among farmers considering the shift. While government subsidies and private investments are increasing, financial barriers remain a significant deterrent, slowing the overall growth of regenerative agriculture. Addressing these economic constraints through better incentives, risk-sharing mechanisms, and accessible funding programs is crucial to accelerating adoption.

Opportunities:

  • Expansion of Carbon Credit Programs Creates New Revenue Opportunities for the Regenerative Agriculture Market

The rising adoption of carbon credit programs presents a significant opportunity for the regenerative agriculture market. As corporations seek to offset their carbon footprint, carbon credit markets are expanding, offering financial incentives to farmers who implement regenerative practices that enhance soil carbon sequestration. Companies such as Indigo Ag and Nori have introduced platforms that allow farmers to earn carbon credits by quantifying their soil’s carbon storage capacity. This creates a dual benefit—farmers can monetize sustainable farming practices while corporations meet their sustainability targets.

Additionally, as climate policies become more stringent, demand for high-quality carbon offsets will rise, further boosting participation. However, ensuring accurate measurement, verification, and standardization of carbon sequestration remains a challenge. If addressed effectively, carbon credit programs could become a transformative financial mechanism, accelerating the adoption of regenerative agriculture globally. With growing corporate interest and regulatory backing, this opportunity has the potential to drive substantial market growth in the coming years.

Challenge:

  • Lack of Standardized Metrics and Certification Systems Hampers the Growth of the Regenerative Agriculture Market

A significant challenge facing the regenerative agriculture market is the lack of standardized metrics and certification systems to define and verify regenerative practices. Unlike organic farming, which has well-established global certification standards, regenerative agriculture lacks a universally accepted framework to measure its impact on soil health, biodiversity, and carbon sequestration. This inconsistency creates confusion among farmers, businesses, and consumers, making it difficult to establish trust in regenerative products.

Additionally, major food and agriculture corporations seeking to integrate regenerative sourcing into their supply chains struggle to ensure compliance due to varying definitions across markets. Efforts are being made by organizations such as Regenerative Organic Certified (ROC) and Soil Health Institute to develop structured certification programs, but widespread adoption remains slow. Without a unified approach, scalability becomes difficult, and farmers may hesitate to invest in regenerative transitions due to the uncertainty surrounding long-term recognition and financial benefits. Addressing this challenge through clear, science-based measurement frameworks and global certification standards is crucial to ensuring credibility and fostering trust in the regenerative agriculture market.

Segments Analysis

By Type

Agroforestry, integrating trees and shrubs into agricultural landscapes, accounted for the largest revenue share in the regenerative agriculture market in 2023, holding 23% of total market revenue. This practice enhances soil fertility, improves water retention, and increases biodiversity, making it a key driver of sustainable farming. Nestlé and Danone have invested in agroforestry projects to support sustainable cocoa and coffee production, ensuring long-term soil health and carbon sequestration.

In 2023, Nestlé expanded its agroforestry initiative by planting millions of shade trees in cocoa-growing regions, enhancing carbon capture while stabilizing yields. Similarly, Danone has collaborated with local farmers to implement tree-planting programs in dairy supply chains, reducing soil degradation and improving forage availability.

Aquaculture and ocean farming are emerging as the fastest-growing segments within regenerative agriculture, expanding at a CAGR of 16.22% over the forecast period. Regenerative ocean farming integrates seaweed and shellfish cultivation to restore marine ecosystems, improve biodiversity, and absorb excess carbon and nitrogen from the water. Leading companies are investing heavily in this segment to develop sustainable seafood production while enhancing ocean health.

In 2023, Patagonia Provisions expanded its regenerative ocean farming projects, launching new kelp-based food products to promote sustainable marine agriculture. Similarly, Cargill partnered with aquaculture innovators to develop sustainable fish feed derived from seaweed and alternative proteins, reducing the industry’s reliance on wild fish stocks.

By End-User

Service organizations, including agribusiness consultancies, sustainability-focused NGOs, and ag-tech firms, dominated the regenerative agriculture market in 2023 with a 32% revenue share. These organizations provide crucial services such as soil health assessment, carbon credit certification, farm advisory programs, and digital monitoring platforms that help farmers transition to regenerative practices. Companies like Indigo Ag and Continuum Ag have expanded their service offerings, providing data-driven insights to improve soil carbon sequestration and optimize regenerative practices.

Additionally, global food corporations, including Nestlé and General Mills, have collaborated with service organizations to implement large-scale regenerative agriculture initiatives, ensuring supply chain sustainability. The increasing demand for carbon tracking, precision farming, and sustainability consulting has propelled the growth of this segment.

Farmers are the fastest-growing end-user segment in the regenerative agriculture market, adopting sustainable practices at an accelerating rate due to rising demand for climate-resilient farming and financial incentives. With growing consumer awareness and corporate commitments to sustainable sourcing, farmers are increasingly shifting to regenerative methods such as cover cropping, no-till farming, and integrated livestock management. With government subsidies, corporate funding, and new revenue streams from carbon markets, farmers are at the forefront of regenerative agriculture expansion, driving long-term sustainability and reshaping the global agricultural landscape.

By Component

The Solutions Organization segment led the regenerative agriculture market in 2023, accounting for 62% of total revenue, driven by the rising demand for innovative products that enhance soil health, carbon sequestration, and sustainable farming practices. Solutions in this segment include biological inputs, digital agriculture platforms, regenerative seed varieties, and soil health enhancers.

In 2023, Terramera launched a new bio-based soil amendment designed to enhance carbon sequestration and nutrient efficiency, reducing reliance on synthetic fertilizers. Similarly, Indigo Ag expanded its microbial seed treatment portfolio, enabling farmers to improve soil resilience and crop productivity.

The Services segment is experiencing the fastest CAGR in the regenerative agriculture market, driven by the growing need for farm advisory, carbon credit verification, soil health assessment, and digital precision farming support. As more farmers and agribusinesses transition to regenerative practices, service providers play a crucial role in guiding adoption, ensuring compliance with sustainability standards, and optimizing farming strategies.

In 2023, Continuum Ag introduced a digital soil health platform that helps farmers track carbon sequestration improvements and connect with carbon credit markets, increasing their revenue potential. Meanwhile, Agreena launched a farmer-centric carbon program that streamlines credit verification and trade, making carbon markets more accessible.
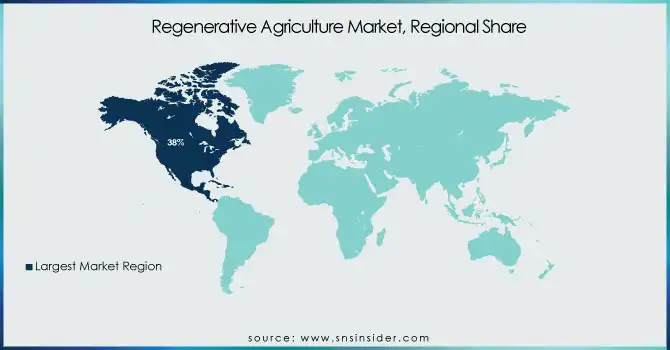
Regional Analysis

North America led the regenerative agriculture market in 2023, accounting for an estimated 38% market share, driven by strong corporate commitments, government support, and advanced agricultural technologies. The U.S. and Canada have witnessed increased adoption of regenerative farming practices, supported by major agribusinesses and food companies integrating sustainability into their supply chains. General Mills, Cargill, and Danone have launched large-scale regenerative agriculture initiatives aimed at improving soil health and reducing carbon emissions.

For example, General Mills expanded its regenerative farming program in partnership with wheat and oat farmers, focusing on soil carbon sequestration. Similarly, Cargill invested in soil health projects, helping North American farmers transition to regenerative practices through financial incentives and training programs.

The Asia Pacific region is the fastest-growing in the regenerative agriculture market, expanding at an estimated CAGR of 17.5%, fueled by rising government initiatives, corporate investments, and the urgent need to combat soil degradation and climate change. Countries such as India, China, Australia, and Indonesia are rapidly adopting regenerative practices to enhance food security and restore degraded farmland. The Indian government has introduced incentives to promote natural and organic farming, supporting millions of smallholder farmers in shifting towards regenerative techniques like cover cropping, agroforestry, and no-till farming.

Australia, known for its innovative farming techniques, has seen agribusinesses like Grounded and Soil Capital expanding operations, offering regenerative solutions to farmers. With increasing awareness, government subsidies, and corporate sustainability goals, Asia Pacific is emerging as a key player in the regenerative agriculture movement, driving its fastest growth globally.

Key Players

Some of the major players in the Regenerative Agriculture Market are:

  • Vayda

  • Terramera Inc.

  • Agreed.Earth

  • Biotrex

  • Ecorobotix SA

  • Ruumi

  • Continuum Ag

  • Aker Technologies, Inc.

  • Indigo Ag, Inc.

  • Tortuga Agricultural Technologies, Inc.

  • Astanor Ventures

  • SATELLIGENCE

  • Nestle SA

  • Danone SA

  • General Mills, Inc

  • Cargill Incorporated

  • Unilever PLC

  • Grounded

  • Soil Capital Belgium SPRL

Recent Trends

  • In May 2024, Vayda, a regenerative farming startup established in 2020 with support from Ontario Teachers' venture studio, Koru, and Goldcrest partners, aimed to facilitate farmers' transition to sustainable agriculture by mitigating associated risks.

  • In January 2023, enrichAg, a subsidiary of Canadian crop protection company Terramera, officially launched with a USD 6 million seed investment led by At One Ventures. The company introduced a novel soil testing and analysis platform designed to enable farmers and agronomists to conduct their soil assessments, potentially reducing fertilizer costs and enhancing opportunities in carbon markets.

Regenerative Agriculture Market Report Scope:

Report Attributes Details
Market Size in 2023 USD 7.53 Billion
Market Size by 2032 USD 25.03 Billion
CAGR CAGR of 14.3% From 2024 to 2032
Base Year 2023
Forecast Period 2024-2032
Historical Data 2020-2022
Report Scope & Coverage Market Size, Segments Analysis, Competitive  Landscape, Regional Analysis, DROC & SWOT Analysis, Forecast Outlook
Key Segments • By Component (Solutions, Services)
• By Type (Agroforestry, Silvopasture, Aquaculture/Ocean Farming, No-Till and Pasture Cropping, Holistically Managed Grazing, Biochar, Others)
• By End-User (Farmers, Service Organizations, Financial Institutions, Advisory Bodies, Consumer Packaged Goods Manufacturers)
Regional Analysis/Coverage North America (US, Canada, Mexico), Europe (Eastern Europe [Poland, Romania, Hungary, Turkey, Rest of Eastern Europe] Western Europe] Germany, France, UK, Italy, Spain, Netherlands, Switzerland, Austria, Rest of Western Europe]), Asia Pacific (China, India, Japan, South Korea, Vietnam, Singapore, Australia, Rest of Asia Pacific), Middle East & Africa (Middle East [UAE, Egypt, Saudi Arabia, Qatar, Rest of Middle East], Africa [Nigeria, South Africa, Rest of Africa], Latin America (Brazil, Argentina, Colombia, Rest of Latin America)
Company Profiles Vayda, Terramera Inc., Agreed.Earth, Biotrex, Ecorobotix SA, Ruumi, Continuum Ag, Aker Technologies, Inc., Indigo Ag, Inc., Tortuga Agricultural Technologies, Inc., Astanor Ventures, SATELLIGENCE, Nestle SA, Danone SA, General Mills, Inc, Cargill Incorporated, Unilever PLC, Grounded, Soil Capital Belgium SPRL

Frequently Asked Questions

Ans: The Regenerative Agriculture Market is expected to grow at a CAGR of 14.3% during 2024-2032.

Ans: The Regenerative Agriculture Market size was USD 7.53 billion in 2023 and is expected to Reach USD 25.03 billion by 2032.

Ans: The major growth factor of the regenerative agriculture market is the increasing adoption of sustainable farming practices driven by soil health improvement, carbon sequestration, and corporate sustainability commitments.

Ans: The service Organization segment dominated the Regenerative Agriculture Market.

Ans: North America dominated the Regenerative Agriculture Market in 2023.

Table of Contents

1. Introduction

1.1 Market Definition

1.2 Scope (Inclusion and Exclusions)

1.3 Research Assumptions

2. Executive Summary

2.1 Market Overview

2.2 Regional Synopsis

2.3 Competitive Summary

3. Research Methodology

3.1 Top-Down Approach

3.2 Bottom-up Approach

3.3. Data Validation

3.4 Primary Interviews

4. Market Dynamics Impact Analysis

4.1 Market Driving Factors Analysis

4.1.1 Drivers

4.1.2 Restraints

4.1.3 Opportunities

4.1.4 Challenges

4.2 PESTLE Analysis

4.3 Porter’s Five Forces Model

5. Statistical Insights and Trends Reporting

5.1 Carbon Sequestration Potential (2023)

5.2 Reduction in Chemical Inputs

5.3 Water Efficiency Improvement (2023)

5.4 Government & Private Investments (2023)

5.5 Certified Regenerative Farmland Area (2023)

6. Competitive Landscape

6.1 List of Major Companies, By Region

6.2 Market Share Analysis, By Region

6.3 Product Benchmarking

6.3.1 Product specifications and features

6.3.2 Pricing

6.4 Strategic Initiatives

6.4.1 Marketing and promotional activities

6.4.2 Distribution and Supply Chain Strategies

6.4.3 Expansion plans and new product launches

6.4.4 Strategic partnerships and collaborations

6.5 Technological Advancements

6.6 Market Positioning and Branding

7. Regenerative Agriculture Market Segmentation, By End-User

7.1 Chapter Overview

7.2 Farmers

7.2.1 Farmers Market Trends Analysis (2020-2032)

7.2.2 Farmers Market Size Estimates and Forecasts to 2032 (USD Billion)

7.3 Service Organization

7.3.1 Service Organization Market Trends Analysis (2020-2032)

7.3.2 Service Organization Market Size Estimates and Forecasts to 2032 (USD Billion)

7.4 Financial Institutions

7.4.1 Financial Institutions Market Trends Analysis (2020-2032)

7.4.2 Financial Institutions Market Size Estimates and Forecasts to 2032 (USD Billion)

7.5 Advisory Bodies

7.5.1 Advisory Bodies Market Trends Analysis (2020-2032)

7.5.2 Advisory Bodies Market Size Estimates and Forecasts to 2032 (USD Billion)

7.6 Consumer Packaged Goods Manufacturers

7.6.1 Consumer Packaged Goods Manufacturers Market Trends Analysis (2020-2032)

7.6.2 Consumer Packaged Goods Manufacturers Market Size Estimates and Forecasts to 2032 (USD Billion)

8. Regenerative Agriculture Market Segmentation, By Type

8.1 Chapter Overview

8.2 Agroforestry

8.2.1 Agroforestry Market Trends Analysis (2020-2032)

8.2.2 Agroforestry Market Size Estimates and Forecasts to 2032 (USD Billion)

8.3 Silvopasture

8.3.1 Silvopasture Market Trends Analysis (2020-2032)

8.3.2 Silvopasture Market Size Estimates and Forecasts to 2032 (USD Billion)

8.4 Aquaculture/Ocean Farming

8.4.1 Aquaculture/Ocean Farming Market Trends Analysis (2020-2032)

8.4.2 Aquaculture/Ocean Farming Market Size Estimates and Forecasts to 2032 (USD Billion)

8.5 No-Till and Pasture Cropping

8.5.1 No-Till and Pasture Cropping Market Trends Analysis (2020-2032)

8.5.2 No-Till and Pasture Cropping Market Size Estimates and Forecasts to 2032 (USD Billion)

8.6 Holistically Managed Grazing

8.6.1 Holistically Managed Grazing Market Trends Analysis (2020-2032)

8.6.2 Holistically Managed Grazing Market Size Estimates and Forecasts to 2032 (USD Billion)

8.7 Biochar

8.7.1 Biochar Market Trends Analysis (2020-2032)

8.7.2 Biochar Market Size Estimates and Forecasts to 2032 (USD Billion)

8.8 Others

8.8.1 Others Market Trends Analysis (2020-2032)

8.8.2 Others Market Size Estimates and Forecasts to 2032 (USD Billion)

9. Regenerative Agriculture Market Segmentation, By Component

9.1 Chapter Overview

9.2 Solutions

9.2.1 Solutions Market Trends Analysis (2020-2032)

9.2.2 Solutions Market Size Estimates and Forecasts to 2032 (USD Billion)

9.3 Services

9.3.1 Services Market Trends Analysis (2020-2032)

9.3.2 Services Market Size Estimates and Forecasts to 2032 (USD Billion)

10. Regional Analysis

10.1 Chapter Overview

10.2 North America

10.2.1 Trends Analysis

10.2.2 North America Regenerative Agriculture Market Estimates and Forecasts, by Country (2020-2032) (USD Billion)

10.2.3 North America Regenerative Agriculture Market Estimates and Forecasts, By End-User (2020-2032) (USD Billion) 

10.2.4 North America Regenerative Agriculture Market Estimates and Forecasts, By Type (2020-2032) (USD Billion)

10.2.5 North America Regenerative Agriculture Market Estimates and Forecasts, By Component (2020-2032) (USD Billion)

10.2.6 USA

10.2.6.1 USA Regenerative Agriculture Market Estimates and Forecasts, By End-User (2020-2032) (USD Billion)

10.2.6.2 USA Regenerative Agriculture Market Estimates and Forecasts, By Type (2020-2032) (USD Billion)

10.2.6.3 USA Regenerative Agriculture Market Estimates and Forecasts, By Component (2020-2032) (USD Billion)

10.2.7 Canada

10.2.7.1 Canada Regenerative Agriculture Market Estimates and Forecasts, By End-User (2020-2032) (USD Billion)

10.2.7.2 Canada Regenerative Agriculture Market Estimates and Forecasts, By Type (2020-2032) (USD Billion)

10.2.7.3 Canada Regenerative Agriculture Market Estimates and Forecasts, By Component (2020-2032) (USD Billion)

10.2.8 Mexico

10.2.8.1 Mexico Regenerative Agriculture Market Estimates and Forecasts, By End-User (2020-2032) (USD Billion)

10.2.8.2 Mexico Regenerative Agriculture Market Estimates and Forecasts, By Type (2020-2032) (USD Billion)

10.2.8.3 Mexico Regenerative Agriculture Market Estimates and Forecasts, By Component (2020-2032) (USD Billion)

10.3 Europe

10.3.1 Eastern Europe

10.3.1.1 Trends Analysis

10.3.1.2 Eastern Europe Regenerative Agriculture Market Estimates and Forecasts, by Country (2020-2032) (USD Billion)

10.3.1.3 Eastern Europe Regenerative Agriculture Market Estimates and Forecasts, By End-User (2020-2032) (USD Billion) 

10.3.1.4 Eastern Europe Regenerative Agriculture Market Estimates and Forecasts, By Type (2020-2032) (USD Billion)

10.3.1.5 Eastern Europe Regenerative Agriculture Market Estimates and Forecasts, By Component (2020-2032) (USD Billion)

10.3.1.6 Poland

10.3.1.6.1 Poland Regenerative Agriculture Market Estimates and Forecasts, By End-User (2020-2032) (USD Billion)

10.3.1.6.2 Poland Regenerative Agriculture Market Estimates and Forecasts, By Type (2020-2032) (USD Billion)

10.3.1.6.3 Poland Regenerative Agriculture Market Estimates and Forecasts, By Component (2020-2032) (USD Billion)

10.3.1.7 Romania

10.3.1.7.1 Romania Regenerative Agriculture Market Estimates and Forecasts, By End-User (2020-2032) (USD Billion)

10.3.1.7.2 Romania Regenerative Agriculture Market Estimates and Forecasts, By Type (2020-2032) (USD Billion)

10.3.1.7.3 Romania Regenerative Agriculture Market Estimates and Forecasts, By Component (2020-2032) (USD Billion)

10.3.1.8 Hungary

10.3.1.8.1 Hungary Regenerative Agriculture Market Estimates and Forecasts, By End-User (2020-2032) (USD Billion)

10.3.1.8.2 Hungary Regenerative Agriculture Market Estimates and Forecasts, By Type (2020-2032) (USD Billion)

10.3.1.8.3 Hungary Regenerative Agriculture Market Estimates and Forecasts, By Component (2020-2032) (USD Billion)

10.3.1.9 Turkey

10.3.1.9.1 Turkey Regenerative Agriculture Market Estimates and Forecasts, By End-User (2020-2032) (USD Billion)

10.3.1.9.2 Turkey Regenerative Agriculture Market Estimates and Forecasts, By Type (2020-2032) (USD Billion)

10.3.1.9.3 Turkey Regenerative Agriculture Market Estimates and Forecasts, By Component (2020-2032) (USD Billion)

10.3.1.10 Rest of Eastern Europe

10.3.1.10.1 Rest of Eastern Europe Regenerative Agriculture Market Estimates and Forecasts, By End-User (2020-2032) (USD Billion)

10.3.1.10.2 Rest of Eastern Europe Regenerative Agriculture Market Estimates and Forecasts, By Type (2020-2032) (USD Billion)

10.3.1.10.3 Rest of Eastern Europe Regenerative Agriculture Market Estimates and Forecasts, By Component (2020-2032) (USD Billion)

10.3.2 Western Europe

10.3.2.1 Trends Analysis

10.3.2.2 Western Europe Regenerative Agriculture Market Estimates and Forecasts, by Country (2020-2032) (USD Billion)

10.3.2.3 Western Europe Regenerative Agriculture Market Estimates and Forecasts, By End-User (2020-2032) (USD Billion) 

10.3.2.4 Western Europe Regenerative Agriculture Market Estimates and Forecasts, By Type (2020-2032) (USD Billion)

10.3.2.5 Western Europe Regenerative Agriculture Market Estimates and Forecasts, By Component (2020-2032) (USD Billion)

10.3.2.6 Germany

10.3.2.6.1 Germany Regenerative Agriculture Market Estimates and Forecasts, By End-User (2020-2032) (USD Billion)

10.3.2.6.2 Germany Regenerative Agriculture Market Estimates and Forecasts, By Type (2020-2032) (USD Billion)

10.3.2.6.3 Germany Regenerative Agriculture Market Estimates and Forecasts, By Component (2020-2032) (USD Billion)

10.3.2.7 France

10.3.2.7.1 France Regenerative Agriculture Market Estimates and Forecasts, By End-User (2020-2032) (USD Billion)

10.3.2.7.2 France Regenerative Agriculture Market Estimates and Forecasts, By Type (2020-2032) (USD Billion)

10.3.2.7.3 France Regenerative Agriculture Market Estimates and Forecasts, By Component (2020-2032) (USD Billion)

10.3.2.8 UK

10.3.2.8.1 UK Regenerative Agriculture Market Estimates and Forecasts, By End-User (2020-2032) (USD Billion)

10.3.2.8.2 UK Regenerative Agriculture Market Estimates and Forecasts, By Type (2020-2032) (USD Billion)

10.3.2.8.3 UK Regenerative Agriculture Market Estimates and Forecasts, By Component (2020-2032) (USD Billion)

10.3.2.9 Italy

10.3.2.9.1 Italy Regenerative Agriculture Market Estimates and Forecasts, By End-User (2020-2032) (USD Billion)

10.3.2.9.2 Italy Regenerative Agriculture Market Estimates and Forecasts, By Type (2020-2032) (USD Billion)

10.3.2.9.3 Italy Regenerative Agriculture Market Estimates and Forecasts, By Component (2020-2032) (USD Billion)

10.3.2.10 Spain

10.3.2.10.1 Spain Regenerative Agriculture Market Estimates and Forecasts, By End-User (2020-2032) (USD Billion)

10.3.2.10.2 Spain Regenerative Agriculture Market Estimates and Forecasts, By Type (2020-2032) (USD Billion)

10.3.2.10.3 Spain Regenerative Agriculture Market Estimates and Forecasts, By Component (2020-2032) (USD Billion)

10.3.2.11 Netherlands

10.3.2.11.1 Netherlands Regenerative Agriculture Market Estimates and Forecasts, By End-User (2020-2032) (USD Billion)

10.3.2.11.2 Netherlands Regenerative Agriculture Market Estimates and Forecasts, By Type (2020-2032) (USD Billion)

10.3.2.11.3 Netherlands Regenerative Agriculture Market Estimates and Forecasts, By Component (2020-2032) (USD Billion)

10.3.2.12 Switzerland

10.3.2.12.1 Switzerland Regenerative Agriculture Market Estimates and Forecasts, By End-User (2020-2032) (USD Billion)

10.3.2.12.2 Switzerland Regenerative Agriculture Market Estimates and Forecasts, By Type (2020-2032) (USD Billion)

10.3.2.12.3 Switzerland Regenerative Agriculture Market Estimates and Forecasts, By Component (2020-2032) (USD Billion)

10.3.2.13 Austria

10.3.2.13.1 Austria Regenerative Agriculture Market Estimates and Forecasts, By End-User (2020-2032) (USD Billion)

10.3.2.13.2 Austria Regenerative Agriculture Market Estimates and Forecasts, By Type (2020-2032) (USD Billion)

10.3.2.13.3 Austria Regenerative Agriculture Market Estimates and Forecasts, By Component (2020-2032) (USD Billion)

10.3.2.14 Rest of Western Europe

10.3.2.14.1 Rest of Western Europe Regenerative Agriculture Market Estimates and Forecasts, By End-User (2020-2032) (USD Billion)

10.3.2.14.2 Rest of Western Europe Regenerative Agriculture Market Estimates and Forecasts, By Type (2020-2032) (USD Billion)

10.3.2.14.3 Rest of Western Europe Regenerative Agriculture Market Estimates and Forecasts, By Component (2020-2032) (USD Billion)

10.4 Asia Pacific

10.4.1 Trends Analysis

10.4.2 Asia Pacific Regenerative Agriculture Market Estimates and Forecasts, by Country (2020-2032) (USD Billion)

10.4.3 Asia Pacific Regenerative Agriculture Market Estimates and Forecasts, By End-User (2020-2032) (USD Billion) 

10.4.4 Asia Pacific Regenerative Agriculture Market Estimates and Forecasts, By Type (2020-2032) (USD Billion)

10.4.5 Asia Pacific Regenerative Agriculture Market Estimates and Forecasts, By Component (2020-2032) (USD Billion)

10.4.6 China

10.4.6.1 China Regenerative Agriculture Market Estimates and Forecasts, By End-User (2020-2032) (USD Billion)

10.4.6.2 China Regenerative Agriculture Market Estimates and Forecasts, By Type (2020-2032) (USD Billion)

10.4.6.3 China Regenerative Agriculture Market Estimates and Forecasts, By Component (2020-2032) (USD Billion)

10.4.7 India

10.4.7.1 India Regenerative Agriculture Market Estimates and Forecasts, By End-User (2020-2032) (USD Billion)

10.4.7.2 India Regenerative Agriculture Market Estimates and Forecasts, By Type (2020-2032) (USD Billion)

10.4.7.3 India Regenerative Agriculture Market Estimates and Forecasts, By Component (2020-2032) (USD Billion)

10.4.8 Japan

10.4.8.1 Japan Regenerative Agriculture Market Estimates and Forecasts, By End-User (2020-2032) (USD Billion)

10.4.8.2 Japan Regenerative Agriculture Market Estimates and Forecasts, By Type (2020-2032) (USD Billion)

10.4.8.3 Japan Regenerative Agriculture Market Estimates and Forecasts, By Component (2020-2032) (USD Billion)

10.4.9 South Korea

10.4.9.1 South Korea Regenerative Agriculture Market Estimates and Forecasts, By End-User (2020-2032) (USD Billion)

10.4.9.2 South Korea Regenerative Agriculture Market Estimates and Forecasts, By Type (2020-2032) (USD Billion)

10.4.9.3 South Korea Regenerative Agriculture Market Estimates and Forecasts, By Component (2020-2032) (USD Billion)

10.4.10 Vietnam

10.4.10.1 Vietnam Regenerative Agriculture Market Estimates and Forecasts, By End-User (2020-2032) (USD Billion)

10.4.10.2 Vietnam Regenerative Agriculture Market Estimates and Forecasts, By Type (2020-2032) (USD Billion)

10.4.10.3 Vietnam Regenerative Agriculture Market Estimates and Forecasts, By Component (2020-2032) (USD Billion)

10.4.11 Singapore

10.4.11.1 Singapore Regenerative Agriculture Market Estimates and Forecasts, By End-User (2020-2032) (USD Billion)

10.4.11.2 Singapore Regenerative Agriculture Market Estimates and Forecasts, By Type (2020-2032) (USD Billion)

10.4.11.3 Singapore Regenerative Agriculture Market Estimates and Forecasts, By Component (2020-2032) (USD Billion)

10.4.12 Australia

10.4.12.1 Australia Regenerative Agriculture Market Estimates and Forecasts, By End-User (2020-2032) (USD Billion)

10.4.12.2 Australia Regenerative Agriculture Market Estimates and Forecasts, By Type (2020-2032) (USD Billion)

10.4.12.3 Australia Regenerative Agriculture Market Estimates and Forecasts, By Component (2020-2032) (USD Billion)

10.4.13 Rest of Asia Pacific

10.4.13.1 Rest of Asia Pacific Regenerative Agriculture Market Estimates and Forecasts, By End-User (2020-2032) (USD Billion)

10.4.13.2 Rest of Asia Pacific Regenerative Agriculture Market Estimates and Forecasts, By Type (2020-2032) (USD Billion)

10.4.13.3 Rest of Asia Pacific Regenerative Agriculture Market Estimates and Forecasts, By Component (2020-2032) (USD Billion)

10.5 Middle East and Africa

10.5.1 Middle East

10.5.1.1 Trends Analysis

10.5.1.2 Middle East Regenerative Agriculture Market Estimates and Forecasts, by Country (2020-2032) (USD Billion)

10.5.1.3 Middle East Regenerative Agriculture Market Estimates and Forecasts, By End-User (2020-2032) (USD Billion) 

10.5.1.4 Middle East Regenerative Agriculture Market Estimates and Forecasts, By Type (2020-2032) (USD Billion)

10.5.1.5 Middle East Regenerative Agriculture Market Estimates and Forecasts, By Component (2020-2032) (USD Billion)

10.5.1.6 UAE

10.5.1.6.1 UAE Regenerative Agriculture Market Estimates and Forecasts, By End-User (2020-2032) (USD Billion)

10.5.1.6.2 UAE Regenerative Agriculture Market Estimates and Forecasts, By Type (2020-2032) (USD Billion)

10.5.1.6.3 UAE Regenerative Agriculture Market Estimates and Forecasts, By Component (2020-2032) (USD Billion)

10.5.1.7 Egypt

10.5.1.7.1 Egypt Regenerative Agriculture Market Estimates and Forecasts, By End-User (2020-2032) (USD Billion)

10.5.1.7.2 Egypt Regenerative Agriculture Market Estimates and Forecasts, By Type (2020-2032) (USD Billion)

10.5.1.7.3 Egypt Regenerative Agriculture Market Estimates and Forecasts, By Component (2020-2032) (USD Billion)

10.5.1.8 Saudi Arabia

10.5.1.8.1 Saudi Arabia Regenerative Agriculture Market Estimates and Forecasts, By End-User (2020-2032) (USD Billion)

10.5.1.8.2 Saudi Arabia Regenerative Agriculture Market Estimates and Forecasts, By Type (2020-2032) (USD Billion)

10.5.1.8.3 Saudi Arabia Regenerative Agriculture Market Estimates and Forecasts, By Component (2020-2032) (USD Billion)

10.5.1.9 Qatar

10.5.1.9.1 Qatar Regenerative Agriculture Market Estimates and Forecasts, By End-User (2020-2032) (USD Billion)

10.5.1.9.2 Qatar Regenerative Agriculture Market Estimates and Forecasts, By Type (2020-2032) (USD Billion)

10.5.1.9.3 Qatar Regenerative Agriculture Market Estimates and Forecasts, By Component (2020-2032) (USD Billion)

10.5.1.10 Rest of Middle East

10.5.1.10.1 Rest of Middle East Regenerative Agriculture Market Estimates and Forecasts, By End-User (2020-2032) (USD Billion)

10.5.1.10.2 Rest of Middle East Regenerative Agriculture Market Estimates and Forecasts, By Type (2020-2032) (USD Billion)

10.5.1.10.3 Rest of Middle East Regenerative Agriculture Market Estimates and Forecasts, By Component (2020-2032) (USD Billion)

10.5.2 Africa

10.5.2.1 Trends Analysis

10.5.2.2 Africa Regenerative Agriculture Market Estimates and Forecasts, by Country (2020-2032) (USD Billion)

10.5.2.3 Africa Regenerative Agriculture Market Estimates and Forecasts, By End-User (2020-2032) (USD Billion) 

10.5.2.4 Africa Regenerative Agriculture Market Estimates and Forecasts, By Type (2020-2032) (USD Billion)

10.5.2.5 Africa Regenerative Agriculture Market Estimates and Forecasts, By Component (2020-2032) (USD Billion)

10.5.2.6 South Africa

10.5.2.6.1 South Africa Regenerative Agriculture Market Estimates and Forecasts, By End-User (2020-2032) (USD Billion)

10.5.2.6.2 South Africa Regenerative Agriculture Market Estimates and Forecasts, By Type (2020-2032) (USD Billion)

10.5.2.6.3 South Africa Regenerative Agriculture Market Estimates and Forecasts, By Component (2020-2032) (USD Billion)

10.5.2.7 Nigeria

10.5.2.7.1 Nigeria Regenerative Agriculture Market Estimates and Forecasts, By End-User (2020-2032) (USD Billion)

10.5.2.7.2 Nigeria Regenerative Agriculture Market Estimates and Forecasts, By Type (2020-2032) (USD Billion)

10.5.2.7.3 Nigeria Regenerative Agriculture Market Estimates and Forecasts, By Component (2020-2032) (USD Billion)

10.5.2.8 Rest of Africa

10.5.2.8.1 Rest of Africa Regenerative Agriculture Market Estimates and Forecasts, By End-User (2020-2032) (USD Billion)

10.5.2.8.2 Rest of Africa Regenerative Agriculture Market Estimates and Forecasts, By Type (2020-2032) (USD Billion)

10.5.2.8.3 Rest of Africa Regenerative Agriculture Market Estimates and Forecasts, By Component (2020-2032) (USD Billion)

10.6 Latin America

10.6.1 Trends Analysis

10.6.2 Latin America Regenerative Agriculture Market Estimates and Forecasts, by Country (2020-2032) (USD Billion)

10.6.3 Latin America Regenerative Agriculture Market Estimates and Forecasts, By End-User (2020-2032) (USD Billion) 

10.6.4 Latin America Regenerative Agriculture Market Estimates and Forecasts, By Type (2020-2032) (USD Billion)

10.6.5 Latin America Regenerative Agriculture Market Estimates and Forecasts, By Component (2020-2032) (USD Billion)

10.6.6 Brazil

10.6.6.1 Brazil Regenerative Agriculture Market Estimates and Forecasts, By End-User (2020-2032) (USD Billion)

10.6.6.2 Brazil Regenerative Agriculture Market Estimates and Forecasts, By Type (2020-2032) (USD Billion)

10.6.6.3 Brazil Regenerative Agriculture Market Estimates and Forecasts, By Component (2020-2032) (USD Billion)

10.6.7 Argentina

10.6.7.1 Argentina Regenerative Agriculture Market Estimates and Forecasts, By End-User (2020-2032) (USD Billion)

10.6.7.2 Argentina Regenerative Agriculture Market Estimates and Forecasts, By Type (2020-2032) (USD Billion)

10.6.7.3 Argentina Regenerative Agriculture Market Estimates and Forecasts, By Component (2020-2032) (USD Billion)

10.6.8 Colombia

10.6.8.1 Colombia Regenerative Agriculture Market Estimates and Forecasts, By End-User (2020-2032) (USD Billion)

10.6.8.2 Colombia Regenerative Agriculture Market Estimates and Forecasts, By Type (2020-2032) (USD Billion)

10.6.8.3 Colombia Regenerative Agriculture Market Estimates and Forecasts, By Component (2020-2032) (USD Billion)

10.6.9 Rest of Latin America

10.6.9.1 Rest of Latin America Regenerative Agriculture Market Estimates and Forecasts, By End-User (2020-2032) (USD Billion)

10.6.9.2 Rest of Latin America Regenerative Agriculture Market Estimates and Forecasts, By Type (2020-2032) (USD Billion)

10.6.9.3 Rest of Latin America Regenerative Agriculture Market Estimates and Forecasts, By Component (2020-2032) (USD Billion)

11. Company Profiles

11.1 Vayda

11.1.1 Company Overview

11.1.2 Financial

11.1.3 Products/ Services Offered

11.1.4 SWOT Analysis

11.2 Terramera Inc.

11.2.1 Company Overview

11.2.2 Financial

11.2.3 Products/ Services Offered

11.2.4 SWOT Analysis

11.3 Agreed.Earth

11.3.1 Company Overview

11.3.2 Financial

11.3.3 Products/ Services Offered

11.3.4 SWOT Analysis

11.4 Biotrex

11.4.1 Company Overview

11.4.2 Financial

11.4.3 Products/ Services Offered

11.4.4 SWOT Analysis

11.5 Ecorobotix SA

11.5.1 Company Overview

11.5.2 Financial

11.5.3 Products/ Services Offered

11.5.4 SWOT Analysis

11.6 Ruumi

11.6.1 Company Overview

11.6.2 Financial

11.6.3 Products/ Services Offered

11.6.4 SWOT Analysis

11.7 Continuum Ag

11.7.1 Company Overview

11.7.2 Financial

11.7.3 Products/ Services Offered

11.7.4 SWOT Analysis

11.8 Aker Technologies, Inc.

11.8.1 Company Overview

11.8.2 Financial

11.8.3 Products/ Services Offered

11.8.4 SWOT Analysis

11.9 Indigo Ag, Inc.

11.9.1 Company Overview

11.9.2 Financial

11.9.3 Products/ Services Offered

11.9.4 SWOT Analysis

11.10 Tortuga Agricultural Technologies, Inc.

11.10.1 Company Overview

11.10.2 Financial

11.10.3 Products/ Services Offered

11.10.4 SWOT Analysis

12. Use Cases and Best Practices

13. Conclusion

An accurate research report requires proper strategizing as well as implementation. There are multiple factors involved in the completion of good and accurate research report and selecting the best methodology to compete the research is the toughest part. Since the research reports we provide play a crucial role in any company’s decision-making process, therefore we at SNS Insider always believe that we should choose the best method which gives us results closer to reality. This allows us to reach at a stage wherein we can provide our clients best and accurate investment to output ratio.

Each report that we prepare takes a timeframe of 350-400 business hours for production. Starting from the selection of titles through a couple of in-depth brain storming session to the final QC process before uploading our titles on our website we dedicate around 350 working hours. The titles are selected based on their current market cap and the foreseen CAGR and growth.


The 5 steps process:

Step 1: Secondary Research:

Secondary Research or Desk Research is as the name suggests is a research process wherein, we collect data through the readily available information. In this process we use various paid and unpaid databases which our team has access to and gather data through the same. This includes examining of listed companies’ annual reports, Journals, SEC filling etc. Apart from this our team has access to various associations across the globe across different industries. Lastly, we have exchange relationships with various university as well as individual libraries.

Secondary Research

Step 2: Primary Research

When we talk about primary research, it is a type of study in which the researchers collect relevant data samples directly, rather than relying on previously collected data.  This type of research is focused on gaining content specific facts that can be sued to solve specific problems. Since the collected data is fresh and first hand therefore it makes the study more accurate and genuine.

We at SNS Insider have divided Primary Research into 2 parts.

Part 1 wherein we interview the KOLs of major players as well as the upcoming ones across various geographic regions. This allows us to have their view over the market scenario and acts as an important tool to come closer to the accurate market numbers. As many as 45 paid and unpaid primary interviews are taken from both the demand and supply side of the industry to make sure we land at an accurate judgement and analysis of the market.

This step involves the triangulation of data wherein our team analyses the interview transcripts, online survey responses and observation of on filed participants. The below mentioned chart should give a better understanding of the part 1 of the primary interview.

Primary Research

Part 2: In this part of primary research the data collected via secondary research and the part 1 of the primary research is validated with the interviews from individual consultants and subject matter experts.

Consultants are those set of people who have at least 12 years of experience and expertise within the industry whereas Subject Matter Experts are those with at least 15 years of experience behind their back within the same space. The data with the help of two main processes i.e., FGDs (Focused Group Discussions) and IDs (Individual Discussions). This gives us a 3rd party nonbiased primary view of the market scenario making it a more dependable one while collation of the data pointers.

Step 3: Data Bank Validation

Once all the information is collected via primary and secondary sources, we run that information for data validation. At our intelligence centre our research heads track a lot of information related to the market which includes the quarterly reports, the daily stock prices, and other relevant information. Our data bank server gets updated every fortnight and that is how the information which we collected using our primary and secondary information is revalidated in real time.

Data Bank Validation

Step 4: QA/QC Process

After all the data collection and validation our team does a final level of quality check and quality assurance to get rid of any unwanted or undesired mistakes. This might include but not limited to getting rid of the any typos, duplication of numbers or missing of any important information. The people involved in this process include technical content writers, research heads and graphics people. Once this process is completed the title gets uploader on our platform for our clients to read it.

Step 5: Final QC/QA Process:

This is the last process and comes when the client has ordered the study. In this process a final QA/QC is done before the study is emailed to the client. Since we believe in giving our clients a good experience of our research studies, therefore, to make sure that we do not lack at our end in any way humanly possible we do a final round of quality check and then dispatch the study to the client.

Key Segments:

  • By Component

    • Solutions

    • Services

  • By Type

    • Agroforestry

    • Silvopasture

    • Aquaculture/Ocean Farming

    • No-Till and Pasture Cropping

    • Holistically Managed Grazing

    • Biochar

    • Others

  • By End-User

    • Farmers

    • Service Organization

    • Financial Institutions

    • Advisory Bodies

    • Consumer Packaged Goods Manufacturers

Request for Segment Customization as per your Business Requirement: Segment Customization Request

Regional Coverage:

North America

  • US

  • Canada

  • Mexico

Europe

  • Eastern Europe

    • Poland

    • Romania

    • Hungary

    • Turkey

    • Rest of Eastern Europe

  • Western Europe

    • Germany

    • France

    • UK

    • Italy

    • Spain

    • Netherlands

    • Switzerland

    • Austria

    • Rest of Western Europe

Asia Pacific

  • China

  • India

  • Japan

  • South Korea

  • Vietnam

  • Singapore

  • Australia

  • Rest of Asia Pacific

Middle East & Africa

  • Middle East

    • UAE

    • Egypt

    • Saudi Arabia

    • Qatar

    • Rest of Middle East

  • Africa

    • Nigeria

    • South Africa

    • Rest of Africa

Latin America

  • Brazil

  • Argentina

  • Colombia

  • Rest of Latin America

Request for Country Level Research Report: Country Level Customization Request

Available Customization

With the given market data, SNS Insider offers customization as per the company’s specific needs. The following customization options are available for the report:

  • Detailed Volume Analysis

  • Criss-Cross segment analysis (e.g. Product X Application)

  • Competitive Product Benchmarking

  • Geographic Analysis

  • Additional countries in any of the regions

  • Customized Data Representation

  • Detailed analysis and profiling of additional market players


  •            5000 (33% Discount)


  •            8950 (40% Discount)


  •            3050 (23% Discount)

Start a Conversation

Hi! Click one of our member below to chat on Phone