Refinery Catalyst Market Key Insights:
Get More Information on Refinery Catalyst Market - Request Sample Report
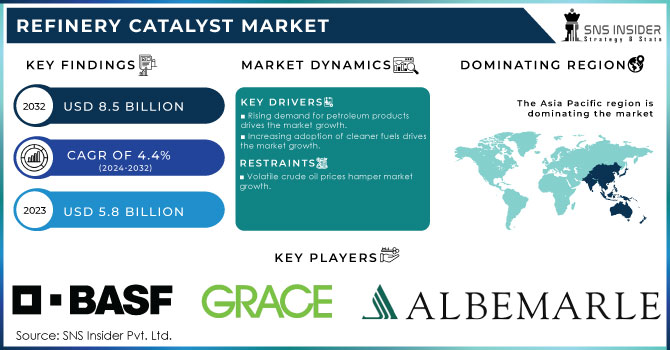
The Refinery Catalyst Market size was valued at USD 5.8 Billion in 2023. It is expected to reach to USD 8.5 Billion by 2032 and grow at a CAGR of 4.4% over the forecast period of 2024-2032.
Minimization of sulfur content in fuels becomes more important these days, owing to the stricter regulations on emissions worldwide. An illustrative example in this respect can be found by referring to the data provided by the U.S. Environmental Protection Agency. Therefore, the respective regulation that calls for the reduction of sulfur content in fuels can be seen as the reason for refineries to invest in catalysts that allow for the hydrocracking and hydrotreating of crude oil, thus, eliminating sulfuric compounds from it.
Additionally, the approach above is based on the industry’s need to lower its environmental footprint and produce cleaner fuel alternatives. Hence, the refinery catalysts are becoming increasingly popular due to the rising demands for fuels of high-quality and nutrition-burning fuels that are in sync with the principles of sustainable development.
The European Commission's 2020 report on the European Green Deal highlights that the European Union aims to have at least 55% reductions in greenhouse gas emissions by 2030. This includes a commitment to ensure that all fuels used in the transport sector are low in sulfur content, with regulations mandating a maximum of 10 ppm of sulfur in diesel fuel by 2021.
One of the strongest drivers of petrochemical refinery catalysts is an increased demand. More and more products are made of petrochemicals, and the global economy is coming to highly rely on these substances. They are used to create all sorts of items, such as clothes, Bottles, fertilizers, or pharmaceuticals, but the strongest increase in demand is caused by the oil and gas industry. More people are populating cities, and the urbanization trend is being increased further by advances in technology. As refineries and petrochemical plants look to increase their production, catalysts become paramount due to the need for efficiency.
The European Commission noted that the European petrochemical sector generates approximately USD 546.5 billion in revenue annually and employs around 1.3 million people. The demand for petrochemicals is projected to rise, particularly in sectors such as automotive, packaging, and construction.
Market Dynamics
Drivers
-
Rising demand for petroleum products drives the market growth.
-
Increasing adoption of cleaner fuels drives the market growth.
One of the most prominent drivers of the refinery catalyst market is the rising tendency toward the use of cleaner fuels. The tendency is encouraged by the global concern for the overall reduction of carbon emissions and a movement toward environmental sustainability. Hence, as governments and regulatory bodies worldwide start imposing more strict limitations against emissions, one can see the growing demand for the catalysts that help create low-sulfur gasoline and ultra-low-sulfur diesel. As one of the central catalysts used in the refining process, the product is commonly used for the removal of sulfur compounds from the crude. As one of the primary pollutants that define the appearance of smog in the atmosphere and subsequently contribute to the creation of acid rain, the products that contain sulfur have become the focus of environmental concern. In addition, the transition to cleaner fuels is fostered by the increasing interest in ecologically friendly products and the gradual change of the automotive industry to the use of cars powered by alternative energy types such as electricity.
The International Energy Agency (IEA) 2021 report indicated that the global demand for cleaner fuels, including low-sulfur gasoline, is expected to grow, with investments in fuel production technologies projected to reach USD 1 trillion by 2030. This investment is essential for transitioning to lower-carbon fuels and achieving global climate targets.
Restraint
-
Volatile crude oil prices hamper market growth.
Volatile crude oil prices are one of the factors that significantly obstruct the growth of the refinery catalyst market. The issue is that when the crude oil price is changing rapidly, the enterprises that operate the refinery business are also constantly adapting to new conditions. In this case, for the enterprises, not only the price per barrel of oil matters but the changes in demand from the population; and changes in the economy of the country and the world, are included in the overall indicator of crude oil price. The companies constantly adapt to changes in their activities depending on the changes in the oil price; this, in turn, leads to changes in the demand for refinery catalysts. For example, when the prices for crude oil collapse, many plants reduce the refining activities or stop production in order not to cover the expenses since it is unprofitable to make products at the refining catalysis.
Market Segmentation Analysis
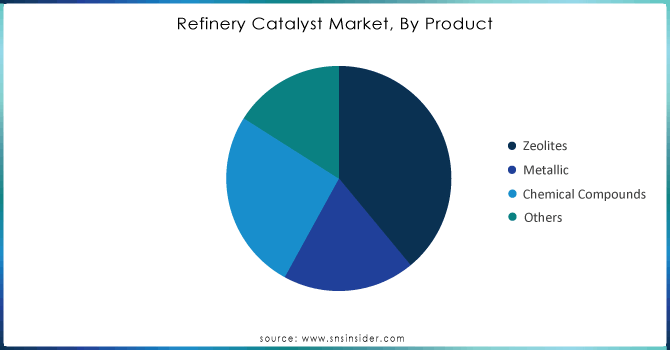
By Product
The Zeolite product segment dominated the market with a revenue share of more than 39% in 2023. This is because zeolites are used as adsorbents and catalysts in various applications due to their porosity and large surface area. The porosity structure of zeolites can accommodate several cations including but not limited to potassium, sodium, calcium, and magnesium. Naturally, zeolites are formed as a result of the occurrence of volcanic rocks and ash layers reacting with alkaline water. However, in nature, they cannot be used since they are impure as they contain other minerals, metals, and quartz.
On the other hand, commercial zeolites are obtained from the slow crystallization of silica-alumina gel and many other atoms added to enhance activity and performance in a given process. A zeolite catalyst used is dependent on the type of feedstock, the oxidant, the desired cycle length, and the product to be obtained.
Need Any Customization Research On Refinery Catalyst Market - Inquiry Now
By Application
The application segment of the FCC catalyst held the largest market share around 46% in 2023. This segment’s growth can be assessed by significant demand growth for gasoline, which is used as fuel for an automotive vehicle all over the world. Other application-based segments include fluid catalytic cracking catalysts, hydrotreating catalysts, hydrocracking catalysts, and catalytic reforming.
Fluid catalytic cracking is the method most preferred by refineries to convert heavy and high boiling hydrocarbons to lower valuable fractions. The material to be gained can be enumerated such as gasoline and diesel, C3 and C4 gaseous fraction. This process is helpful as it forms by producing an extra quantity of gasoline and satisfies the ever-growing demand for automotive vehicles. The lighter fraction produced is rerouted to the alkylation unit to produce an important high-octane component of gasoline called alkylate. The heavier fraction is used as a blender and an additive in diesel.
Regional Analysis
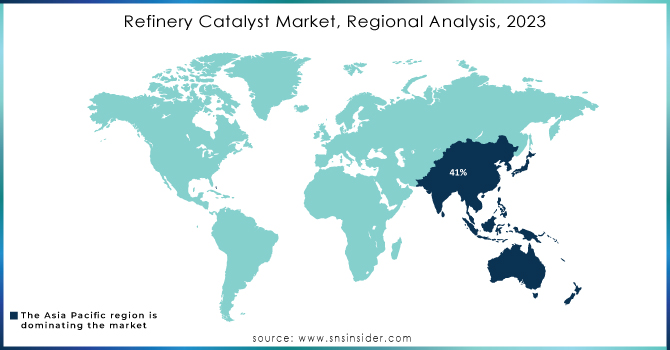
The Asia Pacific region held the highest market share around 41% in 2023. The leading position of the region is reinforced by the enormous capacity for refining, with almost 35% of worldwide refining capacity occupied by the Asia Pacific region. Such regional powers as China and India have shown a growth tendency in the refining capacity. Thus, over the past year, China has increased its capacity by more than 5% and reached over 1 7 million barrels per day. Moreover, the investments in advanced catalyst technologies by the companies in the Asia Pacific region have boomed as new toxic fuel regulations in Japan and South Korea, e.g., low-sulfur fuel standards, foster the refiners to take catalyst solutions for better refinements that keep them in compliance with strict regulatory standards. Therefore, the powerful expansion of capacities, regulatory restrictions in countries with strong capacities such as Japan and South Korea, and innovative solutions in Vietnam and Indonesia stir up the leading position of the Asia Pacific region in the refinery catalyst market.
Key Players
-
BASF SE (FCC Catalysts, Hydroprocessing Catalysts)
-
W. R. Grace & Co. (Grace FCC Catalysts, Grace Hydrocracking Catalysts)
-
Albemarle Corporation (FCC Catalysts, Hydroprocessing Catalysts)
-
Johnson Matthey Plc (FCC Catalysts, Hydroprocessing Catalysts)
-
Clariant AG (FCC Catalysts, Hydrotreating Catalysts)
-
Haldor Topsoe A/S (Hydrocracking Catalysts, Hydrotreating Catalysts)
-
Honeywell UOP (UOP FCC Catalysts, UOP Hydroprocessing Catalysts)
-
Axens SA (FCC Catalysts, Hydrocracking Catalysts)
-
China Petroleum & Chemical Corporation (Sinopec) (FCC Catalysts, Reforming Catalysts)
-
Criterion Catalysts & Technologies L.P. (Hydroprocessing Catalysts, FCC Catalysts)
-
Zeolyst International (Zeolite Catalysts, Hydrocracking Catalysts)
-
Shell Catalysts & Technologies (FCC Catalysts, Hydroprocessing Catalysts)
-
Advanced Refining Technologies (ART) (Hydroprocessing Catalysts, Hydrotreating Catalysts)
-
JGC Catalysts and Chemicals Ltd. (FCC Catalysts, Hydrotreating Catalysts)
-
Qingdao Huicheng Environmental Technology Co., Ltd. (FCC Catalysts, Desulfurization Catalysts)
-
Albemarle Netherlands BV (Hydrotreating Catalysts, Reforming Catalysts)
-
Nippon Ketjen Co., Ltd. (FCC Catalysts, Hydroprocessing Catalysts)
-
Huntsman Corporation (Polymer Catalysts, Hydroprocessing Catalysts)
-
Taiyo Koko Co., Ltd. (Hydrotreating Catalysts, FCC Catalysts)
-
Porocel Corporation (FCC Catalysts, Hydrocracking Catalysts)
Key Suppliers
-
ExxonMobil
-
Royal Dutch Shell
-
Chevron
-
TotalEnergies
-
Phillips 66
-
BP
-
Valero Energy Corporation
-
SABIC
-
Petrobras
-
Marathon Petroleum
Recent Developments:
-
In 2023, BASF expanded its catalyst manufacturing capacity in China, aiming to support local demand for FCC catalysts and improve service for Asian refineries.
-
In 2022, Grace introduced a new line of FCC catalysts, designed to enhance yield and reduce sulfur emissions, catering to stricter environmental regulations.
-
In 2023, Albemarle launched a new Hydrocracking catalyst that improves conversion rates and increases refinery efficiency, tailored to meet growing fuel demands.
| Report Attributes | Details |
|---|---|
| Market Size in 2023 | US$ 5.8 Billion |
| Market Size by 2032 | US$ 8.5 Billion |
| CAGR | CAGR of4.4% From 2024 to 2032 |
| Base Year | 2023 |
| Forecast Period | 2024-2032 |
| Historical Data | 2020-2022 |
| Report Scope & Coverage | Market Size, Segments Analysis, Competitive Landscape, Regional Analysis, DROC & SWOT Analysis, Forecast Outlook |
| Key Segments | • By Product (Zeolites, Metallic, Chemical Compounds, Others) • By Application (FCC Catalysts, Alkylation Catalysts, Hydrotreating Catalysts, Hydrocracking Catalysts, Catalytic Reforming, Others) |
| Regional Analysis/Coverage | North America (US, Canada, Mexico), Europe (Eastern Europe [Poland, Romania, Hungary, Turkey, Rest of Eastern Europe] Western Europe] Germany, France, UK, Italy, Spain, Netherlands, Switzerland, Austria, Rest of Western Europe]), Asia Pacific (China, India, Japan, South Korea, Vietnam, Singapore, Australia, Rest of Asia Pacific), Middle East & Africa (Middle East [UAE, Egypt, Saudi Arabia, Qatar, Rest of Middle East], Africa [Nigeria, South Africa, Rest of Africa], Latin America (Brazil, Argentina, Colombia, Rest of Latin America) |
| Company Profiles | BASF SE, W. R. Grace & Co., Albemarle Corporation, Johnson Matthey Plc, Clariant AG, Haldor Topsoe A/S, Honeywell UOP, Axens SA, China Petroleum & Chemical Corporation (Sinopec), Criterion Catalysts & Technologies L.P., Zeolyst International, Shell Catalysts & Technologies, Advanced Refining Technologies (ART), JGC Catalysts and Chemicals Ltd., Qingdao Huicheng Environmental Technology Co., Ltd., Albemarle Netherlands BV, Nippon Ketjen Co., Ltd., Huntsman Corporation, Taiyo Koko Co., Ltd., Porocel Corporation. and others |
| Key Drivers | • Rising demand for petroleum products drives the market growth. • Increasing adoption of cleaner fuels drives the market growth. |
| RESTRAINTS | • Volatile crude oil prices hamper market growth. |
