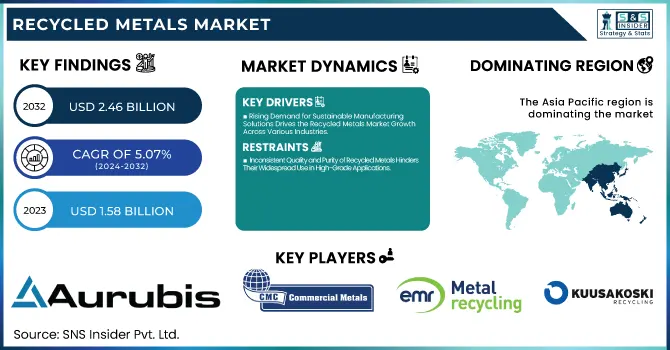
The Recycled Metals Market size was valued at USD 1.58 billion in 2023 and is expected to reach USD 2.46 billion by 2032, growing at a CAGR of 5.07% over the forecast period 2024-2032.
To Get more information on Recycled Metals Market - Request Free Sample Report
The Recycled Metals Market is experiencing substantial growth driven by several dynamic factors, including rising environmental awareness, regulatory support for sustainable practices, and innovations in recycling technologies. The growing demand for raw materials combined with the push to reduce carbon footprints is encouraging industries to shift towards using recycled metals over virgin materials. In August 2024, the Indian government introduced a mandate requiring 5% recycled content in non-ferrous metal products, including aluminum. This initiative reflects a broader commitment to enhancing sustainability across industries, contributing to an increased demand for recycled metals. Such regulatory frameworks are expected to further reshape market dynamics and boost the adoption of recycled metals.
Technological advancements are also significantly influencing the growth of the market by improving recycling processes and increasing efficiency. In September 2024, researchers introduced a novel method for sustainable metal recycling, which holds the potential to improve metal recovery rates and reduce contamination in recycled materials. The University of Toronto, in July 2024, unveiled an electromechanical cell designed to remove copper contamination from recycled steel, thus enhancing the quality of recycled metals. Additionally, efforts are underway to improve copper recycling technologies, as highlighted in a December 2024 report, which stresses the importance of developing advanced techniques for recycling copper more sustainably. Companies are actively positioning themselves within the market to benefit from these advancements. Greenwave Technology Solutions, for instance, revealed in December 2024 its strategic plans to expand within the rapidly consolidating U.S. scrap metal industry, signaling a shift in market competition. Meanwhile, in July 2024, Yamaha Motor became the first in Japan to adopt low-carbon recycled steel for motorcycle packaging frames, setting an example for other manufacturers in the region to follow. These developments highlight the concerted efforts of companies like Greenwave Technology Solutions and Yamaha Motor in driving sustainability and advancing recycling technologies within the Recycled Metals Market.
Drivers
Rising Demand for Sustainable Manufacturing Solutions Drives the Recycled Metals Market Growth Across Various Industries
Supportive Government Regulations and Mandates for Recycling Boost Adoption of Recycled Metals in Key Markets
Growing Consumer Awareness of Environmental Impact Encourages Increased Adoption of Recycled Metals in Products
Increasing consumer awareness regarding the environmental impact of their purchasing decisions is fueling demand for products made from recycled materials, including metals. As consumers become more conscious of issues like climate change, resource depletion, and pollution, they are actively seeking products that are sustainably sourced and environmentally friendly. This shift in consumer preferences has prompted manufacturers across various industries, including automotive, electronics, and construction, to incorporate recycled metals into their products. For instance, electric vehicle manufacturers are increasingly using recycled aluminum and steel to reduce their environmental footprint. Additionally, consumer goods brands are embracing recycled metal packaging to appeal to environmentally conscious shoppers. As consumer demand for sustainability grows, businesses are under pressure to adopt more sustainable practices in their production processes. This cultural shift is anticipated to be a key driver for the recycled metals market, as companies strive to meet the expectations of the modern consumer and improve their brand image through environmentally responsible practices.
Restraints
Inconsistent Quality and Purity of Recycled Metals Hinders Their Widespread Use in High-Grade Applications
One of the primary hurdles facing the recycled metals market is maintaining the quality and purity of the recycled materials, particularly for high-end applications. While recycled metals offer significant environmental and economic benefits, the quality of recycled materials can sometimes be inconsistent due to contamination or the degradation of metals over time. For instance, in the recycling of metals like steel or aluminum, impurities can be introduced from other materials, leading to reduced quality and making the metal unsuitable for certain applications, especially in industries such as aerospace or high-performance automotive manufacturing. To address this issue, advanced technologies like electromagnetic separation and chemical treatments are being employed to improve the purity of recycled metals, but such processes can be costly and complex. The challenge of maintaining consistent quality can limit the widespread adoption of recycled metals in industries that require stringent material specifications, thus acting as a restraint for the market's growth.
Opportunities
Innovative Recycling Technologies Provide Significant Growth Potential for Emerging Markets in the Recycled Metals Industry
The emergence of innovative recycling technologies presents significant growth opportunities for the recycled metals market, especially in emerging economies. As these countries strive to meet growing industrial demands while balancing sustainability goals, there is a rising opportunity for the adoption of advanced metal recycling processes. The development of more efficient sorting, cleaning, and processing technologies can help these countries address their increasing need for raw materials while minimizing environmental impact. Furthermore, emerging markets often have large amounts of untapped scrap metals that can be recycled, offering an additional source of supply for the global market. By leveraging cutting-edge recycling methods, these countries can position themselves as leaders in the sustainable metal industry, capitalizing on the growing demand for recycled metals globally.
Collaboration Between Recycling Companies and Manufacturers Opens New Avenues for Sustainable Metal Sourcing
Rising Demand for Electric Vehicles Creates Substantial Need for Recycled Metals, Particularly Aluminum and Steel
Challenge
High Energy Consumption and Costs Associated with Metal Recycling Processes Limit Profitability and Market Growth
The high energy consumption and associated costs of metal recycling processes present a significant challenge to the profitability and scalability of the recycled metals market. While recycling metals is generally more energy-efficient than producing new metals from raw materials, the energy required for advanced recycling technologies and large-scale operations remains substantial. For instance, smelting processes for extracting metals from scrap require considerable amounts of energy, which can lead to high operational costs. Additionally, the initial setup costs for recycling facilities, including investments in equipment and infrastructure, can be prohibitive for smaller players. These costs limit the market's ability to expand rapidly and may discourage new entrants from participating in the industry. As energy prices continue to fluctuate, the economic feasibility of metal recycling processes could be further impacted, posing a challenge to the continued growth of the recycled metals market.
| Industry | Recycled Metal Application | Adoption Rate | Key Insights |
|---|---|---|---|
|
Automotive |
Recycled steel, aluminum, and copper for vehicle parts |
60-70% recycled content in vehicle manufacturing |
Recycled metals help reduce production costs and improve sustainability in automotive manufacturing. |
|
Construction |
Recycled steel for structural components and rebar |
90% of the steel used in construction comes from recycled sources |
Steel is one of the most commonly recycled materials in the construction industry due to its durability and reuse potential. |
|
Electronics |
Recycled copper, gold, and aluminum in electronics |
20-30% adoption in consumer electronics |
Recycled metals reduce costs and e-waste, especially in the production of circuits and cables. |
|
Packaging |
Recycled aluminum, steel, and copper in packaging |
80-90% of aluminum cans are recycled |
High adoption rate due to the economic benefits of recycling and government policies promoting sustainable packaging. |
|
Energy |
Recycled steel and aluminum in renewable energy systems |
40-50% adoption in renewable energy applications |
Recycled materials are increasingly used in wind turbines, solar panels, and infrastructure due to environmental benefits. |
The adoption of recycled metals varies significantly across industries, with some sectors embracing them at higher rates due to their sustainability benefits and cost-effectiveness. In the automotive industry, around 60-70% of vehicle production uses recycled metals like steel, aluminum, and copper, driven by the need for lighter materials and lower environmental impact. The construction industry is one of the largest adopters, using up to 90% recycled steel, which is vital for creating durable infrastructure while minimizing waste. The electronics sector, although still in the early stages, has seen a rise in the use of recycled copper, gold, and aluminum, with adoption rates of 20-30%, driven by environmental concerns over e-waste. Packaging industries are at the forefront, with approximately 80-90% of aluminum cans being recycled, thanks to consumer demand for sustainable practices and the economic advantages of recycled materials. Lastly, the energy sector utilizes about 40-50% recycled steel and aluminum in renewable energy systems, including wind turbines and solar panels, as these industries shift toward greener materials to reduce environmental impact. These industry-specific applications demonstrate the growing role of recycled metals in contributing to a sustainable, circular economy across various sectors.
By Source
Post-consumer Scrap dominated the recycled metals market in 2023, holding a market share of 65%. This segment comprises metals derived from products that have reached the end of their life cycle, such as cars, household appliances, and electronics. The growth of post-consumer scrap can be attributed to increased consumer awareness and initiatives promoting recycling. Governments worldwide are implementing stricter regulations and incentives to encourage consumers to recycle products, thereby enhancing the supply of post-consumer scrap. For example, automotive companies often reclaim metals from old vehicles, utilizing advanced recycling processes to recover steel and aluminum. The electronics sector also contributes significantly to this scrap, with old devices being dismantled to extract valuable metals like copper and aluminum. The economic advantages of using recycled materials, including lower energy consumption and reduced greenhouse gas emissions, further support the growth of this segment. As industries increasingly prioritize sustainability and circular economy practices, the reliance on post-consumer scrap is expected to continue to rise, driving its dominance in the recycled metals market.
By Metal Type
In 2023, ferrous metals dominated the recycled metals market, with a market share of 70%, and within this category, steel emerged as the leading sub-segment, accounting for nearly 50% of the total ferrous metal market. Steel is the most widely recycled metal due to its unique properties, making it suitable for various applications. The recycling process for steel is highly efficient, requiring significantly less energy compared to producing new steel from raw materials. This efficiency is a key driver for its adoption across multiple industries, including construction and automotive. In the construction sector, recycled steel is extensively used for structural components, reinforcing bars, and frames, significantly reducing environmental impact and cost. The automotive industry also contributes to the demand for recycled steel, where end-of-life vehicles are processed to recover valuable metal content. Moreover, the global push towards sustainability and resource conservation has led to increased investments in recycling technologies, enhancing the overall quality and availability of recycled steel. As such, the dominance of ferrous metals, particularly steel, underscores the importance of recycling in meeting industrial demands.
By End-use Industry
Construction dominated the end-use industry in the recycled metals market in 2023, holding a market share of 40%. The construction sector's significant reliance on recycled metals, particularly steel and aluminum, stems from the industry's focus on sustainability and resource efficiency. Recycled steel is widely utilized for structural applications, reinforcing bars, and various building components due to its strength and versatility. The increasing emphasis on sustainable construction practices, driven by both regulatory frameworks and consumer preferences, has led to a heightened demand for recycled materials in this sector. For instance, many construction projects now aim to achieve green building certifications, which often require the use of a certain percentage of recycled content in building materials. Additionally, the economic advantages of using recycled metals, such as reduced material costs and minimized waste disposal expenses, contribute to their growing adoption. The construction industry's commitment to reducing its carbon footprint and promoting circular economy principles further drives the demand for recycled metals, solidifying its position as the leading end-use segment in the market.
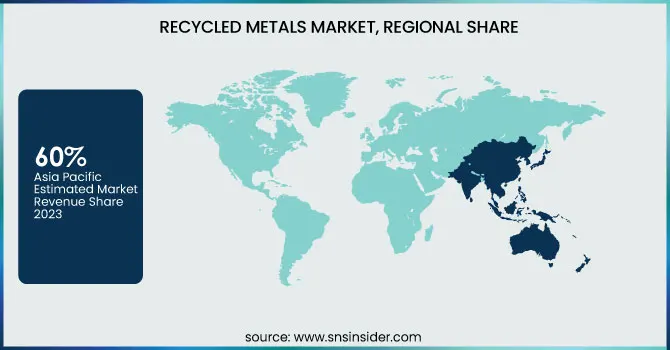
The Asia Pacific region dominated the recycled metals market in 2023, holding a market share of around 60%. This dominance is attributed to the region's strong manufacturing base, rapid industrialization, and increasing demand for recycled metals across various sectors, including automotive, construction, and electronics. China, the largest economy in the region, leads the charge, driven by its extensive steel and aluminum recycling programs. The country is a global leader in producing and recycling steel, with a significant portion of its steel industry relying on recycled metal, helping to reduce costs and environmental impact. India is another key player, with increasing government initiatives promoting recycling and waste management practices, enhancing the availability of recycled materials. Additionally, Japan has made significant strides in establishing a circular economy, with advanced recycling technologies and an efficient waste management system. The region's dominance can also be linked to high urbanization rates and robust demand for infrastructure development, requiring vast amounts of recycled materials, especially steel. The growing environmental consciousness and adoption of sustainable practices across Asia Pacific countries are further fueling the demand for recycled metals, reinforcing the region's leading position in the market.
On the other hand, the Middle East & Africa (MEA) region emerged as the fastest-growing region for the recycled metals market in 2023, with a CAGR of around 8%. This rapid growth is driven by several factors, including a burgeoning construction industry, increasing investments in recycling infrastructure, and government initiatives focusing on sustainability and resource efficiency. In the United Arab Emirates (UAE), the government has implemented ambitious waste management and recycling programs, leading to an increase in the recycling of metals like aluminum and steel. Saudi Arabia is also focusing on building sustainable cities and enhancing its recycling capabilities to meet growing demand from its industrial and construction sectors. The region's demand for recycled metals is further boosted by the availability of raw materials through mining and scrap collection, coupled with the shift towards more eco-friendly manufacturing practices. As the region continues to urbanize, the need for recycled metals in infrastructure projects, particularly steel and aluminum, is set to rise. The Middle East & Africa's focus on circular economy practices and sustainability will likely continue to propel its growth, making it a key player in the global recycled metals market in the coming years.
Get Customized Report as per Your Business Requirement - Enquiry Now
Key Players
Aurubis AG (Copper scrap, Aluminum scrap)
Commercial Metals Company (Recycled steel, Recycled aluminum)
European Metal Recycling Ltd. (Ferrous metals, Non-ferrous metals)
GFG Alliance (Steel, Aluminum)
Kuusakoski Group (Recycled copper, Recycled steel)
Liberty Steel Group (Recycled steel, Stainless steel)
Metal Management Inc. (Ferrous scrap, Non-ferrous scrap)
Norsk Hydro ASA (Aluminum scrap, Aluminum alloys)
Nucor Corporation (Recycled steel, Rebar)
Novelis Inc. (Recycled aluminum, Aluminum sheet)
OmniSource Corporation (Steel scrap, Aluminum scrap)
Schnitzer Steel Industries, Inc. (Ferrous scrap, Non-ferrous scrap)
Sims Metal Management Ltd. (Steel scrap, Aluminum scrap)
Southern Recycling LLC (Recycled steel, Copper scrap)
Steel Dynamics Inc. (Recycled steel, Stainless steel)
Tata Steel (Steel scrap, Recycled steel)
Upstate Shredding LLC (Ferrous metals, Non-ferrous metals)
Aaron Metals (Copper scrap, Aluminum scrap)
Alter Trading Corporation (Ferrous scrap, Non-ferrous scrap)
Ferrous Processing & Trading Co. (Ferrous scrap, Aluminum scrap)
Recent Development:
December 2024: Greenwave Technology Solutions Inc. positioned itself for growth in the U.S. scrap metal industry by enhancing its operations and supply chain to meet rising demand for recycled metals.
July 2024: Yamaha Motor Company became the first in Japan to use low-carbon recycled steel for motorcycle packaging frames, reinforcing its commitment to sustainability and reducing carbon emissions.
March 2023: Commercial Metals Company (CMC) acquired Roane Metals Group LLC, a metal recycling firm. This acquisition is anticipated to strengthen the security and supply of cost-effective materials for CMC's steelmaking operations.
| Report Attributes | Details |
|---|---|
|
Market Size in 2023 |
US$ 1.58 Billion |
|
Market Size by 2032 |
US$ 2.46 Billion |
|
CAGR |
CAGR of 5.07% From 2024 to 2032 |
|
Base Year |
2023 |
|
Forecast Period |
2024-2032 |
|
Historical Data |
2020-2022 |
|
Report Scope & Coverage |
Market Size, Segments Analysis, Competitive Landscape, Regional Analysis, DROC & SWOT Analysis, Forecast Outlook |
|
Key Segments |
•By Source (Industrial Scrap, Post-consumer Scrap) |
|
Regional Analysis/Coverage |
North America (US, Canada, Mexico), Europe (Eastern Europe [Poland, Romania, Hungary, Turkey, Rest of Eastern Europe] Western Europe] Germany, France, UK, Italy, Spain, Netherlands, Switzerland, Austria, Rest of Western Europe]), Asia Pacific (China, India, Japan, South Korea, Vietnam, Singapore, Australia, Rest of Asia Pacific), Middle East & Africa (Middle East [UAE, Egypt, Saudi Arabia, Qatar, Rest of Middle East], Africa [Nigeria, South Africa, Rest of Africa], Latin America (Brazil, Argentina, Colombia, Rest of Latin America) |
|
Company Profiles |
Nucor Corporation, Sims Metal Management Ltd., Novelis Inc., Tata Steel, Aurubis AG, European Metal Recycling Ltd., Schnitzer Steel Industries, Inc., GFG Alliance, Commercial Metals Company, Steel Dynamics Inc. and other key players |
|
Key Drivers |
•Rising Demand for Sustainable Manufacturing Solutions Drives the Recycled Metals Market Growth Across Various Industries |
|
Restraints |
•Inconsistent Quality and Purity of Recycled Metals Hinders Their Widespread Use in High-Grade Applications |
Ans: The Recycled Metals (CO2) Market is expected to grow at a CAGR of 5.07%
Ans: The Recycled Metals Market size was valued at USD 1.58 billion in 2023 and is expected to reach USD 2.46 billion by 2032
Ans: Innovative recycling technologies, collaborations between recycling firms and manufacturers, and rising demand for electric vehicles, particularly for aluminum and steel, are creating significant growth opportunities in the recycled metals industry, especially in emerging markets.
Ans: High energy consumption and costs associated with metal recycling processes hinder the profitability, scalability, and growth of the recycled metals market.
Ans: The Asia Pacific region dominated the recycled metals market in 2023 with an estimated 45% market share, driven by strong manufacturing, industrialization, and high demand for recycled metals, particularly in China, India, and Japan.
Table Of Contents:
1. Introduction
1.1 Market Definition
1.2 Scope (Inclusion and Exclusions)
1.3 Research Assumptions
2. Executive Summary
2.1 Market Overview
2.2 Regional Synopsis
2.3 Competitive Summary
3. Research Methodology
3.1 Top-Down Approach
3.2 Bottom-up Approach
3.3. Data Validation
3.4 Primary Interviews
4. Market Dynamics Impact Analysis
4.1 Market Driving Factors Analysis
4.1.1 Drivers
4.1.2 Restraints
4.1.3 Opportunities
4.1.4 Challenges
4.2 PESTLE Analysis
4.3 Porter’s Five Forces Model
5. Statistical Insights and Trends Reporting
5.1 Production Capacity and Utilization Analysis by Region
5.2 Feedstock Prices Analysis by Region
5.3 Industry-Specific Applications and Adoption Rates
5.4 Cost-Benefit Analysis of Recycled Metals vs. Virgin Metals
5.5 Economic and Policy Factors
6. Competitive Landscape
6.1 List of Major Companies, By Region
6.2 Market Share Analysis, By Region
6.3 Product Benchmarking
6.3.1 Product specifications and features
6.3.2 Pricing
6.4 Strategic Initiatives
6.4.1 Marketing and promotional activities
6.4.2 Distribution and supply chain strategies
6.4.3 Expansion plans and new product launches
6.4.4 Strategic partnerships and collaborations
6.5 Technological Advancements
6.6 Market Positioning and Branding
7. Recycled Metals Market Segmentation, by Source
7.1 Chapter Overview
7.2 Industrial Scrap
7.2.1 Industrial Scrap Market Trends Analysis (2020-2032)
7.2.2 Industrial Scrap Market Size Estimates and Forecasts to 2032 (USD Billion)
7.3 Post-consumer Scrap
7.3.1 Post-consumer Scrap Market Trends Analysis (2020-2032)
7.3.2 Post-consumer Scrap Market Size Estimates and Forecasts to 2032 (USD Billion)
8. Recycled Metals Market Segmentation, by Metal Type
8.1 Chapter Overview
8.2 Ferrous
8.2.1 Ferrous Market Trends Analysis (2020-2032)
8.2.2 Ferrous Market Size Estimates and Forecasts to 2032 (USD Billion)
8.2.3 Steel
8.2.3.1 Steel Market Trends Analysis (2020-2032)
8.2.3.2 Steel Market Size Estimates and Forecasts to 2032 (USD Billion)
8.2.4 Iron
8.2.4.1 Iron Market Trends Analysis (2020-2032)
8.2.4.2 Iron Market Size Estimates and Forecasts to 2032 (USD Billion)
8.2.5 Others
8.2.5.1 Others Market Trends Analysis (2020-2032)
8.2.5.2 Others Market Size Estimates and Forecasts to 2032 (USD Billion)
8.3 Non-Ferrous
8.3.1 Non-Ferrous Market Trends Analysis (2020-2032)
8.3.2 Non-Ferrous Market Size Estimates and Forecasts to 2032 (USD Billion)
8.3.3 Aluminum
8.3.3.1 Aluminum Market Trends Analysis (2020-2032)
8.3.3.2 Aluminum Market Size Estimates and Forecasts to 2032 (USD Billion)
8.3.4 Copper
8.3.4.1 Copper Market Trends Analysis (2020-2032)
8.3.4.2 Copper Market Size Estimates and Forecasts to 2032 (USD Billion)
8.3.5 Lead
8.3.5.1 Lead Market Trends Analysis (2020-2032)
8.3.5.2 Lead Market Size Estimates and Forecasts to 2032 (USD Billion)
8.3.6 Others
8.3.6.1 Others Market Trends Analysis (2020-2032)
8.3.6.2 Others Market Size Estimates and Forecasts to 2032 (USD Billion)
9. Recycled Metals Market Segmentation, by End-use Industry
9.1 Chapter Overview
9.2 Automotive
9.2.1 Automotive Market Trends Analysis (2020-2032)
9.2.2 Automotive Market Size Estimates and Forecasts to 2032 (USD Billion)
9.3 Construction
9.3.1 Construction Market Trends Analysis (2020-2032)
9.3.2 Construction Market Size Estimates and Forecasts to 2032 (USD Billion)
9.4 Electrical & Electronics
9.4.1 Electrical & Electronics Market Trends Analysis (2020-2032)
9.4.2 Electrical & Electronics Market Size Estimates and Forecasts to 2032 (USD Billion)
9.5 Packaging
9.5.1 Packaging Market Trends Analysis (2020-2032)
9.5.2 Packaging Market Size Estimates and Forecasts to 2032 (USD Billion)
9.6 Industrial Machinery
9.6.1 Industrial Machinery Market Trends Analysis (2020-2032)
9.6.2 Industrial Machinery Market Size Estimates and Forecasts to 2032 (USD Billion)
9.5 Consumer Goods
9.5.1 Consumer Goods Market Trends Analysis (2020-2032)
9.5.2 Consumer Goods Market Size Estimates and Forecasts to 2032 (USD Billion)
9.6 Others
9.6.1 Others Market Trends Analysis (2020-2032)
9.6.2 Others Market Size Estimates and Forecasts to 2032 (USD Billion)
10. Regional Analysis
10.1 Chapter Overview
10.2 North America
10.2.1 Trends Analysis
10.2.2 North America Recycled Metals Market Estimates and Forecasts, by Country (2020-2032) (USD Billion)
10.2.3 North America Recycled Metals Market Estimates and Forecasts, by Source (2020-2032) (USD Billion)
10.2.4 North America Recycled Metals Market Estimates and Forecasts, by Metal Type (2020-2032) (USD Billion)
10.2.5 North America Recycled Metals Market Estimates and Forecasts, by End-use Industry (2020-2032) (USD Billion)
10.2.6 USA
10.2.6.1 USA Recycled Metals Market Estimates and Forecasts, by Source (2020-2032) (USD Billion)
10.2.6.2 USA Recycled Metals Market Estimates and Forecasts, by Metal Type (2020-2032) (USD Billion)
10.2.6.3 USA Recycled Metals Market Estimates and Forecasts, by End-use Industry (2020-2032) (USD Billion)
10.2.7 Canada
10.2.7.1 Canada Recycled Metals Market Estimates and Forecasts, by Source (2020-2032) (USD Billion)
10.2.7.2 Canada Recycled Metals Market Estimates and Forecasts, by Metal Type (2020-2032) (USD Billion)
10.2.7.3 Canada Recycled Metals Market Estimates and Forecasts, by End-use Industry (2020-2032) (USD Billion)
10.2.8 Mexico
10.2.8.1 Mexico Recycled Metals Market Estimates and Forecasts, by Source (2020-2032) (USD Billion)
10.2.8.2 Mexico Recycled Metals Market Estimates and Forecasts, by Metal Type (2020-2032) (USD Billion)
10.2.8.3 Mexico Recycled Metals Market Estimates and Forecasts, by End-use Industry (2020-2032) (USD Billion)
10.3 Europe
10.3.1 Eastern Europe
10.3.1.1 Trends Analysis
10.3.1.2 Eastern Europe Recycled Metals Market Estimates and Forecasts, by Country (2020-2032) (USD Billion)
10.3.1.3 Eastern Europe Recycled Metals Market Estimates and Forecasts, by Source (2020-2032) (USD Billion)
10.3.1.4 Eastern Europe Recycled Metals Market Estimates and Forecasts, by Metal Type (2020-2032) (USD Billion)
10.3.1.5 Eastern Europe Recycled Metals Market Estimates and Forecasts, by End-use Industry (2020-2032) (USD Billion)
10.3.1.6 Poland
10.3.1.6.1 Poland Recycled Metals Market Estimates and Forecasts, by Source (2020-2032) (USD Billion)
10.3.1.6.2 Poland Recycled Metals Market Estimates and Forecasts, by Metal Type (2020-2032) (USD Billion)
10.3.1.6.3 Poland Recycled Metals Market Estimates and Forecasts, by End-use Industry (2020-2032) (USD Billion)
10.3.1.7 Romania
10.3.1.7.1 Romania Recycled Metals Market Estimates and Forecasts, by Source (2020-2032) (USD Billion)
10.3.1.7.2 Romania Recycled Metals Market Estimates and Forecasts, by Metal Type (2020-2032) (USD Billion)
10.3.1.7.3 Romania Recycled Metals Market Estimates and Forecasts, by End-use Industry (2020-2032) (USD Billion)
10.3.1.8 Hungary
10.3.1.8.1 Hungary Recycled Metals Market Estimates and Forecasts, by Source (2020-2032) (USD Billion)
10.3.1.8.2 Hungary Recycled Metals Market Estimates and Forecasts, by Metal Type (2020-2032) (USD Billion)
10.3.1.8.3 Hungary Recycled Metals Market Estimates and Forecasts, by End-use Industry (2020-2032) (USD Billion)
10.3.1.9 Turkey
10.3.1.9.1 Turkey Recycled Metals Market Estimates and Forecasts, by Source (2020-2032) (USD Billion)
10.3.1.9.2 Turkey Recycled Metals Market Estimates and Forecasts, by Metal Type (2020-2032) (USD Billion)
10.3.1.9.3 Turkey Recycled Metals Market Estimates and Forecasts, by End-use Industry (2020-2032) (USD Billion)
10.3.1.10 Rest of Eastern Europe
10.3.1.10.1 Rest of Eastern Europe Recycled Metals Market Estimates and Forecasts, by Source (2020-2032) (USD Billion)
10.3.1.10.2 Rest of Eastern Europe Recycled Metals Market Estimates and Forecasts, by Metal Type (2020-2032) (USD Billion)
10.3.1.10.3 Rest of Eastern Europe Recycled Metals Market Estimates and Forecasts, by End-use Industry (2020-2032) (USD Billion)
10.3.2 Western Europe
10.3.2.1 Trends Analysis
10.3.2.2 Western Europe Recycled Metals Market Estimates and Forecasts, by Country (2020-2032) (USD Billion)
10.3.2.3 Western Europe Recycled Metals Market Estimates and Forecasts, by Source (2020-2032) (USD Billion)
10.3.2.4 Western Europe Recycled Metals Market Estimates and Forecasts, by Metal Type (2020-2032) (USD Billion)
10.3.2.5 Western Europe Recycled Metals Market Estimates and Forecasts, by End-use Industry (2020-2032) (USD Billion)
10.3.2.6 Germany
10.3.2.6.1 Germany Recycled Metals Market Estimates and Forecasts, by Source (2020-2032) (USD Billion)
10.3.2.6.2 Germany Recycled Metals Market Estimates and Forecasts, by Metal Type (2020-2032) (USD Billion)
10.3.2.6.3 Germany Recycled Metals Market Estimates and Forecasts, by End-use Industry (2020-2032) (USD Billion)
10.3.2.7 France
10.3.2.7.1 France Recycled Metals Market Estimates and Forecasts, by Source (2020-2032) (USD Billion)
10.3.2.7.2 France Recycled Metals Market Estimates and Forecasts, by Metal Type (2020-2032) (USD Billion)
10.3.2.7.3 France Recycled Metals Market Estimates and Forecasts, by End-use Industry (2020-2032) (USD Billion)
10.3.2.8 UK
10.3.2.8.1 UK Recycled Metals Market Estimates and Forecasts, by Source (2020-2032) (USD Billion)
10.3.2.8.2 UK Recycled Metals Market Estimates and Forecasts, by Metal Type (2020-2032) (USD Billion)
10.3.2.8.3 UK Recycled Metals Market Estimates and Forecasts, by End-use Industry (2020-2032) (USD Billion)
10.3.2.9 Italy
10.3.2.9.1 Italy Recycled Metals Market Estimates and Forecasts, by Source (2020-2032) (USD Billion)
10.3.2.9.2 Italy Recycled Metals Market Estimates and Forecasts, by Metal Type (2020-2032) (USD Billion)
10.3.2.9.3 Italy Recycled Metals Market Estimates and Forecasts, by End-use Industry (2020-2032) (USD Billion)
10.3.2.10 Spain
10.3.2.10.1 Spain Recycled Metals Market Estimates and Forecasts, by Source (2020-2032) (USD Billion)
10.3.2.10.2 Spain Recycled Metals Market Estimates and Forecasts, by Metal Type (2020-2032) (USD Billion)
10.3.2.10.3 Spain Recycled Metals Market Estimates and Forecasts, by End-use Industry (2020-2032) (USD Billion)
10.3.2.11 Netherlands
10.3.2.11.1 Netherlands Recycled Metals Market Estimates and Forecasts, by Source (2020-2032) (USD Billion)
10.3.2.11.2 Netherlands Recycled Metals Market Estimates and Forecasts, by Metal Type (2020-2032) (USD Billion)
10.3.2.11.3 Netherlands Recycled Metals Market Estimates and Forecasts, by End-use Industry (2020-2032) (USD Billion)
10.3.2.12 Switzerland
10.3.2.12.1 Switzerland Recycled Metals Market Estimates and Forecasts, by Source (2020-2032) (USD Billion)
10.3.2.12.2 Switzerland Recycled Metals Market Estimates and Forecasts, by Metal Type (2020-2032) (USD Billion)
10.3.2.12.3 Switzerland Recycled Metals Market Estimates and Forecasts, by End-use Industry (2020-2032) (USD Billion)
10.3.2.13 Austria
10.3.2.13.1 Austria Recycled Metals Market Estimates and Forecasts, by Source (2020-2032) (USD Billion)
10.3.2.13.2 Austria Recycled Metals Market Estimates and Forecasts, by Metal Type (2020-2032) (USD Billion)
10.3.2.13.3 Austria Recycled Metals Market Estimates and Forecasts, by End-use Industry (2020-2032) (USD Billion)
10.3.2.14 Rest of Western Europe
10.3.2.14.1 Rest of Western Europe Recycled Metals Market Estimates and Forecasts, by Source (2020-2032) (USD Billion)
10.3.2.14.2 Rest of Western Europe Recycled Metals Market Estimates and Forecasts, by Metal Type (2020-2032) (USD Billion)
10.3.2.14.3 Rest of Western Europe Recycled Metals Market Estimates and Forecasts, by End-use Industry (2020-2032) (USD Billion)
10.4 Asia Pacific
10.4.1 Trends Analysis
10.4.2 Asia Pacific Recycled Metals Market Estimates and Forecasts, by Country (2020-2032) (USD Billion)
10.4.3 Asia Pacific Recycled Metals Market Estimates and Forecasts, by Source (2020-2032) (USD Billion)
10.4.4 Asia Pacific Recycled Metals Market Estimates and Forecasts, by Metal Type (2020-2032) (USD Billion)
10.4.5 Asia Pacific Recycled Metals Market Estimates and Forecasts, by End-use Industry (2020-2032) (USD Billion)
10.4.6 China
10.4.6.1 China Recycled Metals Market Estimates and Forecasts, by Source (2020-2032) (USD Billion)
10.4.6.2 China Recycled Metals Market Estimates and Forecasts, by Metal Type (2020-2032) (USD Billion)
10.4.6.3 China Recycled Metals Market Estimates and Forecasts, by End-use Industry (2020-2032) (USD Billion)
10.4.7 India
10.4.7.1 India Recycled Metals Market Estimates and Forecasts, by Source (2020-2032) (USD Billion)
10.4.7.2 India Recycled Metals Market Estimates and Forecasts, by Metal Type (2020-2032) (USD Billion)
10.4.7.3 India Recycled Metals Market Estimates and Forecasts, by End-use Industry (2020-2032) (USD Billion)
10.4.8 Japan
10.4.8.1 Japan Recycled Metals Market Estimates and Forecasts, by Source (2020-2032) (USD Billion)
10.4.8.2 Japan Recycled Metals Market Estimates and Forecasts, by Metal Type (2020-2032) (USD Billion)
10.4.8.3 Japan Recycled Metals Market Estimates and Forecasts, by End-use Industry (2020-2032) (USD Billion)
10.4.9 South Korea
10.4.9.1 South Korea Recycled Metals Market Estimates and Forecasts, by Source (2020-2032) (USD Billion)
10.4.9.2 South Korea Recycled Metals Market Estimates and Forecasts, by Metal Type (2020-2032) (USD Billion)
10.4.9.3 South Korea Recycled Metals Market Estimates and Forecasts, by End-use Industry (2020-2032) (USD Billion)
10.4.10 Vietnam
10.4.10.1 Vietnam Recycled Metals Market Estimates and Forecasts, by Source (2020-2032) (USD Billion)
10.4.10.2 Vietnam Recycled Metals Market Estimates and Forecasts, by Metal Type (2020-2032) (USD Billion)
10.4.10.3 Vietnam Recycled Metals Market Estimates and Forecasts, by End-use Industry (2020-2032) (USD Billion)
10.4.11 Singapore
10.4.11.1 Singapore Recycled Metals Market Estimates and Forecasts, by Source (2020-2032) (USD Billion)
10.4.11.2 Singapore Recycled Metals Market Estimates and Forecasts, by Metal Type (2020-2032) (USD Billion)
10.4.11.3 Singapore Recycled Metals Market Estimates and Forecasts, by End-use Industry (2020-2032) (USD Billion)
10.4.12 Australia
10.4.12.1 Australia Recycled Metals Market Estimates and Forecasts, by Source (2020-2032) (USD Billion)
10.4.12.2 Australia Recycled Metals Market Estimates and Forecasts, by Metal Type (2020-2032) (USD Billion)
10.4.12.3 Australia Recycled Metals Market Estimates and Forecasts, by End-use Industry (2020-2032) (USD Billion)
10.4.13 Rest of Asia Pacific
10.4.13.1 Rest of Asia Pacific Recycled Metals Market Estimates and Forecasts, by Source (2020-2032) (USD Billion)
10.4.13.2 Rest of Asia Pacific Recycled Metals Market Estimates and Forecasts, by Metal Type (2020-2032) (USD Billion)
10.4.13.3 Rest of Asia Pacific Recycled Metals Market Estimates and Forecasts, by End-use Industry (2020-2032) (USD Billion)
10.5 Middle East and Africa
10.5.1 Middle East
10.5.1.1 Trends Analysis
10.5.1.2 Middle East Recycled Metals Market Estimates and Forecasts, by Country (2020-2032) (USD Billion)
10.5.1.3 Middle East Recycled Metals Market Estimates and Forecasts, by Source (2020-2032) (USD Billion)
10.5.1.4 Middle East Recycled Metals Market Estimates and Forecasts, by Metal Type (2020-2032) (USD Billion)
10.5.1.5 Middle East Recycled Metals Market Estimates and Forecasts, by End-use Industry (2020-2032) (USD Billion)
10.5.1.6 UAE
10.5.1.6.1 UAE Recycled Metals Market Estimates and Forecasts, by Source (2020-2032) (USD Billion)
10.5.1.6.2 UAE Recycled Metals Market Estimates and Forecasts, by Metal Type (2020-2032) (USD Billion)
10.5.1.6.3 UAE Recycled Metals Market Estimates and Forecasts, by End-use Industry (2020-2032) (USD Billion)
10.5.1.7 Egypt
10.5.1.7.1 Egypt Recycled Metals Market Estimates and Forecasts, by Source (2020-2032) (USD Billion)
10.5.1.7.2 Egypt Recycled Metals Market Estimates and Forecasts, by Metal Type (2020-2032) (USD Billion)
10.5.1.7.3 Egypt Recycled Metals Market Estimates and Forecasts, by End-use Industry (2020-2032) (USD Billion)
10.5.1.8 Saudi Arabia
10.5.1.8.1 Saudi Arabia Recycled Metals Market Estimates and Forecasts, by Source (2020-2032) (USD Billion)
10.5.1.8.2 Saudi Arabia Recycled Metals Market Estimates and Forecasts, by Metal Type (2020-2032) (USD Billion)
10.5.1.8.3 Saudi Arabia Recycled Metals Market Estimates and Forecasts, by End-use Industry (2020-2032) (USD Billion)
10.5.1.9 Qatar
10.5.1.9.1 Qatar Recycled Metals Market Estimates and Forecasts, by Source (2020-2032) (USD Billion)
10.5.1.9.2 Qatar Recycled Metals Market Estimates and Forecasts, by Metal Type (2020-2032) (USD Billion)
10.5.1.9.3 Qatar Recycled Metals Market Estimates and Forecasts, by End-use Industry (2020-2032) (USD Billion)
10.5.1.10 Rest of Middle East
10.5.1.10.1 Rest of Middle East Recycled Metals Market Estimates and Forecasts, by Source (2020-2032) (USD Billion)
10.5.1.10.2 Rest of Middle East Recycled Metals Market Estimates and Forecasts, by Metal Type (2020-2032) (USD Billion)
10.5.1.10.3 Rest of Middle East Recycled Metals Market Estimates and Forecasts, by End-use Industry (2020-2032) (USD Billion)
10.5.2 Africa
10.5.2.1 Trends Analysis
10.5.2.2 Africa Recycled Metals Market Estimates and Forecasts, by Country (2020-2032) (USD Billion)
10.5.2.3 Africa Recycled Metals Market Estimates and Forecasts, by Source (2020-2032) (USD Billion)
10.5.2.4 Africa Recycled Metals Market Estimates and Forecasts, by Metal Type (2020-2032) (USD Billion)
10.5.2.5 Africa Recycled Metals Market Estimates and Forecasts, by End-use Industry (2020-2032) (USD Billion)
10.5.2.6 South Africa
10.5.2.6.1 South Africa Recycled Metals Market Estimates and Forecasts, by Source (2020-2032) (USD Billion)
10.5.2.6.2 South Africa Recycled Metals Market Estimates and Forecasts, by Metal Type (2020-2032) (USD Billion)
10.5.2.6.3 South Africa Recycled Metals Market Estimates and Forecasts, by End-use Industry (2020-2032) (USD Billion)
10.5.2.7 Nigeria
10.5.2.7.1 Nigeria Recycled Metals Market Estimates and Forecasts, by Source (2020-2032) (USD Billion)
10.5.2.7.2 Nigeria Recycled Metals Market Estimates and Forecasts, by Metal Type (2020-2032) (USD Billion)
10.5.2.7.3 Nigeria Recycled Metals Market Estimates and Forecasts, by End-use Industry (2020-2032) (USD Billion)
10.5.2.8 Rest of Africa
10.5.2.8.1 Rest of Africa Recycled Metals Market Estimates and Forecasts, by Source (2020-2032) (USD Billion)
10.5.2.8.2 Rest of Africa Recycled Metals Market Estimates and Forecasts, by Metal Type (2020-2032) (USD Billion)
10.5.2.8.3 Rest of Africa Recycled Metals Market Estimates and Forecasts, by End-use Industry (2020-2032) (USD Billion)
10.6 Latin America
10.6.1 Trends Analysis
10.6.2 Latin America Recycled Metals Market Estimates and Forecasts, by Country (2020-2032) (USD Billion)
10.6.3 Latin America Recycled Metals Market Estimates and Forecasts, by Source (2020-2032) (USD Billion)
10.6.4 Latin America Recycled Metals Market Estimates and Forecasts, by Metal Type (2020-2032) (USD Billion)
10.6.5 Latin America Recycled Metals Market Estimates and Forecasts, by End-use Industry (2020-2032) (USD Billion)
10.6.6 Brazil
10.6.6.1 Brazil Recycled Metals Market Estimates and Forecasts, by Source (2020-2032) (USD Billion)
10.6.6.2 Brazil Recycled Metals Market Estimates and Forecasts, by Metal Type (2020-2032) (USD Billion)
10.6.6.3 Brazil Recycled Metals Market Estimates and Forecasts, by End-use Industry (2020-2032) (USD Billion)
10.6.7 Argentina
10.6.7.1 Argentina Recycled Metals Market Estimates and Forecasts, by Source (2020-2032) (USD Billion)
10.6.7.2 Argentina Recycled Metals Market Estimates and Forecasts, by Metal Type (2020-2032) (USD Billion)
10.6.7.3 Argentina Recycled Metals Market Estimates and Forecasts, by End-use Industry (2020-2032) (USD Billion)
10.6.8 Colombia
10.6.8.1 Colombia Recycled Metals Market Estimates and Forecasts, by Source (2020-2032) (USD Billion)
10.6.8.2 Colombia Recycled Metals Market Estimates and Forecasts, by Metal Type (2020-2032) (USD Billion)
10.6.8.3 Colombia Recycled Metals Market Estimates and Forecasts, by End-use Industry (2020-2032) (USD Billion)
10.6.9 Rest of Latin America
10.6.9.1 Rest of Latin America Recycled Metals Market Estimates and Forecasts, by Source (2020-2032) (USD Billion)
10.6.9.2 Rest of Latin America Recycled Metals Market Estimates and Forecasts, by Metal Type (2020-2032) (USD Billion)
10.6.9.3 Rest of Latin America Recycled Metals Market Estimates and Forecasts, by End-use Industry (2020-2032) (USD Billion)
11. Company Profiles
11.1 Nucor Corporation
11.1.1 Company Overview
11.1.2 Financial
11.1.3 Products/ Services Offered
11.1.4 SWOT Analysis
11.2 Sims Metal Management Ltd.
11.2.1 Company Overview
11.2.2 Financial
11.2.3 Products/ Services Offered
11.2.4 SWOT Analysis
11.3 Novelis Inc.
11.3.1 Company Overview
11.3.2 Financial
11.3.3 Products/ Services Offered
11.3.4 SWOT Analysis
11.4 Tata Steel
11.4.1 Company Overview
11.4.2 Financial
11.4.3 Products/ Services Offered
11.4.4 SWOT Analysis
11.5 Aurubis AG
11.5.1 Company Overview
11.5.2 Financial
11.5.3 Products/ Services Offered
11.5.4 SWOT Analysis
11.6 European Metal Recycling Ltd.
11.6.1 Company Overview
11.6.2 Financial
11.6.3 Products/ Services Offered
11.6.4 SWOT Analysis
11.7 Schnitzer Steel Industries, Inc.
11.7.1 Company Overview
11.7.2 Financial
11.7.3 Products/ Services Offered
11.7.4 SWOT Analysis
11.8 GFG Alliance
11.8.1 Company Overview
11.8.2 Financial
11.8.3 Products/ Services Offered
11.8.4 SWOT Analysis
11.9 Commercial Metals Company
11.9.1 Company Overview
11.9.2 Financial
11.9.3 Products/ Services Offered
11.9.4 SWOT Analysis
11.10 Steel Dynamics Inc.
11.10.1 Company Overview
11.10.2 Financial
11.10.3 Products/ Services Offered
11.10.4 SWOT Analysis
12. Use Cases and Best Practices
13. Conclusion
An accurate research report requires proper strategizing as well as implementation. There are multiple factors involved in the completion of good and accurate research report and selecting the best methodology to compete the research is the toughest part. Since the research reports we provide play a crucial role in any company’s decision-making process, therefore we at SNS Insider always believe that we should choose the best method which gives us results closer to reality. This allows us to reach at a stage wherein we can provide our clients best and accurate investment to output ratio.
Each report that we prepare takes a timeframe of 350-400 business hours for production. Starting from the selection of titles through a couple of in-depth brain storming session to the final QC process before uploading our titles on our website we dedicate around 350 working hours. The titles are selected based on their current market cap and the foreseen CAGR and growth.
The 5 steps process:
Step 1: Secondary Research:
Secondary Research or Desk Research is as the name suggests is a research process wherein, we collect data through the readily available information. In this process we use various paid and unpaid databases which our team has access to and gather data through the same. This includes examining of listed companies’ annual reports, Journals, SEC filling etc. Apart from this our team has access to various associations across the globe across different industries. Lastly, we have exchange relationships with various university as well as individual libraries.

Step 2: Primary Research
When we talk about primary research, it is a type of study in which the researchers collect relevant data samples directly, rather than relying on previously collected data. This type of research is focused on gaining content specific facts that can be sued to solve specific problems. Since the collected data is fresh and first hand therefore it makes the study more accurate and genuine.
We at SNS Insider have divided Primary Research into 2 parts.
Part 1 wherein we interview the KOLs of major players as well as the upcoming ones across various geographic regions. This allows us to have their view over the market scenario and acts as an important tool to come closer to the accurate market numbers. As many as 45 paid and unpaid primary interviews are taken from both the demand and supply side of the industry to make sure we land at an accurate judgement and analysis of the market.
This step involves the triangulation of data wherein our team analyses the interview transcripts, online survey responses and observation of on filed participants. The below mentioned chart should give a better understanding of the part 1 of the primary interview.

Part 2: In this part of primary research the data collected via secondary research and the part 1 of the primary research is validated with the interviews from individual consultants and subject matter experts.
Consultants are those set of people who have at least 12 years of experience and expertise within the industry whereas Subject Matter Experts are those with at least 15 years of experience behind their back within the same space. The data with the help of two main processes i.e., FGDs (Focused Group Discussions) and IDs (Individual Discussions). This gives us a 3rd party nonbiased primary view of the market scenario making it a more dependable one while collation of the data pointers.
Step 3: Data Bank Validation
Once all the information is collected via primary and secondary sources, we run that information for data validation. At our intelligence centre our research heads track a lot of information related to the market which includes the quarterly reports, the daily stock prices, and other relevant information. Our data bank server gets updated every fortnight and that is how the information which we collected using our primary and secondary information is revalidated in real time.

Step 4: QA/QC Process
After all the data collection and validation our team does a final level of quality check and quality assurance to get rid of any unwanted or undesired mistakes. This might include but not limited to getting rid of the any typos, duplication of numbers or missing of any important information. The people involved in this process include technical content writers, research heads and graphics people. Once this process is completed the title gets uploader on our platform for our clients to read it.
Step 5: Final QC/QA Process:
This is the last process and comes when the client has ordered the study. In this process a final QA/QC is done before the study is emailed to the client. Since we believe in giving our clients a good experience of our research studies, therefore, to make sure that we do not lack at our end in any way humanly possible we do a final round of quality check and then dispatch the study to the client.
Key Segments:
By Source
Industrial Scrap
Post-consumer Scrap
By Metal Type
Ferrous
Steel
Iron
Others
Non-Ferrous
Aluminum
Copper
Lead
Others
By End-use Industry
Automotive
Construction
Electrical & Electronics
Packaging
Industrial Machinery
Consumer Goods
Others
Request for Segment Customization as per your Business Requirement: Segment Customization Request
Regional Coverage:
North America
US
Canada
Mexico
Europe
Eastern Europe
Poland
Romania
Hungary
Turkey
Rest of Eastern Europe
Western Europe
Germany
France
UK
Italy
Spain
Netherlands
Switzerland
Austria
Rest of Western Europe
Asia Pacific
China
India
Japan
South Korea
Vietnam
Singapore
Australia
Rest of Asia Pacific
Middle East & Africa
Middle East
UAE
Egypt
Saudi Arabia
Qatar
Rest of Middle East
Africa
Nigeria
South Africa
Rest of Africa
Latin America
Brazil
Argentina
Colombia
Rest of Latin America
Request for Country Level Research Report: Country Level Customization Request
Available Customization
With the given market data, SNS Insider offers customization as per the company’s specific needs. The following customization options are available for the report:
Product Analysis
Criss-Cross segment analysis (e.g. Product X Application)
Product Matrix which gives a detailed comparison of product portfolio of each company
Geographic Analysis
Additional countries in any of the regions
Company Information
Detailed analysis and profiling of additional market players (Up to five)
The Xylene Market Size was valued at USD 31.88 Billion in 2023 and is expected to reach USD 63.65 Billion by 2032, growing at a CAGR of 7.99% from 2024-2032.
The Mirror Coatings Market Size was USD 764.3 million in 2023 and is expected to reach USD 1291.2 million by 2032 and grow at a CAGR of 6.0% by 2024-2032.
Synthetic Paper Market was valued at USD 909.12 million in 2023 and is expected to reach USD 2023.96 million by 2032, growing at a CAGR of 9.50% from 2024-2032.
The OEM Insulation Market size was valued at USD 38.80 Billion in 2023 and is expected to reach USD 62.80 Billion by 2032, growing at a CAGR of 5.50% over the forecast period 2024-2032.
Steel Wire Market was valued at USD 102.1 billion in 2023 and is expected to reach USD 167.4 billion by 2032, growing at a CAGR of 5.7% from 2024 to 2032.
The Zeolite Market Size was valued at USD 6.3 billion in 2023 and is expected to reach USD 9.3 billion by 2032 and grow at a CAGR of 4.4% by 2024-2032.

Hi! Click one of our member below to chat on Phone
© 2025 All Rights Reserved by SNS Insider Pvt Ltd


