Get More Information on Recycled Carbon Fiber Market - Request Sample Report
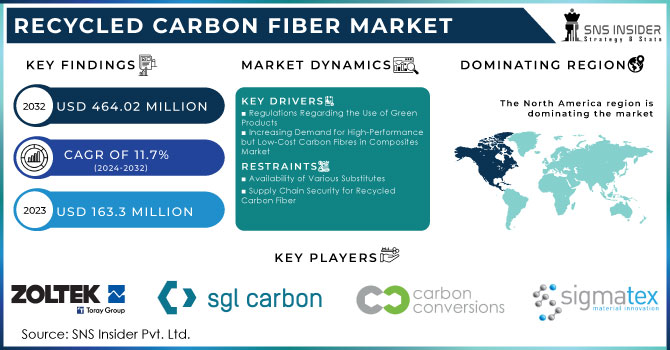
The Recycled Carbon Fiber Market was worth USD 163.3 million in 2023 and is expected to grow to USD 464.02 million by 2032, with a CAGR of 11.7% in the forecast period 2024-2032.
The Recycled Carbon Fiber Market has developed strongly due to environmental, economic, and technological changes. With industries tending toward sustainability, the demand for recycled carbon fiber recovered from carbon fiber composites—is surging due to increased environmental awareness and circular economy practices. These composites, applied in aerospace, automotive, and sports equipment for their high strength-to-weight ratio, are difficult to recycle, but new chemical and thermal processes have enhanced efficiency and feasibility.
Economically, it provides a cheaper route to virgin fiber, reducing the production cost while meeting environmental regulations. Companies like ELG Carbon Fiber and Carbicrete have been doing this in practice to reap the economic benefits of recycling, reprocessing, and using reclaimed fibers into new products. This technological innovation further upgrades the quality and properties of recycled carbon fiber, hence increasing its use in high-performance applications. For example, carmakers like BMW and Mercedes-Benz already use it in vehicles to prove sustainability while boosting performance. Many companies, among them a startup named Mallinda, have developed low-cost, closed-loop recycling processes that recover composite polymers and carbon fiber as well, using reversible chemistry to reduce waste.
These drivers are moreover powered by regulatory pressures and sustainability goals: governments enforce stricter environmental regulations and set ambitious targets for waste reduction. Policies such as the Circular Economy Action Plan by the EU and initiatives by the US EPA encourage the uptake of recycled materials, thereby increasing demand for recycled carbon fiber.
The aerospace industry is the first application that realizes real value from recycled carbon fiber by adding the material to aircraft components, meeting high-quality standards while reducing the associated environmental impacts. Firms like Airbus make it very clear that the material can stand up to some of the toughest industry specifications. As consumers become more environmentally conscious, they will opt for green purchasing of products that reduce waste.
The environmental consciousness, economic benefits, innovative technology, and regulatory pressures all contribute to the growth of the recycled carbon fiber market. Developments in recycling technologies have made it possible to efficiently reclaim carbon fibers, reducing waste and production costs. Aerospace and Automotive industries have pioneered the use of these materials, thereby remaining sustainable with high performance. With growing development in this market in the future, its integration will spread, hence powering a new circular economy.
Market Dynamics:
Drivers:
Regulations Regarding the Use of Green Products
The regulations regarding green product usage drive the Recycled Carbon Fiber Market, making industries embrace a more sustainable operation. From the government to other regulatory bodies across the world, strict environmental regulations have been framed to reduce carbon footprints and promote the usage of eco-friendly materials. For instance, the Circular Economy Action Plan by the European Union encourages greater recycling and reusing of materials for the benefit of industries that make use of recycled carbon fiber material. The United States Environmental Protection Agency implements source reduction and recycled material usage policies in the manufacturing industries. This set of policies strives not only to reduce harm to the environment but also to prompt new technological developments regarding recycling and clean methods of manufacture. Companies have enough reasons to comply: avoiding penalties and meeting consumer demand for "green" products. For example, Airbus uses recycled carbon fiber in parts of its aircraft to comply with strict European Union environmental standards, while BMW and Mercedes-Benz use them in their automobiles to serve regulations and demands from environment-conscious customers. Such regulatory pressures guarantee stable demand for recycled carbon fiber, stimulating market growth and further promoting the development of recycling technologies.
Increasing Demand for High-Performance but Low-Cost Carbon Fibres in Composites Market
Demand for low-cost and high-performance carbon fibers within the composites market is expected to be one of the primary drivers of the recycled carbon fiber market. The aerospace, automotive, and sports equipment sectors have been under immense pressure to find materials that allow very good strength and durability without huge prices similar to that of virgin carbon fibers. Recycled carbon fibers provide a rather attractive solution by delivering comparable performance at a fraction of the price. For example, car manufacturers like BMW and Ford are using recycled carbon fibers in car parts, which increase the strength, reduce the weight, but still remain at more affordable production prices. Such cost efficiencies would allow producers to come up with high-performance products but remain economically viable as well. More significantly, businesses have also developed processes through which carbon fibers can be reclaimed from end-of-use products—thereby driving down the costs significantly and making high-performance composites accessible. The fact that the fibers can be sold at a more reasonable price while reaching the targets set for sustainability makes them more attractive to consumers sensitive to the environment. This dual benefit of performance and affordability assures that recycled carbon fibers, with growing favor in the composites market, fuel demand and spur innovations in recycling technologies.
Restraints:
Availability of Various Substitutes
The ready availability of various alternatives is one major constraint to the Recycled Carbon Fiber Market. Materials such as fiberglass, natural fibers, and even advanced polymers have provided an alternative use for recycled carbon fibers with similar properties at varying prices. For example, the predominance of fiberglass in both the automotive and construction industries is due to its lower price, with adequate performance for some applications without the high strength-to-weight ratio of carbon fiber. Another fast-growing competition will come from natural fibers like hemp and flax. Renewable, and biodegradable, these seem especially in vogue among 'green' circles. Other alternatives come from advanced polymers—high-performance thermoplastics have several benefits connected with ease of processing and lower costs. For example, companies manufacturing sporting goods might be using substitute materials like fiberglass or advanced polymers to stay competitive in product pricing and yet meet the performance standards expected of them. This proclivity toward substitutes could result in some limitations in the use of these recycled carbon fibers, mainly in the cost-sensitive markets where such a premium price for a composite made of carbon fiber—recycled or not—could not be justified. Industries requiring less stringent performance may find these substitutes more than adequate, which further restrains the widespread acceptance of recycled carbon fiber. The market has to constantly innovate to improve the cost-effectiveness and performance characteristics of recycled carbon fibers so that it can effectively compete with these easily available alternates.
Supply Chain Security for Recycled Carbon Fiber
Opportunity:
Increased interest in lightweight and recyclable materials in the automotive and transport industry nowadays.
New demand from developing countries.
By Source
Automotive scrap contributed to this majorly since the emphasis by the automotive industry on lightweight materials and sustainability secured a gigantic market share of 50% in 2023. Aeronautics plays a huge role in the market with their high requirement for high-performance materials. "Other" sources, including wind energy, marine, and construction, would make up a smaller but growing component of the market as the awareness raised in these industries results in the realization of the benefits of recycled carbon fiber. In summary, the source drives huge variations in the market size of recycled carbon fiber, where it realizes great placements in auto and aero scrap and the potential for growth in other sectors as sustainability considerations continue to drive adoption.
By Type
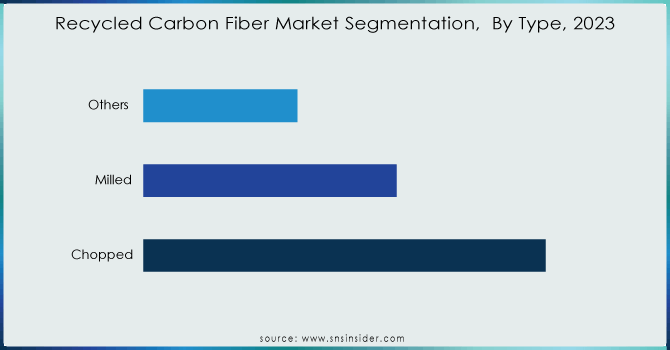
Chopped carbon fiber holds a share of around 45% in 2023 because it is versatile, strong, and broadly used to reinforce plastics or composites. Milled carbon fiber is preferred in fine, consistent reinforcement applications and hence enjoys a decent market share. Carbon fiber mat represents its segment because of its application in high-performance lightweight applications. The "others" category, including miscellaneous forms and applications, assumes a small but growing share. Globally, the market size of such products mirrors a diverse, changing industry that strives to meet the demand for low-cost, sustainable materials in the automotive, aerospace, and renewable energy industries.
Need any customization research on Recycled Carbon Fiber Market - Enquiry Now
By Recycling Method
The mechanical recycling segment dominated the recycled carbon fiber market in 2023 with a revenue share of 70%. Mechanical recycling is primarily based on shredding, milling, grinding, and crushing of composite parts into compact pieces that may again be powdered. After that, sieving of powdered products is usually done to achieve resin-rich and fiber-rich products. The recovery ratio of the mechanical recycling route for carbon fiber is greater than that of traditional thermolysis and two-step microwave methods. In the process, the epoxy resin of carbon fiber decays first, while char oxidation occurs in the second step. This step is utilized to produce virgin polymer and assists in diminishing greenhouse gases, plastic pollution, and waste. These factors help the segment grow.
Regional Analysis
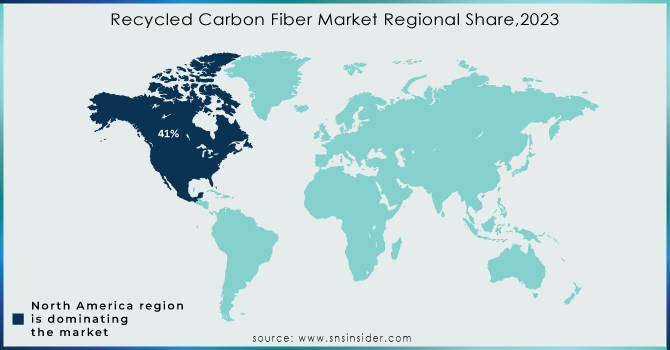
In 2023, North America dominated the recycled carbon fiber market with a revenue share of 41% in 2023 due to advanced manufacturing capabilities, a strong automotive and aerospace sector, and stringent yet progressively evolving regulatory frameworks. The United States, in particular, fuels the growth of this market with massive investments in recycling technologies and sustainability. For instance, leading vehicle companies like Ford and General Motors use carbon fiber recycled material for a number of automobile parts to increase performance without compromising the increasingly stringent environmental regulations. Aerospace industries, such as leaders Boeing and Airbus, with a large North American footprint, are utilizing recycled carbon fiber to hit demanding industry standards while lightening the impact on the environment. In addition, it has very good infrastructure for recycling and is supported by policies in the form of tax benefits for the use of recycled materials, or stringent emission regulations. With the presence of major recycling technology companies and leading research institutions in North America, the cycle of innovation and increasing efficiency in carbon fiber recycling is inevitable. The focus of industries, along with regulatory support and technological development, makes North America the continent leading in the recycled carbon fiber market.
The Asia-Pacific region, with a revenue share of 35%, is the fastest-growing region in the recycled carbon fiber market, as it is rapidly industrializing with growing industries of automobiles and aerospace, along with increasing environmental awareness. Huge investments in manufacturing and infrastructure development have made countries such as China and Japan front-runners in this growth. On environmental policy generally, China has always been quite at the forefront in terms of advocating for the use of recycled material. Japan, being a technologically inclined country itself, has recorded high growth in the use of recycled carbon fiber within its aerospace industry, especially firms like Mitsubishi Heavy Industries that manufacture aircraft parts. Besides, the reduced production cost and growing concern about the reduction of industrial wastes has also increased the rate of adoption of recycled carbon fibers within the region. Coupled with the rapid economic development in the region, enabling policies, and awareness raising on sustainability issues, Asia-Pacific shall turn into the fastest-growing market for recycled carbon fibers.
RECENT DEVELOPMENTS
February 2024: By using recycled carbon fiber, Thermolysis makes its debut of recyclable products at JEC World. Launches the RCF brand for zero-waste ambition and complete carbon fiber recycling. It helps in producing carbon fiber reuse and recycling of the carbon fibers in the production of bicycle accessories like fenders, light stands, cycling shoe boards, seats, pads, and bottle cages. Such produced products have excellent mechanical strength characteristics and are lightweight.
January 2024- Vartega, a specialist in carbon fiber material recycling, garnered $10 million with equity financing led by Diamond Edge Ventures. This helps in a sustainable future.
October 2023- Apply Carbon initiated a mass recycled carbon production facility. Apply Carbon has a capacity of 4000 metric tons and has completed the task of a fully automated production plant for recycled carbon fiber.
July 2023: The US Department of Energy announced a wind turbine materials recycling prize competition. Most of the materials used in wind turbines can be economically recycled, including fiberglass and carbon fiber.
Shocker composites LLC, ZOLTEK Corporation, Sigmatex, Carbon Fiber Recycling, SGL Carbon, Hadeg, Carbon Conversions, ELG Carbon Fibre Ltd, CFK Valley Stade Recycling GmbH & Co. KG, PROCOTEX CORPORATION,Teijin Limited, Vartega Inc, and other players.
Report Attributes | Details |
---|---|
Market Size in 2023 | US$ 163.3 Million |
Market Size by 2032 | US$ 464.0 Million |
CAGR | CAGR of 11.7% From 2024 to 2032 |
Base Year | 2023 |
Forecast Period | 2024-2032 |
Historical Data | 2020-2022 |
Report Scope & Coverage | Market Size, Segments Analysis, Competitive Landscape, Regional Analysis, DROC & SWOT Analysis, Forecast Outlook |
Key Segments | •By Source (Aerospace scrap, Automotive scrap, Others) •By Type (Chopped, Milled, Others) •By Recycling Method (Mechanical Recycling, Chemical Recycling, Pyrolysis, Solvolysis, Others) •By End Use Industry (Automotive & Transportation, Consumer Goods, Industrial, Marine, Aerospace & Defense, Wind Energy, Sports & Leisure, Construction, Electronics, Others) |
Regional Analysis/Coverage | North America (US, Canada, Mexico), Europe (Eastern Europe [Poland, Romania, Hungary, Turkey, Rest of Eastern Europe] Western Europe] Germany, France, UK, Italy, Spain, Netherlands, Switzerland, Austria, Rest of Western Europe]), Asia Pacific (China, India, Japan, South Korea, Vietnam, Singapore, Australia, Rest of Asia Pacific), Middle East & Africa (Middle East [UAE, Egypt, Saudi Arabia, Qatar, Rest of Middle East], Africa [Nigeria, South Africa, Rest of Africa], Latin America (Brazil, Argentina, Colombia, Rest of Latin America) |
Company Profiles | Shocker composites LLC, ZOLTEK Corporation, Sigmatex, Carbon Fiber Recycling, SGL Carbon, Hadeg, Carbon Conversions, ELG Carbon Fibre Ltd, CFK Valley Stade Recycling GmbH & Co. KG, PROCOTEX CORPORATION, Teijin Limited, Vartega Inc |
Key Drivers | •Regulations Regarding the Use of Green Products •Increasing Demand for High-Performance but Low-Cost Carbon Fibres in Composites Market |
Restraints | •Availability of Various Substitutes •Supply Chain Security for Recycled Carbon Fiber |
Ans: The North American region dominated the Recycled Carbon Fiber Market holding the largest market share of about 41% during the forecast period.
Ans: Supply chain security for recycled carbon fiber hamper the growth of the market.
Ans: Regulations regarding the use of green products and increasing demand for high-performance but low-cost carbon fibres in the composites market boost the growth of the Recycled Carbon Fiber Market
Ans: Recycled Carbon Fiber Market size was USD 163.3 million in 2023 and is expected to reach USD 464.02 million by 2032.
Ans: The Recycled Carbon Fiber Market is expected to grow at a CAGR of 11.7%.
TABLE OF CONTENTS
1. Introduction
1.1 Market Definition
1.2 Scope
1.3 Research Assumptions
2. Industry Flowchart
3. Research Methodology
4. Market Dynamics
4.1 Drivers
4.2 Restraints
4.3 Opportunities
4.4 Challenges
5. Porter’s 5 Forces Model
6. Pest Analysis
7. Recycled Carbon Fiber Market Segmentation, by Source
7.1 Introduction
7.2 Aerospace scrap
7.3 Automotive scrap
7.4 Others
8. Recycled Carbon Fiber Market Segmentation, by Type
8.1 Introduction
8.2 Chopped
8.3 Milled
8.4 Others
9. Recycled Carbon Fiber Market Segmentation, by Recycling Method
9.1 Introduction
9.2 Mechanical Recycling
9.3 Chemical Recycling
9.4 Pyrolysis
9.5 Solvolysis
9.6 Others
10. Recycled Carbon Fiber Market Segmentation, by End Use Industry
10.1 Introduction
10.2 Automotive & transportation
10.3 Consumer Goods
10.4 Industrial
10.5 Marine
10.6 Aerospace & Defense
10.7 Wind Energy
10.8 Sports & Leisure
10.9 Construction
10.10 Electronics
10.11 Others
11. Regional Analysis
11.1 Introduction
11.2 North America
11.2.1 Trend Analysis
11.2.2 North America Recycled Carbon Fiber Market by Country
11.2.3 North America Recycled Carbon Fiber Market by Source
11.2.4 North America Recycled Carbon Fiber Market by Type
11.2.5 North America Recycled Carbon Fiber Market by Recycling Method
11.2.6 North America Recycled Carbon Fiber Market by End Use Industry
11.2.7 USA
11.2.7.1 USA Recycled Carbon Fiber Market by Source
11.2.7.2 USA Recycled Carbon Fiber Market by Type
11.2.7.3 USA Recycled Carbon Fiber Market by Recycling Method
11.2.7.4 USA Recycled Carbon Fiber Market by End Use Industry
11.2.8 Canada
11.2.8.1 Canada Recycled Carbon Fiber Market by Source
11.2.8.2 Canada Recycled Carbon Fiber Market by Type
11.2.8.3 Canada Recycled Carbon Fiber Market by Recycling Method
11.2.8.4 Canada Recycled Carbon Fiber Market by End Use Industry
11.2.9 Mexico
11.2.9.1 Mexico Recycled Carbon Fiber Market by Source
11.2.9.2 Mexico Recycled Carbon Fiber Market by Type
11.2.9.3 Mexico Recycled Carbon Fiber Market by Recycling Method
11.2.9.4 Mexico Recycled Carbon Fiber Market by End Use Industry
11.3 Europe
11.3.1 Trend Analysis
11.3.2 Eastern Europe
11.3.2.1 Eastern Europe Recycled Carbon Fiber Market by Country
11.3.2.2 Eastern Europe Recycled Carbon Fiber Market by Source
11.3.2.3 Eastern Europe Recycled Carbon Fiber Market by Type
11.3.2.4 Eastern Europe Recycled Carbon Fiber Market by Recycling Method
11.3.2.5 Eastern Europe Recycled Carbon Fiber Market by End Use Industry
11.3.2.6 Poland
11.3.2.6.1 Poland Recycled Carbon Fiber Market by Source
11.3.2.6.2 Poland Recycled Carbon Fiber Market by Type
11.3.2.6.3 Poland Recycled Carbon Fiber Market by Recycling Method
11.3.2.6.4 Poland Recycled Carbon Fiber Market by End Use Industry
11.3.2.7 Romania
11.3.2.7.1 Romania Recycled Carbon Fiber Market by Source
11.3.2.7.2 Romania Recycled Carbon Fiber Market by Type
11.3.2.7.3 Romania Recycled Carbon Fiber Market by Recycling Method
11.3.2.7.4 Romania Recycled Carbon Fiber Market by End Use Industry
11.3.2.8 Hungary
11.3.2.8.1 Hungary Recycled Carbon Fiber Market by Source
11.3.2.8.2 Hungary Recycled Carbon Fiber Market by Type
11.3.2.8.3 Hungary Recycled Carbon Fiber Market by Recycling Method
11.3.2.8.4 Hungary Recycled Carbon Fiber Market by End Use Industry
11.3.2.9 Turkey
11.3.2.9.1 Turkey Recycled Carbon Fiber Market by Source
11.3.2.9.2 Turkey Recycled Carbon Fiber Market by Type
11.3.2.9.3 Turkey Recycled Carbon Fiber Market by Recycling Method
11.3.2.9.4 Turkey Recycled Carbon Fiber Market by End Use Industry
11.3.2.10 Rest of Eastern Europe
11.3.2.10.1 Rest of Eastern Europe Recycled Carbon Fiber Market by Source
11.3.2.10.2 Rest of Eastern Europe Recycled Carbon Fiber Market by Type
11.3.2.10.3 Rest of Eastern Europe Recycled Carbon Fiber Market by Recycling Method
11.3.2.10.4 Rest of Eastern Europe Recycled Carbon Fiber Market by End Use Industry
11.3.3 Western Europe
11.3.3.1 Western Europe Recycled Carbon Fiber Market by Country
11.3.3.2 Western Europe Recycled Carbon Fiber Market by Source
11.3.3.3 Western Europe Recycled Carbon Fiber Market by Type
11.3.3.4 Western Europe Recycled Carbon Fiber Market by Recycling Method
11.3.3.5 Western Europe Recycled Carbon Fiber Market by End Use Industry
11.3.3.6 Germany
11.3.3.6.1 Germany Recycled Carbon Fiber Market by Source
11.3.3.6.2 Germany Recycled Carbon Fiber Market by Type
11.3.3.6.3 Germany Recycled Carbon Fiber Market by Recycling Method
11.3.3.6.4 Germany Recycled Carbon Fiber Market by End Use Industry
11.3.3.7 France
11.3.3.7.1 France Recycled Carbon Fiber Market by Source
11.3.3.7.2 France Recycled Carbon Fiber Market by Type
11.3.3.7.3 France Recycled Carbon Fiber Market by Recycling Method
11.3.3.7.4 France Recycled Carbon Fiber Market by End Use Industry
11.3.3.8 UK
11.3.3.8.1 UK Recycled Carbon Fiber Market by Source
11.3.3.8.2 UK Recycled Carbon Fiber Market by Type
11.3.3.8.3 UK Recycled Carbon Fiber Market by Recycling Method
11.3.3.8.4 UK Recycled Carbon Fiber Market by End Use Industry
11.3.3.9 Italy
11.3.3.9.1 Italy Recycled Carbon Fiber Market by Source
11.3.3.9.2 Italy Recycled Carbon Fiber Market by Type
11.3.3.9.3 Italy Recycled Carbon Fiber Market by Recycling Method
11.3.3.9.4 Italy Recycled Carbon Fiber Market by End Use Industry
11.3.3.10 Spain
11.3.3.10.1 Spain Recycled Carbon Fiber Market by Source
11.3.3.10.2 Spain Recycled Carbon Fiber Market by Type
11.3.3.10.3 Spain Recycled Carbon Fiber Market by Recycling Method
11.3.3.10.4 Spain Recycled Carbon Fiber Market by End Use Industry
11.3.3.11 Netherlands
11.3.3.11.1 Netherlands Recycled Carbon Fiber Market by Source
11.3.3.11.2 Netherlands Recycled Carbon Fiber Market by Type
11.3.3.11.3 Netherlands Recycled Carbon Fiber Market by Recycling Method
11.3.3.11.4 Netherlands Recycled Carbon Fiber Market by End Use Industry
11.3.3.12 Switzerland
11.3.3.12.1 Switzerland Recycled Carbon Fiber Market by Source
11.3.3.12.2 Switzerland Recycled Carbon Fiber Market by Type
11.3.3.12.3 Switzerland Recycled Carbon Fiber Market by Recycling Method
11.3.3.12.4 Switzerland Recycled Carbon Fiber Market by End Use Industry
11.3.3.13 Austria
11.3.3.13.1 Austria Recycled Carbon Fiber Market by Source
11.3.3.13.2 Austria Recycled Carbon Fiber Market by Type
11.3.3.13.3 Austria Recycled Carbon Fiber Market by Recycling Method
11.3.3.13.4 Austria Recycled Carbon Fiber Market by End Use Industry
11.3.3.14 Rest of Western Europe
11.3.3.14.1 Rest of Western Europe Recycled Carbon Fiber Market by Source
11.3.3.14.2 Rest of Western Europe Recycled Carbon Fiber Market by Type
11.3.3.14.3 Rest of Western Europe Recycled Carbon Fiber Market by Recycling Method
11.3.3.14.4 Rest of Western Europe Recycled Carbon Fiber Market by End Use Industry
11.4 Asia-Pacific
11.4.1 Trend Analysis
11.4.2 Asia-Pacific Recycled Carbon Fiber Market by Country
11.4.3 Asia-Pacific Recycled Carbon Fiber Market by Source
11.4.4 Asia-Pacific Recycled Carbon Fiber Market by Type
11.4.5 Asia-Pacific Recycled Carbon Fiber Market by Recycling Method
11.4.6 Asia-Pacific Recycled Carbon Fiber Market by End Use Industry
11.4.7 China
11.4.7.1 China Recycled Carbon Fiber Market by Source
11.4.7.2 China Recycled Carbon Fiber Market by Type
11.4.7.3 China Recycled Carbon Fiber Market by Recycling Method
11.4.7.4 China Recycled Carbon Fiber Market by End Use Industry
11.4.8 India
11.4.8.1 India Recycled Carbon Fiber Market by Source
11.4.8.2 India Recycled Carbon Fiber Market by Type
11.4.8.3 India Recycled Carbon Fiber Market by Recycling Method
11.4.8.4 India Recycled Carbon Fiber Market by End Use Industry
11.4.9 Japan
11.4.9.1 Japan Recycled Carbon Fiber Market by Source
11.4.9.2 Japan Recycled Carbon Fiber Market by Type
11.4.9.3 Japan Recycled Carbon Fiber Market by Recycling Method
11.4.9.4 Japan Recycled Carbon Fiber Market by End Use Industry
11.4.10 South Korea
11.4.10.1 South Korea Recycled Carbon Fiber Market by Source
11.4.10.2 South Korea Recycled Carbon Fiber Market by Type
11.4.10.3 South Korea Recycled Carbon Fiber Market by Recycling Method
11.4.10.4 South Korea Recycled Carbon Fiber Market by End Use Industry
11.4.11 Vietnam
11.4.11.1 Vietnam Recycled Carbon Fiber Market by Source
11.4.11.2 Vietnam Recycled Carbon Fiber Market by Type
11.4.11.3 Vietnam Recycled Carbon Fiber Market by Recycling Method
11.4.11.4 Vietnam Recycled Carbon Fiber Market by End Use Industry
11.4.12 Singapore
11.4.12.1 Singapore Recycled Carbon Fiber Market by Source
11.4.12.2 Singapore Recycled Carbon Fiber Market by Type
11.4.12.3 Singapore Recycled Carbon Fiber Market by Recycling Method
11.4.12.4 Singapore Recycled Carbon Fiber Market by End Use Industry
11.4.13 Australia
11.4.13.1 Australia Recycled Carbon Fiber Market by Source
11.4.13.2 Australia Recycled Carbon Fiber Market by Type
11.4.13.3 Australia Recycled Carbon Fiber Market by Recycling Method
11.4.13.4 Australia Recycled Carbon Fiber Market by End Use Industry
11.4.14 Rest of Asia-Pacific
11.4.14.1 Rest of Asia-Pacific Recycled Carbon Fiber Market by Source
11.4.14.2 Rest of Asia-Pacific Recycled Carbon Fiber Market by Type
11.4.14.3 Rest of Asia-Pacific Recycled Carbon Fiber Market by Recycling Method
11.4.14.4 Rest of Asia-Pacific Recycled Carbon Fiber Market by End Use Industry
11.5 Middle East & Africa
11.5.1 Trend Analysis
11.5.2 Middle East
11.5.2.1 Middle East Recycled Carbon Fiber Market by Country
11.5.2.2 Middle East Recycled Carbon Fiber Market by Source
11.5.2.3 Middle East Recycled Carbon Fiber Market by Type
11.5.2.4 Middle East Recycled Carbon Fiber Market by Recycling Method
11.5.2.5 Middle East Recycled Carbon Fiber Market by End Use Industry
11.5.2.6 UAE
11.5.2.6.1 UAE Recycled Carbon Fiber Market by Source
11.5.2.6.2 UAE Recycled Carbon Fiber Market by Type
11.5.2.6.3 UAE Recycled Carbon Fiber Market by Recycling Method
11.5.2.6.4 UAE Recycled Carbon Fiber Market by End Use Industry
11.5.2.7 Egypt
11.5.2.7.1 Egypt Recycled Carbon Fiber Market by Source
11.5.2.7.2 Egypt Recycled Carbon Fiber Market by Type
11.5.2.7.3 Egypt Recycled Carbon Fiber Market by Recycling Method
11.5.2.7.4 Egypt Recycled Carbon Fiber Market by End Use Industry
11.5.2.8 Saudi Arabia
11.5.2.8.1 Saudi Arabia Recycled Carbon Fiber Market by Source
11.5.2.8.2 Saudi Arabia Recycled Carbon Fiber Market by Type
11.5.2.8.3 Saudi Arabia Recycled Carbon Fiber Market by Recycling Method
11.5.2.8.4 Saudi Arabia Recycled Carbon Fiber Market by End Use Industry
11.5.2.9 Qatar
11.5.2.9.1 Qatar Recycled Carbon Fiber Market by Source
11.5.2.9.2 Qatar Recycled Carbon Fiber Market by Type
11.5.2.9.3 Qatar Recycled Carbon Fiber Market by Recycling Method
11.5.2.9.4 Qatar Recycled Carbon Fiber Market by End Use Industry
11.5.2.10 Rest of Middle East
11.5.2.10.1 Rest of Middle East Recycled Carbon Fiber Market by Source
11.5.2.10.2 Rest of Middle East Recycled Carbon Fiber Market by Type
11.5.2.10.3 Rest of Middle East Recycled Carbon Fiber Market by Recycling Method
11.5.2.10.4 Rest of Middle East Recycled Carbon Fiber Market by End Use Industry
11.5.3 Africa
11.5.3.1 Africa Recycled Carbon Fiber Market by Country
11.5.3.2 Africa Recycled Carbon Fiber Market by Source
11.5.3.3 Africa Recycled Carbon Fiber Market by Type
11.5.3.4 Africa Recycled Carbon Fiber Market by Recycling Method
11.5.3.5 Africa Recycled Carbon Fiber Market by End Use Industry
11.5.3.6 Nigeria
11.5.3.6.1 Nigeria Recycled Carbon Fiber Market by Source
11.5.3.6.2 Nigeria Recycled Carbon Fiber Market by Type
11.5.3.6.3 Nigeria Recycled Carbon Fiber Market by Recycling Method
11.5.3.6.4 Nigeria Recycled Carbon Fiber Market by End Use Industry
11.5.3.7 South Africa
11.5.3.7.1 South Africa Recycled Carbon Fiber Market by Source
11.5.3.7.2 South Africa Recycled Carbon Fiber Market by Type
11.5.3.7.3 South Africa Recycled Carbon Fiber Market by Recycling Method
11.5.3.7.4 South Africa Recycled Carbon Fiber Market by End Use Industry
11.5.3.8 Rest of Africa
11.5.3.8.1 Rest of Africa Recycled Carbon Fiber Market by Source
11.5.3.8.2 Rest of Africa Recycled Carbon Fiber Market by Type
11.5.3.8.3 Rest of Africa Recycled Carbon Fiber Market by Recycling Method
11.5.3.8.4 Rest of Africa Recycled Carbon Fiber Market by End Use Industry
11.6 Latin America
11.6.1 Trend Analysis
11.6.2 Latin America Recycled Carbon Fiber Market by Country
11.6.3 Latin America Recycled Carbon Fiber Market by Source
11.6.4 Latin America Recycled Carbon Fiber Market by Type
11.6.5 Latin America Recycled Carbon Fiber Market by Recycling Method
11.6.6 Latin America Recycled Carbon Fiber Market by End Use Industry
11.6.7 Brazil
11.6.7.1 Brazil Recycled Carbon Fiber Market by Source
11.6.7.2 Brazil Recycled Carbon Fiber Market by Type
11.6.7.3 Brazil Recycled Carbon Fiber Market by Recycling Method
11.6.7.4 Brazil Recycled Carbon Fiber Market by End Use Industry
11.6.8 Argentina
11.6.8.1 Argentina Recycled Carbon Fiber Market by Source
11.6.8.2 Argentina Recycled Carbon Fiber Market by Type
11.6.8.3 Argentina Recycled Carbon Fiber Market by Recycling Method
11.6.8.4 Argentina Recycled Carbon Fiber Market by End Use Industry
11.6.9 Colombia
11.6.9.1 Colombia Recycled Carbon Fiber Market by Source
11.6.9.2 Colombia Recycled Carbon Fiber Market by Type
11.6.9.3 Colombia Recycled Carbon Fiber Market by Recycling Method
11.6.9.4 Colombia Recycled Carbon Fiber Market by End Use Industry
11.6.10 Rest of Latin America
11.6.10.1 Rest of Latin America Recycled Carbon Fiber Market by Source
11.6.10.2 Rest of Latin America Recycled Carbon Fiber Market by Type
11.6.10.3 Rest of Latin America Recycled Carbon Fiber Market by Recycling Method
11.6.10.4 Rest of Latin America Recycled Carbon Fiber Market by End Use Industry
12. Company Profiles
12.1 Shocker composites LLC
12.1.1 Company Overview
12.1.2 Financial
12.1.3 Products/ Services Offered
12.1.4 The SNS View
12.2 ZOLTEK Corporation
12.2.1 Company Overview
12.2.2 Financial
12.2.3 Products/ Services Offered
12.2.4 The SNS View
12.3 Sigmatex
12.3.1 Company Overview
12.3.2 Financial
12.3.3 Products/ Services Offered
12.3.4 The SNS View
12.4 Carbon Fiber Recycling
12.4.1 Company Overview
12.4.2 Financial
12.4.3 Products/ Services Offered
12.4.4 The SNS View
12.5 SGL Carbon
12.5.1 Company Overview
12.5.2 Financial
12.5.3 Products/ Services Offered
12.5.4 The SNS View
12.6 Hadeg
12.6.1 Company Overview
12.6.2 Financial
12.6.3 Products/ Services Offered
12.6.4 The SNS View
12.7 Carbon Conversions
12.7.1 Company Overview
12.7.2 Financial
12.7.3 Products/ Services Offered
12.7.4 The SNS View
12.8 ELG Carbon Fibre Ltd
12.8.1 Company Overview
12.8.2 Financial
12.8.3 Products/ Services Offered
12.8.4 The SNS View
12.9 CFK Valley Stade Recycling GmbH & Co. KG
12.9.1 Company Overview
12.9.2 Financial
12.9.3 Products/ Services Offered
12.9.4 The SNS View
12.10 PROCOTEX CORPORATION
12.10.1 Company Overview
12.10.2 Financial
12.10.3 Products/ Services Offered
12.10.4 The SNS View
12.11 Teijin Limited
12.11.1 Company Overview
12.11.2 Financial
12.11.3 Products/ Services Offered
12.11.4 The SNS View
12.12 Vartega Inc
12.12.1 Company Overview
12.12.2 Financial
12.12.3 Products/ Services Offered
12.12.4 The SNS View
13. Competitive Landscape
13.1 Competitive Benchmarking
13.2 Market Share Analysis
13.3 Recent Developments
13.3.1 Industry News
13.3.2 Company News
13.3.3 Mergers & Acquisitions
14. Use Case and Best Practices
15. Conclusion
An accurate research report requires proper strategizing as well as implementation. There are multiple factors involved in the completion of good and accurate research report and selecting the best methodology to compete the research is the toughest part. Since the research reports we provide play a crucial role in any company’s decision-making process, therefore we at SNS Insider always believe that we should choose the best method which gives us results closer to reality. This allows us to reach at a stage wherein we can provide our clients best and accurate investment to output ratio.
Each report that we prepare takes a timeframe of 350-400 business hours for production. Starting from the selection of titles through a couple of in-depth brain storming session to the final QC process before uploading our titles on our website we dedicate around 350 working hours. The titles are selected based on their current market cap and the foreseen CAGR and growth.
The 5 steps process:
Step 1: Secondary Research:
Secondary Research or Desk Research is as the name suggests is a research process wherein, we collect data through the readily available information. In this process we use various paid and unpaid databases which our team has access to and gather data through the same. This includes examining of listed companies’ annual reports, Journals, SEC filling etc. Apart from this our team has access to various associations across the globe across different industries. Lastly, we have exchange relationships with various university as well as individual libraries.
Step 2: Primary Research
When we talk about primary research, it is a type of study in which the researchers collect relevant data samples directly, rather than relying on previously collected data. This type of research is focused on gaining content specific facts that can be sued to solve specific problems. Since the collected data is fresh and first hand therefore it makes the study more accurate and genuine.
We at SNS Insider have divided Primary Research into 2 parts.
Part 1 wherein we interview the KOLs of major players as well as the upcoming ones across various geographic regions. This allows us to have their view over the market scenario and acts as an important tool to come closer to the accurate market numbers. As many as 45 paid and unpaid primary interviews are taken from both the demand and supply side of the industry to make sure we land at an accurate judgement and analysis of the market.
This step involves the triangulation of data wherein our team analyses the interview transcripts, online survey responses and observation of on filed participants. The below mentioned chart should give a better understanding of the part 1 of the primary interview.
Part 2: In this part of primary research the data collected via secondary research and the part 1 of the primary research is validated with the interviews from individual consultants and subject matter experts.
Consultants are those set of people who have at least 12 years of experience and expertise within the industry whereas Subject Matter Experts are those with at least 15 years of experience behind their back within the same space. The data with the help of two main processes i.e., FGDs (Focused Group Discussions) and IDs (Individual Discussions). This gives us a 3rd party nonbiased primary view of the market scenario making it a more dependable one while collation of the data pointers.
Step 3: Data Bank Validation
Once all the information is collected via primary and secondary sources, we run that information for data validation. At our intelligence centre our research heads track a lot of information related to the market which includes the quarterly reports, the daily stock prices, and other relevant information. Our data bank server gets updated every fortnight and that is how the information which we collected using our primary and secondary information is revalidated in real time.
Step 4: QA/QC Process
After all the data collection and validation our team does a final level of quality check and quality assurance to get rid of any unwanted or undesired mistakes. This might include but not limited to getting rid of the any typos, duplication of numbers or missing of any important information. The people involved in this process include technical content writers, research heads and graphics people. Once this process is completed the title gets uploader on our platform for our clients to read it.
Step 5: Final QC/QA Process:
This is the last process and comes when the client has ordered the study. In this process a final QA/QC is done before the study is emailed to the client. Since we believe in giving our clients a good experience of our research studies, therefore, to make sure that we do not lack at our end in any way humanly possible we do a final round of quality check and then dispatch the study to the client.
Key Segments:
By Source
Aerospace scrap
Automotive scrap
Others
By Type
Chopped
Milled
Others
By Recycling Method
Mechanical Recycling
Chemical Recycling
Pyrolysis
Solvolysis
Others
By End Use Industry
Automotive & Transportation
Consumer Goods
Industrial
Marine
Aerospace & Defense
Wind Energy
Sports & Leisure
Construction
Electronics
Others
Request for Segment Customization as per your Business Requirement: Segment Customization Request
Regional Coverage:
Regional Coverage
North America
US
Canada
Mexico
Europe
Eastern Europe
Poland
Romania
Hungary
Turkey
Rest of Eastern Europe
Western Europe
Germany
France
UK
Italy
Spain
Netherlands
Switzerland
Austria
Rest of Western Europe
Asia Pacific
China
India
Japan
South Korea
Vietnam
Singapore
Australia
Rest of Asia Pacific
Middle East & Africa
Middle East
UAE
Egypt
Saudi Arabia
Qatar
Rest of Middle East
Africa
Nigeria
South Africa
Rest of Africa
Latin America
Brazil
Argentina
Colombia
Rest of Latin America
Request for Country Level Research Report: Country Level Customization Request
Available Customization
With the given market data, SNS Insider offers customization as per the company’s specific needs. The following customization options are available for the report:
Product Analysis
Criss-Cross segment analysis (e.g. Product X Application)
Product Matrix which gives a detailed comparison of product portfolio of each company
Geographic Analysis
Additional countries in any of the regions
Company Information
Detailed analysis and profiling of additional market players (Up to five)
The Furfural Derivatives Market Size was valued at USD 13.2 Billion in 2023 and is expected to reach USD 21.4 Billion by 2032 and grow at a CAGR of 5.5% over the forecast period 2024-2032.
The Fructooligosaccharides Market Size was valued at USD 2.6 billion in 2023, and is expected to reach USD 5.5 billion by 2032, and grow at a CAGR of 8.7% over the forecast period 2024-2032.
The Unidirectional Tapes (UD) Market Size was valued at USD 276.35 Million in 2023 and is expected to reach USD 920.36 million by 2031 and grow at a CAGR of 16.2% over the forecast period 2024-2031.
Zero Friction Coatings Market Size was valued at USD 915.6 Million in 2023 and will reach USD 1469.8 Million by 2032 & grow at a CAGR of 5.4% by 2024-2032.
The Butyric Acid Market size was valued at USD 290.4 Million in 2023 and will reach to USD 715.6 Million by 2032 and grow at a CAGR of 10.6% by 2024-2032.
The Plastic Films & Sheets Market Size was valued at USD 135.5 billion in 2023, and expected to reach USD 207.95 billion by 2031, and grow at a CAGR of 5.5% over the forecast period 2024-2031.
Hi! Click one of our member below to chat on Phone