Rectifier Market Size & Industry Analysis:
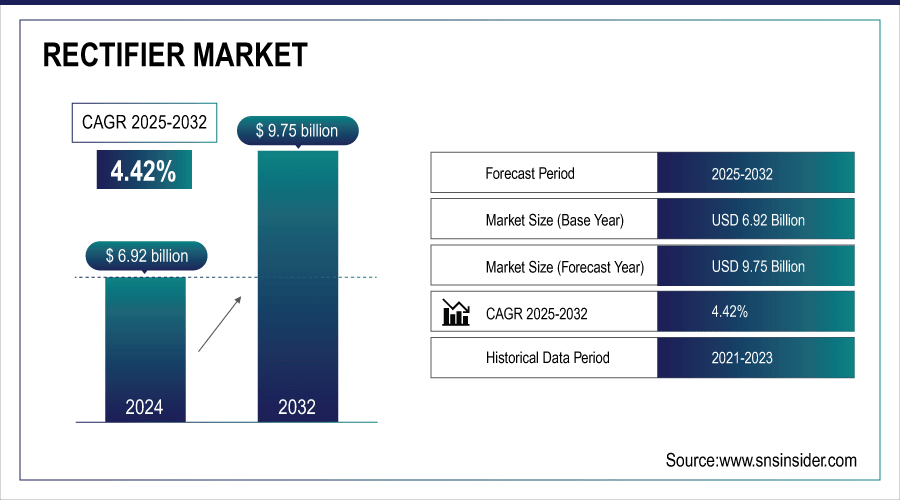
The Rectifier Market size was valued at USD 6.92 billion in 2024 and is expected to reach USD 9.75 billion by 2032 and grow at a CAGR of 4.42% over the forecast period 2025-2032.
To Get More Information On Rectifier Market - Request Free Sample Report
The world market for rectifiers is registering steady growth, driven by the growing demand in industries, such as automotive, power utilities, IT and telecom, and consumer electronics reflecting key rectifier market trends. Advances in electric vehicles, integration of renewable energy sources, and industrial automation are key drivers boosting the semiconductor rectifier market growth globally. In addition, the shift toward energy-efficient technology, smart grid development, and increasing industrial digitalization are boosting the demand for high-performance and reliable rectification technologies globally.
For instance, in January 2024, Diodes Incorporated introduced dual-channel high-side power switches for automotive applications, enhancing efficiency in power conversion systems.
The U.S. Rectifier Market size was USD 1.93 billion in 2024 and is expected to reach USD 2.42 billion by 2032, growing at a CAGR of 2.93% over the forecast period of 2025–2032.
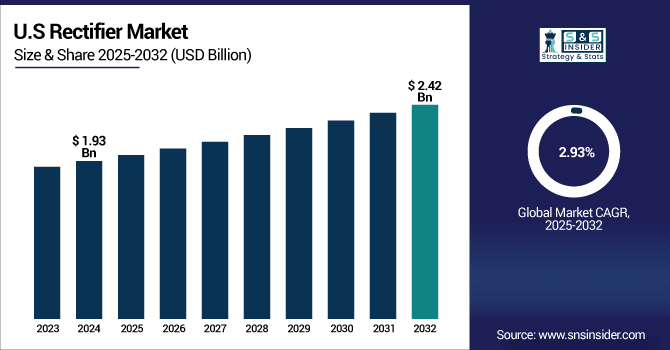
The U.S market is growing steadily, influenced by technological development and the ongoing emphasis on energy efficiency. The surge in demand for environmental-friendly solutions, with the emergence of new technologies in power conversion technologies, is supporting market growth. Also, the current modernization of infrastructure and increasing adoption of smart systems support overall development in the market for the region.
For instance, in September 2024, SMC Diode Solutions, an American semiconductor design and manufacturer, announced a partnership with Seed4B to market and sell SMC's discrete products to Brazil. This collaboration is anticipated to enhance the market coverage of SMC and to leverage the excellent competency of Seed4B aimed at high-quality power modules and components.
Rectifier Market Dynamics:
Drivers:
-
Increasing Adoption of Energy-Efficient and High-Performance Rectifiers to Support Global Power Conversion Demands
The market for rectifiers is being accelerated by the increasing need for energy-saving solutions in many industries contributing to the rectifier market growth. Advancements in rectifier technologies with increased efficiency, less power loss, and improved performance will propel considerable growth in the market. This need crosses application domains from consumer electronics through automotive and power utilities, driving the need for higher-level rectifier solutions.
For instance, in November 2024, Vishay Intertechnology extended its Gen 7 platform of 1200 V FRED Pt Hyperfast rectifiers with four new automotive-grade solutions in the eSMP series SMF (DO-219AB) package showcasing continuous innovations in the rectifiers industy.
Restraints:
-
Stringent Regulatory Standards and Compliance Requirements for Rectifier Manufacturing Limit Market Growth
Stringent regulatory requirements and compliance for rectifier production are significant restraints hampering the growth of the market. Several international and regional certifications on safety, environmental factors, and quality control have to be complied with by manufacturers, raising the cost of production. Compliance also leads to longer lead times, hampering product development and entry into the market. Also, the level of complexity required to meet such strict guidelines may be a challenge for smaller-scale manufacturers, thus reducing competition and potentially hindering overall market growth.
Opportunities:
-
Growth of Renewable Energy and Electric Vehicle Industries Presents Significant Opportunities for Market Expansion
As solar and wind power continue to pick up speed, the demand for effective power conversion systems, such as rectifiers, increases. Similarly, the increasing number of electric vehicles necessitates the state-of-the-art rectifiers to charge onboard and battery management. This integration of electric mobility and renewable energy creates a storm's brew of demand for rectifier solutions, which is an opportunity that can be capitalized on, according to the rectifier market analysis.
November 2024, Infineon Technologies launched the EiceDRIVER Power 2EP1xxR family of full-bridge transformer drivers for IGBT, SiC, and GaN gate driver power supplies for use in solar, electric vehicle charging, and energy storage applications.
Challenges:
-
Technological Advancements and Competitive Pressures Pose Challenges for Maintaining Profit Margins in the Market
The high pace of technological development of innovations of rectifier systems (like SCRs, GaN and SiC rectifiers) is a challenge to market players in it for profit. As new technology emerges often, rectifier suppliers have to keep investing and developing new products to compete. That puts price pressure on, particularly for companies with limited budgets. Add to this a growing tendency for ever more players to rapidly flood the market with me-too products and the situation becomes even more dire, as maintaining a profit-margin while providing differentiation based on technological innovation becomes increasingly more difficult.
Rectifier Market Segmentation Analysis:
By Type
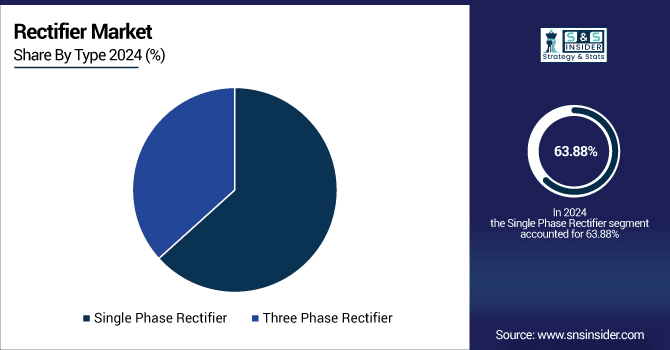
The single phase rectifier segment held a dominant market share, with 63.88% in 2024. The segment’s growth is attributed to its heavy use of housing and light industry, which has a power rating requirement on the lower web. Major manufacturers including STMicroelectronics have introduced more complex single-phase rectifiers, which has high efficiency and performance. The ever-growing demand for economical and efficient energy consumption has helped the segment to maintain its supremacy as the dominant part in the global market.
The three phase rectifier segment is anticipated to grow at the fastest CAGR of 5.39% during the period of 2025-2032. The growth is fueled by the growing demand in high-power industrial and commercial applications. Infineon Technologies and ABB have introduced new three-phase rectifiers with enhanced voltage stability and efficiency. The growing requirement for higher capacity power conversion systems in manufacturing and energy industries is driving this segment's high growth in the market.
By Range
The 0.5 - 3.0 Amps segment dominated the market with a dominating revenue share of 55.46% in 2024. The range is mainly applied in low-power applications, such as consumer electronics and small appliances.
Vishay Intertechnology and ON Semiconductor have recently introduced high-efficiency rectifiers in this range, aiming at energy-aware consumers.
The increase in portable electronics and energy-efficient solutions continues to drive the segment's dominance in the global market.
The 3.1 - 35 Amps segment is expected to advance at the fastest CAGR of 5.50% during the projected period of 2025 to 2032. This segment addresses mid-power applications in industries, such as industrial automation and automotive. Infineon Technologies and STMicroelectronics have launched new rectifiers with enhanced thermal management and performance in this segment. With industries looking for more durable power conversion solutions, this segment is likely to witness high demand, adding to the overall growth of the market.
By Application
The automotive segment held the dominant rectifier market share of 38.20% in 2024 due to the increasing demand for electric vehicles (EVs) and sophisticated automotive power systems. Rectifiers designed specifically to meet the high voltage and power requirements in electric and hybrid cars have been introduced by rectifiers companies, such as Nexperia. The growing demand for EVs, coupled with the transition to energy-efficient automobile technologies, is further expected to fuel the segment’s growth further driving the overall market growth.
The consumer electronics segment is anticipated to expand with the fastest CAGR of 5.64% during the projected period of 2025 to 2032, driven by a rise in the need for energy-efficient products and the increased adoption of smart electronics. Microchip Technology are among those companies that have introduced advanced rectifiers to address the power conversion requirements of products, such as smartphones, laptops, and wearables. The increasing use of rectifiers in consumer electronics, underpinned by growing demand for more efficient power supplies and longer device lifetimes, is one of the most significant drivers of this segment's growth.
Rectifier Market Regional Overview:
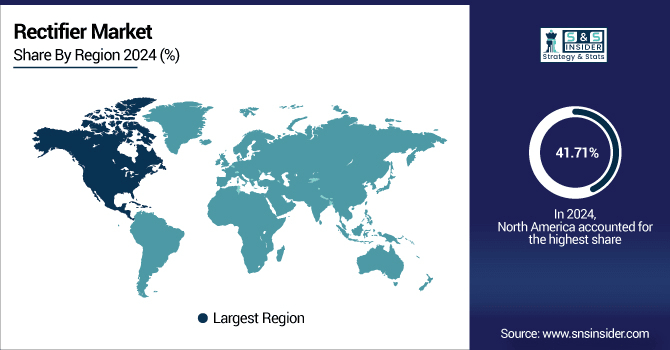
North America dominated the market with the maximum revenue share of 41.71% in 2024 due to tremendous demand in the automotive, industrial, and consumer electronics industries. Industry players, such as STMicroelectronics have come up with innovative rectifier solutions specific to fulfil the needs of the North American market. Increased emphasis on energy-efficient technologies along with growing demand for electric vehicle adoption are contributing to North America's leadership role as a prominent sector in the market at the global level.
Get Customized Report as Per Your Business Requirement - Enquiry Now
The U.S. leads the North American market due to its advanced industrial base, high energy-efficient solution demand, and robust automobile and electronics industries. Its emphasis on innovation, especially in electric vehicles and smart technologies, also contributes to market dominance.
The Asia Pacific region is expanding with the fastest CAGR of 5.99% during 2025-2032 due to the fast-paced industrialization and rising demand for electronics and renewable energy systems. Players, such as Infineon Technologies and ON Semiconductor are expanding their footprint in the region by introducing advanced rectifiers appropriate for local power conversion requirements. It is driven by robust manufacturing bases and technological improvements, making Asia Pacific a fast-growing market for rectifiers.
China dominated the Asia Pacific market based on its strong production capacities, immense demand for electronics, and booming industrial development. Its leadership in renewable energy penetration, electric vehicle growth, and technological advancements, consolidate its market leader status in the region.
The European market is witnessing consistent growth with the help of technological innovation and a high thrust toward energy efficiency. The rising use of sustainable solutions and the creation of smart infrastructure in the region also drive the demand for high-performance rectifiers. The top nations, such as Germany and France are leading the way in propelling innovation and creating a competitive landscape, making Europe a significant player in the global rectifier market.
Germany leads the European rectifier market due to its highly developed industrial base, technological innovation, and dominance in industries such as automotive and renewable energy. Turkey is rising but lags behind in market share.
Saudi Arabia dominates the market in the Middle East & Africa due to industrial expansion, energy investments, and the development of infrastructure, with the UAE also being a major contributor through smart city and renewable energy initiatives. In Latin America, Brazil dictates the market owing to the presence of a large industrial base, while Argentina comes close.
Rectifier Companies are:
Major players in the rectifier market are Microchip Technology, Broadcom, Analog Devices, Infineon Technologies, ON Semiconductor, STMicroelectronics, Texas Instruments, Nexperia, Cree, and Vishay Intertechnology.
Recent Development:
-
December 2024, Microchip Technology announced that it has shut down the company’s wafer fab in Tempe, Arizona, as part of an ongoing initiative to reshuffle the company’s manufacturing footprint around the world and cut costs. The company says the move is aimed at productivity and adapting to the changing market.
-
November 2024, Infineon Technologies Introduced the EiceDRIVER™ Power 2EP1xxR family of full-bridge transformer drivers for IGBT, SiC, and GaN gate driver power supplies, suitable for applications in solar, electric vehicle charging, and energy storage systems.
| Report Attributes | Details |
|---|---|
| Market Size in 2024 | USD 6.92 Billion |
| Market Size by 2032 | USD 9.75 Billion |
| CAGR | CAGR of 4.42% From 2025 to 2032 |
| Base Year | 2024 |
| Forecast Period | 2025-2032 |
| Historical Data | 2021-2023 |
| Report Scope & Coverage | Market Size, Segments Analysis, Competitive Landscape, Regional Analysis, DROC & SWOT Analysis, Forecast Outlook |
| Key Segments | •By Type (Single Phase Rectifier, Three Phase Rectifier) •By Range (0.5 - 3.0 Amps, 3.1 - 35 Amps, Above 35 Amps) •By Application (Power & Utility, Automotive, IT/Telecom, Consumer Electronics, Others) |
| Regional Analysis/Coverage | North America (US, Canada, Mexico), Europe (Germany, France, UK, Italy, Spain, Poland, Turkey, Rest of Europe), Asia Pacific (China, India, Japan, South Korea, Singapore, Australia, Rest of Asia Pacific), Middle East & Africa (UAE, Saudi Arabia, Qatar, South Africa, Rest of Middle East & Africa), Latin America (Brazil, Argentina, Rest of Latin America) |
| Company Profiles | Microchip Technology, Broadcom, Analog Devices, Infineon Technologies, ON Semiconductor, STMicroelectronics, Texas Instruments, Nexperia, Cree, Vishay Intertechnology |
