Get More Information on Real-Time Bidding Market - Request Sample Report
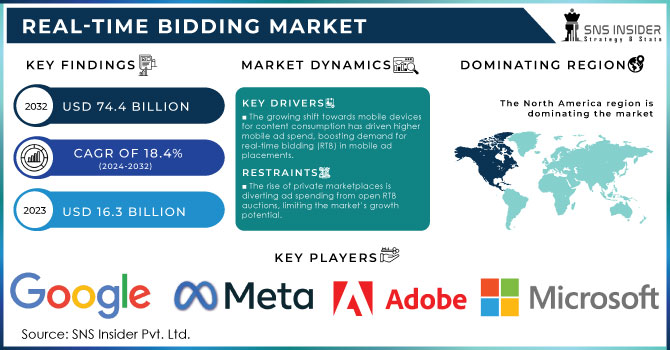
Real-Time Bidding Market Size was valued at USD 16.3 Billion in 2023 and is expected to reach USD 74.4 Billion by 2032, growing at a CAGR of 18.4% over the forecast period 2024-2032.
The real-time bidding market has achieved remarkable growth due to the expansion of digital advertising spend and the investments in digital infrastructure policies supported by government policies. As the U.S. Bureau of Economic Analysis states, digital advertising appeared to play a substantial role in the contribution to the economic output of the country in 2023. It proves the increased appetite for the automated purchase and sale of the ads. At the same time, The European Union’s Digital Strategy 2023 established laws that provide a framework that improves digital advertising transparency and competition supporting the adoption of the RTB. Moreover, as the India Ministry of Electronics and Information Technology says, as a part of the Digital India program people have started massively adopting online platforms with a 25% rise in digital payments and transactions. Such acquisitions facilitated the further spread of the real-time bidding market where marketers and businesses purchase the ad spaces at the right time directly on the auction. The substantial governmental efforts together with the development of novel technologies, such as AI and machine learning, are the basis of the market growth as they help to cut the expenses on the ads by making the purchase more efficient and improving the targeting of advertisements.
Drivers
The growing shift towards mobile devices for content consumption has driven higher mobile ad spend, boosting demand for real-time bidding (RTB) in mobile ad placements.
Advanced algorithms in AI and machine learning are enhancing ad targeting accuracy, leading to greater efficiency and personalization in RTB campaigns.
The global rollout of 5G technology is accelerating mobile internet speeds, enabling more real-time interactions and boosting the RTB market’s growth.
One of the prominent drivers in the Real-Time Bidding market is the significant increase in mobile ad spending. A growing shift to mobile devices is observed due to increasing human mobility and the necessity to stay connected. According to the International Telecommunication Union, in 2023, more than 5.3 billion people used mobile devices for internet access, which is up by 7% in comparison with the previous year. Since the majority of devices used and go-to platforms for internet surfing are mobile devices, they have become the primary platform for connecting advertisers with users through real-time bidding. The amount of time, as well as occasions, spent on mobile devices has been ever-increasing, surged by the rise of social media and gaming applications, which are both rich in possibilities for advertising placement. In 2023, an average user spends 4.6 hours on mobile apps daily, mainly focusing on social media and gaming, which provides advertisers abundant chances to access their target users. Real-time bidding allows advertisers to bid dynamically for mobile ad spaces and ensure that their target ad is placed in front of the appropriate viewer at the most relevant, in-context time point.
Furthermore, an increased interest in mobile internet usage is also supported by government-mandated programs, such as the Indian government’s efforts to enhance mobile internet access under the BharatNet project. India has experienced a 25% growth in mobile internet usage in 2023, which propelled real-time bidding activities and will continue to do so, as expanding mobile internet usage penetration will increase the demand for such activity.
Restraints:
Stringent regulations like GDPR and CCPA are limiting data accessibility, making it harder for advertisers to effectively target users in RTB environments.
The prevalence of ad fraud and lack of transparency in the bidding process are creating trust issues among advertisers, restraining RTB adoption.
The rise of private marketplaces is diverting ad spending from open RTB auctions, limiting the market’s growth potential.
One of the significant restraints in the real-time bidding (RTB) market is the increasing impact of data privacy regulations. With the establishment of the General Data Protection Regulation and the California Consumer Privacy Act, proper rules have been put into place concerning the collection and use of personal data for promotional purposes. One of the main features of the legislation is the limitations that it imposes on the extent to which advertisers may collect user information which is vital as a foundation for the use of real-time bidding. Advertisers are now expected to provide their users with an agreement that allows them to track online activity and collect information to establish a user profile. In most cases, however, users are not apt to provide full consent which ultimately leads to significantly reduced data access. As a result, advertisers cannot divide their audiences into segments that can be adequately targeted. Non-compliance with these regulations also carries hefty fines, pushing companies to adopt stricter data handling practices, which can hinder the efficiency of real-time bidding.
| Component | Role in RTB | Benefits | Challenges | Impact on Advertisers & Publishers |
|---|---|---|---|---|
| Demand-Side Platform (DSP) | Allows advertisers to bid on ad inventory in real-time | Access to diverse ad inventory, real-time analytics | Complex integration, competition for premium inventory | Enables advertisers to reach target audiences efficiently |
| Supply-Side Platform (SSP) | Helps publishers manage, sell, and optimize ad space | Maximizes revenue, controls ad placements | Risk of low bids, inventory quality management | Allows publishers to monetize unsold ad inventory |
| Ad Exchange | Acts as a digital marketplace for buying/selling ad inventory | Facilitates transparent transactions, large reach | Ad fraud, data privacy concerns | Connects advertisers and publishers for efficient trading |
| Data Management Platform (DMP) | Collects and analyses data for targeted advertising | Enhances targeting accuracy, data-driven insights | Data privacy regulations, integration complexity | Provides advertisers with audience insights for better targeting |
By Auction Type
In 2023, open auction was the dominant segment in the RTB markets, with 32% of the revenue share. Open auctions are preferable because they are accessible and transparent. While for private auctions, certain advertisers are normally invited, in the case of open auctions, a wider pool of operators can participate. As a result, the competition for the space is increased and the bids become “more aggressive”. As a result, publishers benefit the most from bidding wars. In addition, the demands of the government to enforce the high degree of competition in digital markets help open auctions succeed. As a part of these efforts, the European Union has adopted the Digital Markets Act and this measure has led to fairness in competition, increasing even more interest in open auctions. Additionally, the number of advertisers who can participate in the open auction has increased due to the elevated penetration of mobile internet into emerging markets. Moreover, the data is more transparent and follows governmental regulations that impose data protection. In the EU, it is the GDPR. Overall, these factors allow the open auction segment to remain at a dominant market share.
By Device
In 2023 mobile devices segment dominated the market with the largest revenue share. The dominating mobile devices segment is primarily due to the tremendous rise in mobile internet consumption and governmental campaigns promoting mobile digital infrastructure. In the United States, mobile broadband subscriptions increased by 15% compared to the previous year, according to the U.S. Federal Communications Commission. The statistics claim that approximately 84% of the United States population uses the internet with smartphones or other mobile devices. On a global scale, mobile internet user statistics show a 27% increase, supported by governmental policies such as the Indian BharatNet initiative. According to the mission statement of the government-led directive, BharatNet plans to develop mobile high-speed internet infrastructure in rural Indian regions. The steady growth of mobile device user statistics shows the amplified importance of mobile platforms in the digital advertising market landscape. Thus, as consumer content consumption patterns shift toward mobile devices, so too do the advertisers who seek to target users in real-time using RTB. High-performance rates and user convenience are the prevailing characteristics of mobile devices that make the phones a primary platform. Additionally, governmental policies in the Southeast Asia region, which received significant investment in 5G technology, further cultivate mobile devices.
By Application
The RTB market was dominated by the gaming segment in 2023. Mobile and online gaming platforms were the industries’ primary drivers, both experiencing explosive growth. In the U.S., the gaming industry contributed to nearly $97 billion of the national economy. Specifically, the mobile sector made up 41% of the aggregate market. Moreover, globally, the gaming sector experienced a 20% year-on-year revenue increase per the World Economic Forum data. The major driving factor was considered to be government initiatives that stimulated the public to use digital games for entertainment and educational purposes.
An example is provided by China, as the country’s 14th Five-Year plan supports the reactive dynamism of gaming and pursues the development of digital content. The uptick in mobile gaming prompted the government to provide protection for this industry. High levels of customer engagement cement interest in these individuals as target audiences for advertisers. In this scenario, RTB is an optimal strategy as it allows for direct advertisement interactions with individuals who might consider the content personally relevant. In addition, gaming platforms frequently have extensive pools of information to draw from, contributing to more accurate targeting. Notably, the RTB market share for this gaming stood at 35% in 2023.
Regional Insights
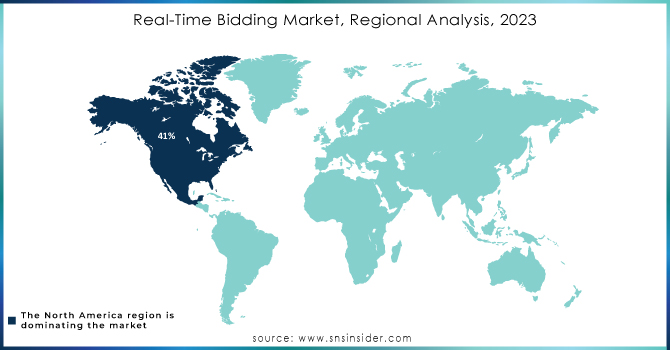
In 2023, the real-time bidding market was dominated by North America, as it accounted for 41% of the global revenue. This is a result of the region’s well-developed digital infrastructure, high rate of technology adoption, as well as robust and advanced regulations that support the transparent and competitive digital ad ecosystem. The U.S. specifically has been a prominent player, with the government’s statistics by the Federal Trade Commission showing a 22% increase in digital ad spending, which was attributed to the booming e-commerce and social media sectors. Furthermore, the growth of the RTB market has been supported by Canada’s Digital Charter Implementation Act, which has excelled transparency and consumer trust in the digital market.
However, the Asia-Pacific region is the fasted growing segment and is expected to grow at a significant CAGR from 2024 to 2032. Across the region, governments, including China’s Digital Economy Development Plan and India’s Digital India, have been critical in creating favourable conditions for digital advertising. More specifically, the infrastructure investments in 5G connectivity in China have advanced mobile advertising, which has been a key driver of growth in the RTB market. At the same time, the rapid growth of the internet and smartphone use across India, Indonesia, and Vietnam has been critical in advancing the RTB solution in the APAC market.
Need any customization research on Real-Time Bidding Market - Enquiry Now
Latest News in the Real-Time Bidding Market
July 2024, The U.S. Federal Communications Commission released new guidelines aimed toward increasing transparency of digital advertisement practices. These guidelines were to enhance transparency in any transactions of programmatic advertisement, such as real-time bidding, thus ensuring consumer privacy and fair competition. This event has become a significant step in controlling the RTB market and compliance with privacy laws.
April 2024 – SpotX has announced an update for the server-to-server bidding product, which will allow including yield management into media owners’ operation. The new technologies of ad serving now include the server-side and client-side header bidders with cloud-based solutions.
June 2024: The European Union published a report on the impact of the Digital Markets Act (DMA) on the digital advertising landscape. The report highlighted that since the DMA came into effect, there has been a 15% increase in open auction participation, reflecting the law’s success in fostering competition in the RTB market. The report also pointed to an improvement in ad pricing transparency, benefiting both advertisers and consumers.
Key Players
Google (DoubleClick, Google Ads)
Meta (Facebook Audience Network, Instagram Ads)
Adobe (Adobe Advertising Cloud, Marketo Engage)
Amazon (Amazon DSP, Amazon Advertising Platform)
Microsoft (Microsoft Advertising, Xandr Invest)
The Trade Desk (TD7, Koa)
MediaMath (TerminalOne, Source)
Criteo (Criteo Dynamic Retargeting, Criteo Retail Media)
Smaato (Smaato Publisher Platform, Smaato Demand Platform)
Rubicon Project (Prebid, EMX)
Verizon Media (Verizon Media DSP, Yahoo Native Ads)
AppNexus (Prebid, Xandr Curate)
PubMatic (OpenWrap, PubMatic Marketplace)
OpenX (OpenX Exchange, OpenX Ad Server)
SpotX (SpotX Platform, SpotX Video DSP)
Amobee (Amobee DSP, Amobee Analytics)
Zeta Global (Zeta DSP, Zeta Marketing Platform)
Quantcast (Quantcast Platform, Quantcast Measure)
Choozle (Choozle DSP, Choozle Data Marketplace)
Centro (Basis, Centro DSP) and others
| Report Attributes | Details |
|---|---|
| Market Size in 2023 | USD 16.3 Billion |
| Market Size by 2032 | USD 74.4 Billion |
| CAGR | CAGR of 18.4% From 2024 to 2032 |
| Base Year | 2023 |
| Forecast Period | 2024-2032 |
| Historical Data | 2020-2022 |
| Report Scope & Coverage | Market Size, Segments Analysis, Competitive Landscape, Regional Analysis, DROC & SWOT Analysis, Forecast Outlook |
| Key Segments | • By Auction Type (Open Auction, Private Auction, Preferred Deals, Programmatic Guaranteed) • By Device(Mobile, Desktop, Smart TV, Others) • By Advertisement Format (Display Ad, Video Ads, Mobile Ads, Social Media Ads, Native Ads) • By Application (Media & Entertainment, Retail and E-commerce, Games, Travel & Luxury, Mobile Applications, Others) |
| Regional Analysis/Coverage | North America (US, Canada, Mexico), Europe (Eastern Europe [Poland, Romania, Hungary, Turkey, Rest of Eastern Europe] Western Europe] Germany, France, UK, Italy, Spain, Netherlands, Switzerland, Austria, Rest of Western Europe]), Asia Pacific (China, India, Japan, South Korea, Vietnam, Singapore, Australia, Rest of Asia Pacific), Middle East & Africa (Middle East [UAE, Egypt, Saudi Arabia, Qatar, Rest of Middle East], Africa [Nigeria, South Africa, Rest of Africa], Latin America (Brazil, Argentina, Colombia, Rest of Latin America) |
| Company Profiles | Google, Meta, Adobe, Amazon, Microsoft, The Trade Desk, MediaMath, Criteo, Smaato, Rubicon Project, AppNexus, PubMatic, OpenX |
| Key Drivers | • The growing shift towards mobile devices for content consumption has driven higher mobile ad spend, boosting demand for real-time bidding (RTB) in mobile ad placements. • Advanced algorithms in AI and machine learning are enhancing ad targeting accuracy, leading to greater efficiency and personalization in RTB campaigns The global rollout of 5G technology is accelerating mobile internet speeds, enabling more real-time interactions and boosting the RTB market’s growth. |
| RESTRAINTS | •Stringent regulations like GDPR and CCPA are limiting data accessibility, making it harder for advertisers to effectively target users in RTB environments. The prevalence of ad fraud and lack of transparency in the bidding process are creating trust issues among advertisers, restraining RTB adoption. |
Ans: Yes, you can customize the report as per your requirements.
Ans. The CAGR of the Real-Time Bidding Market is 18.4% During the forecast period of 2024-2032.
Ans: The North American region dominated the Real-Time Bidding Market in 2023.
Ans: The Gaming Application segment dominated the Real-Time Bidding Market.
Ans. The projected market size for the Real-Time Bidding Market is USD 74.4 billion by 2032.
Table of Contents:
1. Introduction
1.1 Market Definition
1.2 Scope (Inclusion and Exclusions)
1.3 Research Assumptions
2. Executive Summary
2.1 Market Overview
2.2 Regional Synopsis
2.3 Competitive Summary
3. Research Methodology
3.1 Top-Down Approach
3.2 Bottom-up Approach
3.3. Data Validation
3.4 Primary Interviews
4. Market Dynamics Impact Analysis
4.1 Market Driving Factors Analysis
4.1.1 Drivers
4.1.2 Restraints
4.1.3 Opportunities
4.1.4 Challenges
4.2 PESTLE Analysis
4.3 Porter’s Five Forces Model
5. Statistical Insights and Trends Reporting
5.1 Adoption Rates of Emerging Technologies
5.2 Network Infrastructure Expansion, by Region
5.3 Cybersecurity Incidents, by Region (2020-2023)
5.4 Cloud Services Usage, by Region
6. Competitive Landscape
6.1 List of Major Companies, By Region
6.2 Market Share Analysis, By Region
6.3 Type Benchmarking
6.3.1 Type specifications and features
6.3.2 Pricing
6.4 Strategic Initiatives
6.4.1 Marketing and promotional activities
6.4.2 Distribution and supply chain strategies
6.4.3 Expansion plans and new Age Cohort launches
6.4.4 Strategic partnerships and collaborations
6.5 Technological Advancements
6.6 Market Positioning and Branding
7. Real-Time Bidding Market Segmentation, By Auction Type
7.1 Chapter Overview
7.2 Open Auction
7.2.1 Open Auction Market Trends Analysis (2020-2032)
7.2.2 Open Auction Market Size Estimates and Forecasts to 2032 (USD Billion)
7.3 Private Auction
7.3.1 Private Auction Market Trends Analysis (2020-2032)
7.3.2 Private Auction Market Size Estimates and Forecasts to 2032 (USD Billion)
7.4 Preferred Deals
7.4.1 Preferred Deals Market Trends Analysis (2020-2032)
7.4.2 Preferred Deals Market Size Estimates and Forecasts to 2032 (USD Billion)
7.5 Programmatic Guaranteed
7.5.1 Programmatic Guaranteed Market Trends Analysis (2020-2032)
7.5.2 Programmatic Guaranteed Market Size Estimates and Forecasts to 2032 (USD Billion)
8. Real-Time Bidding Market Segmentation, By Device
8.1 Chapter Overview
8.2 Mobile
8.2.1 Mobile Market Trends Analysis (2020-2032)
8.2.2 Mobile Market Size Estimates and Forecasts to 2032 (USD Billion)
8.3 Desktop
8.3.1 Desktop Market Trends Analysis (2020-2032)
8.3.2 Desktop Market Size Estimates and Forecasts to 2032 (USD Billion)
8.4 Smart TV
8.4.1 Smart TV Market Trends Analysis (2020-2032)
8.4.2 Smart TV Market Size Estimates and Forecasts to 2032 (USD Billion)
8.5 Others
8.5.1 Others Market Trends Analysis (2020-2032)
8.5.2 Others Market Size Estimates and Forecasts to 2032 (USD Billion)
9. Real-Time Bidding Market Segmentation, By Advertisement Format
9.1 Chapter Overview
9.2 Display Ad
9.2.1 Display Ad Market Trends Analysis (2020-2032)
9.2.2 Display Ad Market Size Estimates and Forecasts to 2032 (USD Billion)
9.3 Video Ads
9.3.1 Video Ads Market Trends Analysis (2020-2032)
9.3.2 Video Ads Market Size Estimates and Forecasts to 2032 (USD Billion)
9.4 Mobile Ads
9.4.1 Mobile Ads Market Trends Analysis (2020-2032)
9.4.2 Mobile Ads Market Size Estimates and Forecasts to 2032 (USD Billion)
9.5 Social Media Ads
9.5.1 Social Media Ads Market Trends Analysis (2020-2032)
9.5.2 Social Media Ads Market Size Estimates and Forecasts to 2032 (USD Billion)
9.6 Native Ads
9.6.1 Native Ads Market Trends Analysis (2020-2032)
9.6.2 Native Ads Market Size Estimates and Forecasts to 2032 (USD Billion)
10. Real-Time Bidding Market Segmentation, by Application
10.1 Chapter Overview
10.2 Media & Entertainment
10.2.1 Media & Entertainment Market Trends Analysis (2020-2032)
10.2.2 Media & Entertainment Market Size Estimates and Forecasts to 2032 (USD Billion)
10.3 Retail and E-commerce
10.3.1 Retail and E-commerce Market Trends Analysis (2020-2032)
10.3.2 Retail and E-commerce Market Size Estimates and Forecasts to 2032 (USD Billion)
10.4 Games
10.4.1 Games Market Trends Analysis (2020-2032)
10.4.2 Games Market Size Estimates and Forecasts to 2032 (USD Billion)
10.5 Travel & Luxury
10.5.1 Travel & Luxury Market Trends Analysis (2020-2032)
10.5.2 Travel & Luxury Market Size Estimates and Forecasts to 2032 (USD Billion)
10.6 Mobile Applications
10.6.1 Mobile Applications Market Trends Analysis (2020-2032)
10.6.2 Mobile Applications Market Size Estimates and Forecasts to 2032 (USD Billion)
10.7 Others
10.7.1 Others Market Trends Analysis (2020-2032)
10.7.2 Others Market Size Estimates and Forecasts to 2032 (USD Billion)
11. Regional Analysis
11.1 Chapter Overview
11.2 North America
11.2.1 Trends Analysis
11.2.2 North America Real-Time Bidding Market Estimates and Forecasts, by Country (2020-2032) (USD Billion)
11.2.3 North America Real-Time Bidding Market Estimates and Forecasts, By Auction Type (2020-2032) (USD Billion)
11.2.4 North America Real-Time Bidding Market Estimates and Forecasts, By Device (2020-2032) (USD Billion)
11.2.5 North America Real-Time Bidding Market Estimates and Forecasts, By Advertisement Format (2020-2032) (USD Billion)
11.2.6 North America Real-Time Bidding Market Estimates and Forecasts, by Application (2020-2032) (USD Billion)
11.2.7 USA
11.2.7.1 USA Real-Time Bidding Market Estimates and Forecasts, By Auction Type (2020-2032) (USD Billion)
11.2.7.2 USA Real-Time Bidding Market Estimates and Forecasts, By Device (2020-2032) (USD Billion)
11.2.7.3 USA Real-Time Bidding Market Estimates and Forecasts, By Advertisement Format (2020-2032) (USD Billion)
11.2.7.4 USA Real-Time Bidding Market Estimates and Forecasts, by Application (2020-2032) (USD Billion)
11.2.8 Canada
11.2.8.1 Canada Real-Time Bidding Market Estimates and Forecasts, By Auction Type (2020-2032) (USD Billion)
11.2.8.2 Canada Real-Time Bidding Market Estimates and Forecasts, By Device (2020-2032) (USD Billion)
11.2.8.3 Canada Real-Time Bidding Market Estimates and Forecasts, By Advertisement Format (2020-2032) (USD Billion)
11.2.8.4 Canada Real-Time Bidding Market Estimates and Forecasts, by Application (2020-2032) (USD Billion)
11.2.9 Mexico
11.2.9.1 Mexico Real-Time Bidding Market Estimates and Forecasts, By Auction Type (2020-2032) (USD Billion)
11.2.9.2 Mexico Real-Time Bidding Market Estimates and Forecasts, By Device (2020-2032) (USD Billion)
11.2.9.3 Mexico Real-Time Bidding Market Estimates and Forecasts, By Advertisement Format (2020-2032) (USD Billion)
11.2.9.4 Mexico Real-Time Bidding Market Estimates and Forecasts, by Application (2020-2032) (USD Billion)
11.3 Europe
11.3.1 Eastern Europe
11.3.1.1 Trends Analysis
11.3.1.2 Eastern Europe Real-Time Bidding Market Estimates and Forecasts, by Country (2020-2032) (USD Billion)
11.3.1.3 Eastern Europe Real-Time Bidding Market Estimates and Forecasts, By Auction Type (2020-2032) (USD Billion)
11.3.1.4 Eastern Europe Real-Time Bidding Market Estimates and Forecasts, By Device (2020-2032) (USD Billion)
11.3.1.5 Eastern Europe Real-Time Bidding Market Estimates and Forecasts, By Advertisement Format (2020-2032) (USD Billion)
11.3.1.6 Eastern Europe Real-Time Bidding Market Estimates and Forecasts, by Application (2020-2032) (USD Billion)
11.3.1.7 Poland
11.3.1.7.1 Poland Real-Time Bidding Market Estimates and Forecasts, By Auction Type (2020-2032) (USD Billion)
11.3.1.7.2 Poland Real-Time Bidding Market Estimates and Forecasts, By Device (2020-2032) (USD Billion)
11.3.1.7.3 Poland Real-Time Bidding Market Estimates and Forecasts, By Advertisement Format (2020-2032) (USD Billion)
11.3.1.7.4 Poland Real-Time Bidding Market Estimates and Forecasts, by Application (2020-2032) (USD Billion)
11.3.1.8 Romania
11.3.1.8.1 Romania Real-Time Bidding Market Estimates and Forecasts, By Auction Type (2020-2032) (USD Billion)
11.3.1.8.2 Romania Real-Time Bidding Market Estimates and Forecasts, By Device (2020-2032) (USD Billion)
11.3.1.8.3 Romania Real-Time Bidding Market Estimates and Forecasts, By Advertisement Format (2020-2032) (USD Billion)
11.3.1.8.4 Romania Real-Time Bidding Market Estimates and Forecasts, by Application (2020-2032) (USD Billion)
11.3.1.9 Hungary
11.3.1.9.1 Hungary Real-Time Bidding Market Estimates and Forecasts, By Auction Type (2020-2032) (USD Billion)
11.3.1.9.2 Hungary Real-Time Bidding Market Estimates and Forecasts, By Device (2020-2032) (USD Billion)
11.3.1.9.3 Hungary Real-Time Bidding Market Estimates and Forecasts, By Advertisement Format (2020-2032) (USD Billion)
11.3.1.9.4 Hungary Real-Time Bidding Market Estimates and Forecasts, by Application (2020-2032) (USD Billion)
11.3.1.10 Turkey
11.3.1.10.1 Turkey Real-Time Bidding Market Estimates and Forecasts, By Auction Type (2020-2032) (USD Billion)
11.3.1.10.2 Turkey Real-Time Bidding Market Estimates and Forecasts, By Device (2020-2032) (USD Billion)
11.3.1.10.3 Turkey Real-Time Bidding Market Estimates and Forecasts, By Advertisement Format (2020-2032) (USD Billion)
11.3.1.10.4 Turkey Real-Time Bidding Market Estimates and Forecasts, by Application (2020-2032) (USD Billion)
11.3.1.11 Rest of Eastern Europe
11.3.1.11.1 Rest of Eastern Europe Real-Time Bidding Market Estimates and Forecasts, By Auction Type (2020-2032) (USD Billion)
11.3.1.11.2 Rest of Eastern Europe Real-Time Bidding Market Estimates and Forecasts, By Device (2020-2032) (USD Billion)
11.3.1.11.3 Rest of Eastern Europe Real-Time Bidding Market Estimates and Forecasts, By Advertisement Format (2020-2032) (USD Billion)
11.3.1.11.4 Rest of Eastern Europe Real-Time Bidding Market Estimates and Forecasts, by Application (2020-2032) (USD Billion)
11.3.2 Western Europe
11.3.2.1 Trends Analysis
11.3.2.2 Western Europe Real-Time Bidding Market Estimates and Forecasts, by Country (2020-2032) (USD Billion)
11.3.2.3 Western Europe Real-Time Bidding Market Estimates and Forecasts, By Auction Type (2020-2032) (USD Billion)
11.3.2.4 Western Europe Real-Time Bidding Market Estimates and Forecasts, By Device (2020-2032) (USD Billion)
11.3.2.5 Western Europe Real-Time Bidding Market Estimates and Forecasts, By Advertisement Format (2020-2032) (USD Billion)
11.3.2.6 Western Europe Real-Time Bidding Market Estimates and Forecasts, by Application (2020-2032) (USD Billion)
11.3.2.7 Germany
11.3.2.7.1 Germany Real-Time Bidding Market Estimates and Forecasts, By Auction Type (2020-2032) (USD Billion)
11.3.2.7.2 Germany Real-Time Bidding Market Estimates and Forecasts, By Device (2020-2032) (USD Billion)
11.3.2.7.3 Germany Real-Time Bidding Market Estimates and Forecasts, By Advertisement Format (2020-2032) (USD Billion)
11.3.2.7.4 Germany Real-Time Bidding Market Estimates and Forecasts, by Application (2020-2032) (USD Billion)
11.3.2.8 France
11.3.2.8.1 France Real-Time Bidding Market Estimates and Forecasts, By Auction Type (2020-2032) (USD Billion)
11.3.2.8.2 France Real-Time Bidding Market Estimates and Forecasts, By Device (2020-2032) (USD Billion)
11.3.2.8.3 France Real-Time Bidding Market Estimates and Forecasts, By Advertisement Format (2020-2032) (USD Billion)
11.3.2.8.4 France Real-Time Bidding Market Estimates and Forecasts, by Application (2020-2032) (USD Billion)
11.3.2.9 UK
11.3.2.9.1 UK Real-Time Bidding Market Estimates and Forecasts, By Auction Type (2020-2032) (USD Billion)
11.3.2.9.2 UK Real-Time Bidding Market Estimates and Forecasts, By Device (2020-2032) (USD Billion)
11.3.2.9.3 UK Real-Time Bidding Market Estimates and Forecasts, By Advertisement Format (2020-2032) (USD Billion)
11.3.2.9.4 UK Real-Time Bidding Market Estimates and Forecasts, by Application (2020-2032) (USD Billion)
11.3.2.10 Italy
11.3.2.10.1 Italy Real-Time Bidding Market Estimates and Forecasts, By Auction Type (2020-2032) (USD Billion)
11.3.2.10.2 Italy Real-Time Bidding Market Estimates and Forecasts, By Device (2020-2032) (USD Billion)
11.3.2.10.3 Italy Real-Time Bidding Market Estimates and Forecasts, By Advertisement Format (2020-2032) (USD Billion)
11.3.2.10.4 Italy Real-Time Bidding Market Estimates and Forecasts, by Application (2020-2032) (USD Billion)
11.3.2.11 Spain
11.3.2.11.1 Spain Real-Time Bidding Market Estimates and Forecasts, By Auction Type (2020-2032) (USD Billion)
11.3.2.11.2 Spain Real-Time Bidding Market Estimates and Forecasts, By Device (2020-2032) (USD Billion)
11.3.2.11.3 Spain Real-Time Bidding Market Estimates and Forecasts, By Advertisement Format (2020-2032) (USD Billion)
11.3.2.11.4 Spain Real-Time Bidding Market Estimates and Forecasts, by Application (2020-2032) (USD Billion)
11.3.2.12 Netherlands
11.3.2.12.1 Netherlands Real-Time Bidding Market Estimates and Forecasts, By Auction Type (2020-2032) (USD Billion)
11.3.2.12.2 Netherlands Real-Time Bidding Market Estimates and Forecasts, By Device (2020-2032) (USD Billion)
11.3.2.12.3 Netherlands Real-Time Bidding Market Estimates and Forecasts, By Advertisement Format (2020-2032) (USD Billion)
11.3.2.12.4 Netherlands Real-Time Bidding Market Estimates and Forecasts, by Application (2020-2032) (USD Billion)
11.3.2.13 Switzerland
11.3.2.13.1 Switzerland Real-Time Bidding Market Estimates and Forecasts, By Auction Type (2020-2032) (USD Billion)
11.3.2.13.2 Switzerland Real-Time Bidding Market Estimates and Forecasts, By Device (2020-2032) (USD Billion)
11.3.2.13.3 Switzerland Real-Time Bidding Market Estimates and Forecasts, By Advertisement Format (2020-2032) (USD Billion)
11.3.2.13.4 Switzerland Real-Time Bidding Market Estimates and Forecasts, by Application (2020-2032) (USD Billion)
11.3.2.14 Austria
11.3.2.14.1 Austria Real-Time Bidding Market Estimates and Forecasts, By Auction Type (2020-2032) (USD Billion)
11.3.2.14.2 Austria Real-Time Bidding Market Estimates and Forecasts, By Device (2020-2032) (USD Billion)
11.3.2.14.3 Austria Real-Time Bidding Market Estimates and Forecasts, By Advertisement Format (2020-2032) (USD Billion)
11.3.2.14.4 Austria Real-Time Bidding Market Estimates and Forecasts, by Application (2020-2032) (USD Billion)
11.3.2.15 Rest of Western Europe
11.3.2.15.1 Rest of Western Europe Real-Time Bidding Market Estimates and Forecasts, By Auction Type (2020-2032) (USD Billion)
11.3.2.15.2 Rest of Western Europe Real-Time Bidding Market Estimates and Forecasts, By Device (2020-2032) (USD Billion)
11.3.2.15.3 Rest of Western Europe Real-Time Bidding Market Estimates and Forecasts, By Advertisement Format (2020-2032) (USD Billion)
11.3.2.15.4 Rest of Western Europe Real-Time Bidding Market Estimates and Forecasts, by Application (2020-2032) (USD Billion)
11.4 Asia Pacific
11.4.1 Trends Analysis
11.4.2 Asia Pacific Real-Time Bidding Market Estimates and Forecasts, by Country (2020-2032) (USD Billion)
11.4.3 Asia Pacific Real-Time Bidding Market Estimates and Forecasts, By Auction Type (2020-2032) (USD Billion)
11.4.4 Asia Pacific Real-Time Bidding Market Estimates and Forecasts, By Device (2020-2032) (USD Billion)
11.4.5 Asia Pacific Real-Time Bidding Market Estimates and Forecasts, By Advertisement Format (2020-2032) (USD Billion)
11.4.6 Asia Pacific Real-Time Bidding Market Estimates and Forecasts, by Application (2020-2032) (USD Billion)
11.4.7 China
11.4.7.1 China Real-Time Bidding Market Estimates and Forecasts, By Auction Type (2020-2032) (USD Billion)
11.4.7.2 China Real-Time Bidding Market Estimates and Forecasts, By Device (2020-2032) (USD Billion)
11.4.7.3 China Real-Time Bidding Market Estimates and Forecasts, By Advertisement Format (2020-2032) (USD Billion)
11.4.7.4 China Real-Time Bidding Market Estimates and Forecasts, by Application (2020-2032) (USD Billion)
11.4.8 India
11.4.8.1 India Real-Time Bidding Market Estimates and Forecasts, By Auction Type (2020-2032) (USD Billion)
11.4.8.2 India Real-Time Bidding Market Estimates and Forecasts, By Device (2020-2032) (USD Billion)
11.4.8.3 India Real-Time Bidding Market Estimates and Forecasts, By Advertisement Format (2020-2032) (USD Billion)
11.4.8.4 India Real-Time Bidding Market Estimates and Forecasts, by Application (2020-2032) (USD Billion)
11.4.9 Japan
11.4.9.1 Japan Real-Time Bidding Market Estimates and Forecasts, By Auction Type (2020-2032) (USD Billion)
11.4.9.2 Japan Real-Time Bidding Market Estimates and Forecasts, By Device (2020-2032) (USD Billion)
11.4.9.3 Japan Real-Time Bidding Market Estimates and Forecasts, By Advertisement Format (2020-2032) (USD Billion)
11.4.9.4 Japan Real-Time Bidding Market Estimates and Forecasts, by Application (2020-2032) (USD Billion)
11.4.10 South Korea
11.4.10.1 South Korea Real-Time Bidding Market Estimates and Forecasts, By Auction Type (2020-2032) (USD Billion)
11.4.10.2 South Korea Real-Time Bidding Market Estimates and Forecasts, By Device (2020-2032) (USD Billion)
11.4.10.3 South Korea Real-Time Bidding Market Estimates and Forecasts, By Advertisement Format (2020-2032) (USD Billion)
11.4.10.4 South Korea Real-Time Bidding Market Estimates and Forecasts, by Application (2020-2032) (USD Billion)
11.4.11 Vietnam
11.4.11.1 Vietnam Real-Time Bidding Market Estimates and Forecasts, By Auction Type (2020-2032) (USD Billion)
11.4.11.2 Vietnam Real-Time Bidding Market Estimates and Forecasts, By Device (2020-2032) (USD Billion)
11.4.11.3 Vietnam Real-Time Bidding Market Estimates and Forecasts, By Advertisement Format (2020-2032) (USD Billion)
11.4.11.4 Vietnam Real-Time Bidding Market Estimates and Forecasts, by Application (2020-2032) (USD Billion)
11.4.12 Singapore
11.4.12.1 Singapore Real-Time Bidding Market Estimates and Forecasts, By Auction Type (2020-2032) (USD Billion)
11.4.12.2 Singapore Real-Time Bidding Market Estimates and Forecasts, By Device (2020-2032) (USD Billion)
11.4.12.3 Singapore Real-Time Bidding Market Estimates and Forecasts, By Advertisement Format (2020-2032) (USD Billion)
11.4.12.4 Singapore Real-Time Bidding Market Estimates and Forecasts, by Application (2020-2032) (USD Billion)
11.4.13 Australia
11.4.13.1 Australia Real-Time Bidding Market Estimates and Forecasts, By Auction Type (2020-2032) (USD Billion)
11.4.13.2 Australia Real-Time Bidding Market Estimates and Forecasts, By Device (2020-2032) (USD Billion)
11.4.13.3 Australia Real-Time Bidding Market Estimates and Forecasts, By Advertisement Format (2020-2032) (USD Billion)
11.4.13.4 Australia Real-Time Bidding Market Estimates and Forecasts, by Application (2020-2032) (USD Billion)
11.4.14 Rest of Asia Pacific
11.4.14.1 Rest of Asia Pacific Real-Time Bidding Market Estimates and Forecasts, By Auction Type (2020-2032) (USD Billion)
11.4.14.2 Rest of Asia Pacific Real-Time Bidding Market Estimates and Forecasts, By Device (2020-2032) (USD Billion)
11.4.14.3 Rest of Asia Pacific Real-Time Bidding Market Estimates and Forecasts, By Advertisement Format (2020-2032) (USD Billion)
11.4.14.4 Rest of Asia Pacific Real-Time Bidding Market Estimates and Forecasts, by Application (2020-2032) (USD Billion)
11.5 Middle East and Africa
11.5.1 Middle East
11.5.1.1 Trends Analysis
11.5.1.2 Middle East Real-Time Bidding Market Estimates and Forecasts, by Country (2020-2032) (USD Billion)
11.5.1.3 Middle East Real-Time Bidding Market Estimates and Forecasts, By Auction Type (2020-2032) (USD Billion)
11.5.1.4 Middle East Real-Time Bidding Market Estimates and Forecasts, By Device (2020-2032) (USD Billion)
11.5.1.5 Middle East Real-Time Bidding Market Estimates and Forecasts, By Advertisement Format (2020-2032) (USD Billion)
11.5.1.6 Middle East Real-Time Bidding Market Estimates and Forecasts, by Application (2020-2032) (USD Billion)
11.5.1.7 UAE
11.5.1.7.1 UAE Real-Time Bidding Market Estimates and Forecasts, By Auction Type (2020-2032) (USD Billion)
11.5.1.7.2 UAE Real-Time Bidding Market Estimates and Forecasts, By Device (2020-2032) (USD Billion)
11.5.1.7.3 UAE Real-Time Bidding Market Estimates and Forecasts, By Advertisement Format (2020-2032) (USD Billion)
11.5.1.7.4 UAE Real-Time Bidding Market Estimates and Forecasts, by Application (2020-2032) (USD Billion)
11.5.1.8 Egypt
11.5.1.8.1 Egypt Real-Time Bidding Market Estimates and Forecasts, By Auction Type (2020-2032) (USD Billion)
11.5.1.8.2 Egypt Real-Time Bidding Market Estimates and Forecasts, By Device (2020-2032) (USD Billion)
11.5.1.8.3 Egypt Real-Time Bidding Market Estimates and Forecasts, By Advertisement Format (2020-2032) (USD Billion)
11.5.1.8.4 Egypt Real-Time Bidding Market Estimates and Forecasts, by Application (2020-2032) (USD Billion)
11.5.1.9 Saudi Arabia
11.5.1.9.1 Saudi Arabia Real-Time Bidding Market Estimates and Forecasts, By Auction Type (2020-2032) (USD Billion)
11.5.1.9.2 Saudi Arabia Real-Time Bidding Market Estimates and Forecasts, By Device (2020-2032) (USD Billion)
11.5.1.9.3 Saudi Arabia Real-Time Bidding Market Estimates and Forecasts, By Advertisement Format (2020-2032) (USD Billion)
11.5.1.9.4 Saudi Arabia Real-Time Bidding Market Estimates and Forecasts, by Application (2020-2032) (USD Billion)
11.5.1.10 Qatar
11.5.1.10.1 Qatar Real-Time Bidding Market Estimates and Forecasts, By Auction Type (2020-2032) (USD Billion)
11.5.1.10.2 Qatar Real-Time Bidding Market Estimates and Forecasts, By Device (2020-2032) (USD Billion)
11.5.1.10.3 Qatar Real-Time Bidding Market Estimates and Forecasts, By Advertisement Format (2020-2032) (USD Billion)
11.5.1.10.4 Qatar Real-Time Bidding Market Estimates and Forecasts, by Application (2020-2032) (USD Billion)
11.5.1.11 Rest of Middle East
11.5.1.11.1 Rest of Middle East Real-Time Bidding Market Estimates and Forecasts, By Auction Type (2020-2032) (USD Billion)
11.5.1.11.2 Rest of Middle East Real-Time Bidding Market Estimates and Forecasts, By Device (2020-2032) (USD Billion)
11.5.1.11.3 Rest of Middle East Real-Time Bidding Market Estimates and Forecasts, By Advertisement Format (2020-2032) (USD Billion)
11.5.1.11.4 Rest of Middle East Real-Time Bidding Market Estimates and Forecasts, by Application (2020-2032) (USD Billion)
11.5.2 Africa
11.5.2.1 Trends Analysis
11.5.2.2 Africa Real-Time Bidding Market Estimates and Forecasts, by Country (2020-2032) (USD Billion)
11.5.2.3 Africa Real-Time Bidding Market Estimates and Forecasts, By Auction Type (2020-2032) (USD Billion)
11.5.2.4 Africa Real-Time Bidding Market Estimates and Forecasts, By Device (2020-2032) (USD Billion)
11.5.2.5 Africa Real-Time Bidding Market Estimates and Forecasts, By Advertisement Format (2020-2032) (USD Billion)
11.5.2.6 Africa Real-Time Bidding Market Estimates and Forecasts, by Application (2020-2032) (USD Billion)
11.5.2.7 South Africa
11.5.2.7.1 South Africa Real-Time Bidding Market Estimates and Forecasts, By Auction Type (2020-2032) (USD Billion)
11.5.2.7.2 South Africa Real-Time Bidding Market Estimates and Forecasts, By Device (2020-2032) (USD Billion)
11.5.2.7.3 South Africa Real-Time Bidding Market Estimates and Forecasts, By Advertisement Format (2020-2032) (USD Billion)
11.5.2.7.4 South Africa Real-Time Bidding Market Estimates and Forecasts, by Application (2020-2032) (USD Billion)
11.5.2.8 Nigeria
11.5.2.8.1 Nigeria Real-Time Bidding Market Estimates and Forecasts, By Auction Type (2020-2032) (USD Billion)
11.5.2.8.2 Nigeria Real-Time Bidding Market Estimates and Forecasts, By Device (2020-2032) (USD Billion)
11.5.2.8.3 Nigeria Real-Time Bidding Market Estimates and Forecasts, By Advertisement Format (2020-2032) (USD Billion)
11.5.2.8.4 Nigeria Real-Time Bidding Market Estimates and Forecasts, by Application (2020-2032) (USD Billion)
11.5.2.9 Rest of Africa
11.5.2.9.1 Rest of Africa Real-Time Bidding Market Estimates and Forecasts, By Auction Type (2020-2032) (USD Billion)
11.5.2.9.2 Rest of Africa Real-Time Bidding Market Estimates and Forecasts, By Device (2020-2032) (USD Billion)
11.5.2.9.3 Rest of Africa Real-Time Bidding Market Estimates and Forecasts, By Advertisement Format (2020-2032) (USD Billion)
11.5.2.9.4 Rest of Africa Real-Time Bidding Market Estimates and Forecasts, by Application (2020-2032) (USD Billion)
11.6 Latin America
11.6.1 Trends Analysis
11.6.2 Latin America Real-Time Bidding Market Estimates and Forecasts, by Country (2020-2032) (USD Billion)
11.6.3 Latin America Real-Time Bidding Market Estimates and Forecasts, By Auction Type (2020-2032) (USD Billion)
11.6.4 Latin America Real-Time Bidding Market Estimates and Forecasts, By Device (2020-2032) (USD Billion)
11.6.5 Latin America Real-Time Bidding Market Estimates and Forecasts, By Advertisement Format (2020-2032) (USD Billion)
11.6.6 Latin America Real-Time Bidding Market Estimates and Forecasts, by Application (2020-2032) (USD Billion)
11.6.7 Brazil
11.6.7.1 Brazil Real-Time Bidding Market Estimates and Forecasts, By Auction Type (2020-2032) (USD Billion)
11.6.7.2 Brazil Real-Time Bidding Market Estimates and Forecasts, By Device (2020-2032) (USD Billion)
11.6.7.3 Brazil Real-Time Bidding Market Estimates and Forecasts, By Advertisement Format (2020-2032) (USD Billion)
11.6.7.4 Brazil Real-Time Bidding Market Estimates and Forecasts, by Application (2020-2032) (USD Billion)
11.6.8 Argentina
11.6.8.1 Argentina Real-Time Bidding Market Estimates and Forecasts, By Auction Type (2020-2032) (USD Billion)
11.6.8.2 Argentina Real-Time Bidding Market Estimates and Forecasts, By Device (2020-2032) (USD Billion)
11.6.8.3 Argentina Real-Time Bidding Market Estimates and Forecasts, By Advertisement Format (2020-2032) (USD Billion)
11.6.8.4 Argentina Real-Time Bidding Market Estimates and Forecasts, by Application (2020-2032) (USD Billion)
11.6.9 Colombia
11.6.9.1 Colombia Real-Time Bidding Market Estimates and Forecasts, By Auction Type (2020-2032) (USD Billion)
11.6.9.2 Colombia Real-Time Bidding Market Estimates and Forecasts, By Device (2020-2032) (USD Billion)
11.6.9.3 Colombia Real-Time Bidding Market Estimates and Forecasts, By Advertisement Format (2020-2032) (USD Billion)
11.6.9.4 Colombia Real-Time Bidding Market Estimates and Forecasts, by Application (2020-2032) (USD Billion)
11.6.10 Rest of Latin America
11.6.10.1 Rest of Latin America Real-Time Bidding Market Estimates and Forecasts, By Auction Type (2020-2032) (USD Billion)
11.6.10.2 Rest of Latin America Real-Time Bidding Market Estimates and Forecasts, By Device (2020-2032) (USD Billion)
11.6.10.3 Rest of Latin America Real-Time Bidding Market Estimates and Forecasts, By Advertisement Format (2020-2032) (USD Billion)
11.6.10.4 Rest of Latin America Real-Time Bidding Market Estimates and Forecasts, by Application (2020-2032) (USD Billion)
12. Company Profiles
12.1 Google
12.1.1 Company Overview
12.1.2 Financial
12.1.3 Product / Services Offered
12.1.4 SWOT Analysis
12.2 Meta
12.2.1 Company Overview
12.2.2 Financial
12.2.3 Product / Services Offered
12.2.4 SWOT Analysis
12.3 Adobe
12.3.1 Company Overview
12.3.2 Financial
12.3.3 Product / Services Offered
12.3.4 SWOT Analysis
12.4 Amazon
12.4.1 Company Overview
12.4.2 Financial
12.4.3 Product / Services Offered
12.4.4 SWOT Analysis
12.5 Microsoft
12.5.1 Company Overview
12.5.2 Financial
12.5.3 Product / Services Offered
12.5.4 SWOT Analysis
12.6 The Trade Desk
12.6.1 Company Overview
12.6.2 Financial
12.6.3 Product / Services Offered
12.6.4 SWOT Analysis
12.7 MediaMath
12.7.1 Company Overview
12.7.2 Financial
12.7.3 Product / Services Offered
12.7.4 SWOT Analysis
12.8 Criteo
12.8.1 Company Overview
12.8.2 Financial
12.8.3 Product / Services Offered
12.8.4 SWOT Analysis
12.9 AppNexus
12.9.1 Company Overview
12.9.2 Financial
12.9.3 Product / Services Offered
12.9.4 SWOT Analysis
12.10 Rubicon Project
12.10.1 Company Overview
12.10.2 Financial
12.10.3 Product/ Services Offered
12.10.4 SWOT Analysis
13. Use Cases and Best Practices
14. Conclusion
An accurate research report requires proper strategizing as well as implementation. There are multiple factors involved in the completion of good and accurate research report and selecting the best methodology to compete the research is the toughest part. Since the research reports we provide play a crucial role in any company’s decision-making process, therefore we at SNS Insider always believe that we should choose the best method which gives us results closer to reality. This allows us to reach at a stage wherein we can provide our clients best and accurate investment to output ratio.
Each report that we prepare takes a timeframe of 350-400 business hours for production. Starting from the selection of titles through a couple of in-depth brain storming session to the final QC process before uploading our titles on our website we dedicate around 350 working hours. The titles are selected based on their current market cap and the foreseen CAGR and growth.
The 5 steps process:
Step 1: Secondary Research:
Secondary Research or Desk Research is as the name suggests is a research process wherein, we collect data through the readily available information. In this process we use various paid and unpaid databases which our team has access to and gather data through the same. This includes examining of listed companies’ annual reports, Journals, SEC filling etc. Apart from this our team has access to various associations across the globe across different industries. Lastly, we have exchange relationships with various university as well as individual libraries.

Step 2: Primary Research
When we talk about primary research, it is a type of study in which the researchers collect relevant data samples directly, rather than relying on previously collected data. This type of research is focused on gaining content specific facts that can be sued to solve specific problems. Since the collected data is fresh and first hand therefore it makes the study more accurate and genuine.
We at SNS Insider have divided Primary Research into 2 parts.
Part 1 wherein we interview the KOLs of major players as well as the upcoming ones across various geographic regions. This allows us to have their view over the market scenario and acts as an important tool to come closer to the accurate market numbers. As many as 45 paid and unpaid primary interviews are taken from both the demand and supply side of the industry to make sure we land at an accurate judgement and analysis of the market.
This step involves the triangulation of data wherein our team analyses the interview transcripts, online survey responses and observation of on filed participants. The below mentioned chart should give a better understanding of the part 1 of the primary interview.

Part 2: In this part of primary research the data collected via secondary research and the part 1 of the primary research is validated with the interviews from individual consultants and subject matter experts.
Consultants are those set of people who have at least 12 years of experience and expertise within the industry whereas Subject Matter Experts are those with at least 15 years of experience behind their back within the same space. The data with the help of two main processes i.e., FGDs (Focused Group Discussions) and IDs (Individual Discussions). This gives us a 3rd party nonbiased primary view of the market scenario making it a more dependable one while collation of the data pointers.
Step 3: Data Bank Validation
Once all the information is collected via primary and secondary sources, we run that information for data validation. At our intelligence centre our research heads track a lot of information related to the market which includes the quarterly reports, the daily stock prices, and other relevant information. Our data bank server gets updated every fortnight and that is how the information which we collected using our primary and secondary information is revalidated in real time.

Step 4: QA/QC Process
After all the data collection and validation our team does a final level of quality check and quality assurance to get rid of any unwanted or undesired mistakes. This might include but not limited to getting rid of the any typos, duplication of numbers or missing of any important information. The people involved in this process include technical content writers, research heads and graphics people. Once this process is completed the title gets uploader on our platform for our clients to read it.
Step 5: Final QC/QA Process:
This is the last process and comes when the client has ordered the study. In this process a final QA/QC is done before the study is emailed to the client. Since we believe in giving our clients a good experience of our research studies, therefore, to make sure that we do not lack at our end in any way humanly possible we do a final round of quality check and then dispatch the study to the client.
Key Segments:
By Auction Type
Open Auction
Private Auction
Preferred Deals
Programmatic Guaranteed
By Device
Mobile
Desktop
Smart TV
Others
By Advertisement Format
Display Ad
Video Ads
Mobile Ads
Social Media Ads
Native Ads
By Application
Media & Entertainment
Retail and E-commerce
Games
Travel & Luxury
Mobile Applications
Others
Request for Segment Customization as per your Business Requirement: Segment Customization Request
REGIONAL COVERAGE:
North America
US
Canada
Mexico
Europe
Eastern Europe
Poland
Romania
Hungary
Turkey
Rest of Eastern Europe
Western Europe
Germany
France
UK
Italy
Spain
Netherlands
Switzerland
Austria
Rest of Western Europe
Asia Pacific
China
India
Japan
South Korea
Vietnam
Singapore
Australia
Rest of Asia Pacific
Middle East & Africa
Middle East
UAE
Egypt
Saudi Arabia
Qatar
Rest of the Middle East
Africa
Nigeria
South Africa
Rest of Africa
Latin America
Brazil
Argentina
Colombia
Request for Country Level Research Report: Country Level Customization Request
Available Customization
With the given market data, SNS Insider offers customization as per the company’s specific needs. The following customization options are available for the report:
Product Analysis
Criss-Cross segment analysis (e.g. Product X Application)
Product Matrix which gives a detailed comparison of product portfolio of each company
Geographic Analysis
Additional countries in any of the regions
Company Information
Detailed analysis and profiling of additional market players (Up to five)
Embedded AI Market was valued at USD 8.79 billion in 2023 and is expected to reach USD 29.07 billion by 2032, growing at a CAGR of 14.28% from 2024-2032.
The Anti-money Laundering Market was valued at USD 2.53 Billion in 2023 and will reach USD 9.35 Billion by 2032 and grow at a CAGR of 15.67% by 2032.
The Network Processing Unit Market Size was valued at USD 7.16 Billion in 2023 and is expected to reach USD 29.61 Billion by 2032 and grow at a CAGR of 17.1% over the forecast period 2024-2032.
The E-learning Market was valued at USD 308.1 Billion in 2023 and is expected to reach USD 1378.6 Billion by 2032, growing at a CAGR of 18.14% from 2024-2032.
Hyperscale Computing Market was valued at USD 55.60 billion in 2023 and will reach USD 362.54 billion by 2032, growing at a CAGR of 23.22% by 2032.
Customer Intelligence Platform Market was valued at USD 2.5 billion and is expected to reach USD 22.1 billion by 2032, growing at a CAGR of 27.4% over 2024-2032

Hi! Click one of our member below to chat on Phone
© 2025 All Rights Reserved by SNS Insider Pvt Ltd


