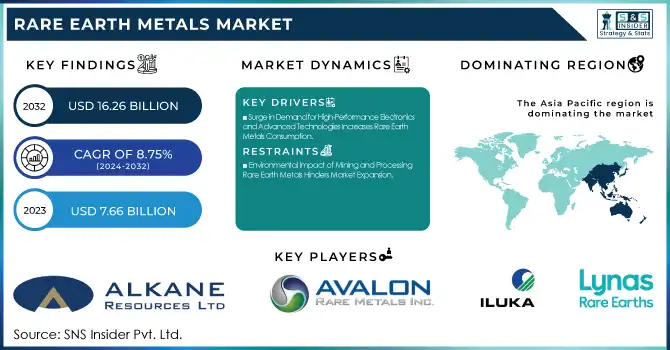
The Rare Earth Metals Market size was valued at USD 7.66 billion in 2023 and is expected to reach USD 16.26 billion by 2032, growing at a CAGR of 8.75% over the forecast period 2024-2032.
To Get more information on Rare Earth Metals Market - Request Free Sample Report
The rare earth metals market is experiencing significant shifts driven by growing global demand for these critical elements, especially in electronics, clean energy, and defense sectors. The market dynamics are heavily influenced by geopolitical tensions, technological advancements, and the need for energy transition materials. Companies are increasingly focused on ensuring a stable supply chain, as rare earth metals are crucial for a wide range of applications such as electric vehicle batteries, wind turbines, and military technologies. For instance, in December 2024, analysts discussed how China could potentially use rare earths as a retaliatory tool against the U.S., highlighting the importance of these elements in international trade relations. This type of geopolitical maneuvering further emphasizes the strategic value of rare earths in global politics.
In terms of recent developments, companies are ramping up efforts to ensure sustainable sourcing of rare earths, particularly with China's dominant position in the market. For example, in January 2022, China merged three state-owned entities in the rare earth sector, namely China Northern Rare Earth Group, to strengthen its pricing power and improve efficiency. This move is expected to have a lasting impact on global supply chains and market pricing. Meanwhile, in June 2024, Brazil joined the race to reduce China's hold on the rare earth industry by announcing plans to ramp up its production efforts, signaling further diversification in the global supply chain.
As for innovation in extraction processes, a study published in July 2024 revealed advances in mining rare earth metals from electronic waste, a breakthrough spearheaded by researchers at ETH Zurich, offering an alternative to traditional mining methods and helping reduce environmental impacts. Additionally, in January 2025, the government of India took a major step by announcing the creation of two new companies aimed at producing rare earth metals and expanding renewable energy capabilities, highlighting the country’s increasing efforts to secure its supply of these critical resources.
Drivers
Rising Demand for Electric Vehicles and Renewable Energy Technologies Drives the Growth of Rare Earth Metals Market
Surge in Demand for High-Performance Electronics and Advanced Technologies Increases Rare Earth Metals Consumption
The continuous advancement of high-performance electronics and cutting-edge technologies is driving a substantial increase in the consumption of rare earth metals. Key components of modern electronics, including smartphones, flat-panel displays, LED lights, and hard drives, rely on rare earth elements such as lanthanum, cerium, and europium. Additionally, developments in advanced technologies, including augmented reality (AR), virtual reality (VR), artificial intelligence (AI), and 5G networks, depend heavily on rare earths to produce miniature, high-efficiency components. As global demand for these technologies expands across consumer, industrial, and commercial applications, the need for rare earth elements continues to grow. The ongoing evolution of these technologies, especially in sectors like telecommunications, consumer electronics, and data storage, underscores the critical role that rare earths play in driving innovation and shaping the future of the electronics industry.
Restraints
Environmental Impact of Mining and Processing Rare Earth Metals Hinders Market Expansion
The mining and processing of rare earth metals have significant environmental implications, which pose a considerable challenge to the market's growth. Mining operations often result in the destruction of ecosystems, land degradation, and pollution due to the release of toxic chemicals, such as sulfuric acid and radioactive materials, into surrounding areas. These environmental issues have prompted increased scrutiny from regulators, environmental groups, and local communities, particularly in regions where rare earths are abundant, such as China and the U.S. Moreover, the processing of rare earth elements generates considerable waste, further exacerbating environmental concerns. Companies are under pressure to adopt cleaner, more sustainable mining practices, but the complex and high-cost nature of these alternatives slows down the transition. Therefore, the environmental impact of rare earth metal extraction and refining remains a critical restraint for the market's growth.
Opportunities
Expansion of Rare Earth Recycling Initiatives and Circular Economy Models Creates New Growth Prospects
Technological Breakthroughs in Efficient Rare Earth Extraction from Non-Traditional Sources Unlock Market Potential
Technological breakthroughs in the efficient extraction of rare earth elements from non-traditional sources are unlocking new market potential. Recent innovations have made it possible to extract rare earth metals from unconventional sources such as coal ash, phosphate deposits, and electronic waste. These new extraction methods provide an opportunity to tap into vast untapped reserves of rare earths that were previously considered too difficult or expensive to exploit. Companies are focusing on developing these alternative extraction techniques to reduce the environmental impact and lower the cost of sourcing rare earth metals. As these technologies continue to advance and scale, they can provide a more diverse and secure supply of rare earths, driving market expansion and reducing reliance on traditional mining practices.
Challenge
Volatility in Global Supply and Pricing of Rare Earth Metals Poses Market Stability Risks
The volatility in the global supply and pricing of rare earth metals presents significant stability risks to the market. Due to their concentrated production in a few countries, particularly China, supply disruptions from geopolitical tensions, trade restrictions, or environmental regulations can lead to unpredictable price fluctuations. These fluctuations can impact industries dependent on rare earths, such as electronics, defense, and renewable energy sectors, which require a stable and predictable supply of these critical materials. Price volatility also complicates long-term planning for companies and industries relying on rare earth metals, making it difficult to secure competitive pricing for materials. As companies seek to navigate these risks, the need for diversified supply chains, alternative sourcing strategies, and long-term price agreements becomes essential for market stability.
By Type
In 2023, neodymium dominated the Rare Earth Metals market with a market share of approximately 37%. Neodymium is crucial for manufacturing high-strength permanent magnets used in various applications, including electric motors, wind turbines, and audio equipment. The surge in demand for electric vehicles (EVs) and renewable energy technologies has significantly boosted the consumption of neodymium-based magnets, making them essential for enhancing energy efficiency and performance. For instance, neodymium-iron-boron (NdFeB) magnets are widely used in EV motors, providing higher torque and efficiency compared to traditional magnets. This increasing reliance on neodymium in critical industries has solidified its position as the leading segment in the rare earth metals market.
By Application
In 2023, the magnets application segment dominated the Rare Earth Metals market with a market share of about 40%. This dominance is primarily driven by the growing demand for high-performance magnets in various sectors, including automotive, electronics, and renewable energy. Magnets made from rare earth elements, particularly neodymium, are essential in electric motors, generators, and magnetic resonance imaging (MRI) machines, among other applications. The rising adoption of electric vehicles and the expansion of renewable energy sources, such as wind turbines, have significantly increased the demand for these magnets. For example, neodymium magnets are crucial in the efficiency and performance of electric drivetrains, which are vital for the success of modern EVs, highlighting the importance of this application in the rare earth metals market.
By End-Use Industry
In 2023, the electronics end-use industry segment dominated the Rare Earth Metals market, capturing a market share of approximately 35%. This growth is primarily attributed to the extensive use of rare earth metals in various electronic devices, including smartphones, tablets, and laptops. Rare earth elements like lanthanum and cerium are essential for producing high-quality display screens, batteries, and other components. Additionally, the increasing demand for advanced technologies such as 5G, artificial intelligence, and the Internet of Things (IoT) further drives the need for rare earth metals in electronics. For instance, cerium is widely used in polishing compounds for semiconductor wafers, underscoring the critical role of the electronics sector in shaping the rare earth metals market landscape.
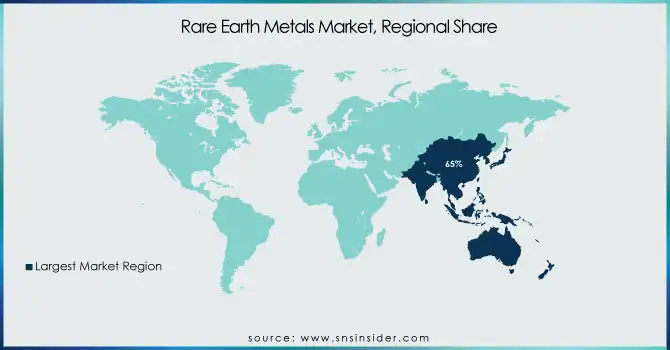
In 2023, Asia-Pacific dominated the Rare Earth Metals Market, accounting for a market share of approximately 65%. This dominance is largely driven by China's unparalleled role as the leading producer and supplier of rare earth elements globally. China accounted for over 85% of the global rare earth production, supported by its abundant reserves and well-established refining and processing infrastructure. The country’s efforts to consolidate its rare earth industry, such as merging major state-owned enterprises into China Rare Earth Group, have further strengthened its control over the market, enabling it to maintain pricing power and secure global supply chains. For instance, China Northern Rare Earth (Group) High-Tech Co., Ltd., one of the largest producers, ensures a consistent supply of magnets, catalysts, and other applications. In addition to China, other key contributors in the region include India and Australia. Australia, with companies like Lynas Rare Earths Ltd., is emerging as a significant player, offering an alternative source for rare earth metals, particularly for markets in Japan, South Korea, and the United States. India has also been ramping up exploration and production efforts through initiatives led by Indian Rare Earths Limited (IREL). The dominance of Asia-Pacific is further bolstered by its strong end-use industries, including electronics manufacturing hubs in China, South Korea, and Japan, and the rapidly expanding electric vehicle market in these nations.
On the other hand, North America emerged as the fastest-growing region in the Rare Earth Metals Market in 2023, with a CAGR of approximately 10%. The region's growth is primarily driven by the increasing focus on reducing dependency on Chinese supply chains and strengthening domestic production capabilities. The United States, in particular, is leading this growth with initiatives to boost rare earth mining and refining operations. For example, MP Materials, a prominent U.S.-based company, has ramped up production at its Mountain Pass mine in California, which is the only operational rare earth mine in the country. Additionally, the U.S. government has provided significant financial support to develop a sustainable supply chain, including investments in processing facilities and partnerships with countries like Australia and Canada. Canada is also making strides in rare earth production, with Avalon Advanced Materials and Canada Rare Earth Corporation focusing on developing local resources to meet rising demand. Furthermore, North America’s expanding electric vehicle market, particularly in the U.S. and Canada, has been a key driver for rare earth magnets used in EV motors. The region’s accelerated adoption of renewable energy technologies, such as wind turbines, has further amplified the demand for rare earth metals, contributing to its robust growth trajectory in 2023.
Get Customized Report as per Your Business Requirement - Enquiry Now
Key Players
Alkane Resources Ltd. (Rare Earth Oxides, Zirconium)
Arafura Rare Earths (Neodymium-Praseodymium, Cerium)
Avalon Advanced Materials Inc. (Rare Earth Concentrates, Zirconium)
China Minmetals Rare Earth Co., Ltd. (Neodymium, Dysprosium)
China Northern Rare Earth (Group) High-Tech Co., Ltd. (Lanthanum, Neodymium)
Iluka Resources Limited (Rare Earth Elements, Zircon)
Lynas Rare Earths Ltd. (Neodymium, Praseodymium)
MP Materials (Neodymium-Praseodymium, Dysprosium)
Northern Minerals Limited (Dysprosium, Terbium)
Shenghe Resources Hording Co., Ltd. (Lanthanum, Neodymium)
Arafura Resources Ltd. (Neodymium, Praseodymium)
Australia Strategic Materials Ltd. (Rare Earth Elements, Zircon)
Baotou HEFA Rare Earth Co. Ltd. (Lanthanum, Cerium)
Bataou Jinmeng Rare Earth Co. (Lanthanum, Neodymium)
China Rare Earth Holdings Limited (Lanthanum, Cerium)
Energy Fuels Inc. (Rare Earth Oxides, Uranium)
Greenland Minerals Ltd. (Neodymium, Praseodymium)
Materion Corporation (Rare Earth Alloys, Neodymium)
Neo Performance Materials Inc. (Neodymium, Dysprosium)
Quest Rare Minerals Ltd. (Neodymium, Praseodymium)
Recent Development:
March 2024: Australian Strategic Materials (ASM) partnered with Bechtel Mining and Metals, Inc. (Bechtel) for the Dubbo Project in New South Wales (NSW). Bechtel will provide Front-End Engineering Design (FEED) services, advancing the project toward its final investment decision and opening new funding opportunities, including from a US government entity.
August 2023: ASM entered a five-year agreement with USA Rare Earth, LLC (USARE) to supply neodymium iron boron (NdFeB) alloy, strengthening its global presence in rare earth metals.
October 2023: Shenghe Resources Holding Co., Ltd announced plans to acquire shares in Vital Metals to support its Nechalacho rare earth project in Canada and Wigu Hill project in Tanzania. This acquisition aims to enhance Shenghe's global business footprint and secure additional rare earth resources.
July 2023: ASM signed a non-binding MOU with Blackstone Minerals Limited and Vietnam Rare Earths Company (VTRE) to establish a fully integrated rare earth industry in Vietnam, covering mining to finished products.
| Report Attributes | Details |
|---|---|
| Market Size in 2023 | US$ 7.66 Billion |
| Market Size by 2032 | US$ 16.26 Billion |
| CAGR | CAGR of 8.75% From 2024 to 2032 |
| Base Year | 2023 |
| Forecast Period | 2024-2032 |
| Historical Data | 2020-2022 |
| Report Scope & Coverage | Market Size, Segments Analysis, Competitive Landscape, Regional Analysis, DROC & SWOT Analysis, Forecast Outlook |
| Key Segments | •By Type (Lanthanum, Praseodymium, Cerium, Neodymium, Samarium, Others) •By Application (Magnets, Catalysts, Metallurgy, Phosphors, Ceramics, Polishing, Others) •By End-Use Industry (Electronics, Automotive, Energy, Defense & Aerospace, Healthcare, Others) |
| Regional Analysis/Coverage | North America (US, Canada, Mexico), Europe (Eastern Europe [Poland, Romania, Hungary, Turkey, Rest of Eastern Europe] Western Europe] Germany, France, UK, Italy, Spain, Netherlands, Switzerland, Austria, Rest of Western Europe]), Asia Pacific (China, India, Japan, South Korea, Vietnam, Singapore, Australia, Rest of Asia Pacific), Middle East & Africa (Middle East [UAE, Egypt, Saudi Arabia, Qatar, Rest of Middle East], Africa [Nigeria, South Africa, Rest of Africa], Latin America (Brazil, Argentina, Colombia, Rest of Latin America) |
| Company Profiles | Lynas Rare Earths Ltd., MP Materials, China Northern Rare Earth (Group) High-Tech Co., Ltd., Arafura Rare Earths, China Minmetals Rare Earth Co., Ltd., Iluka Resources Limited, Shenghe Resources Hording Co., Ltd., Alkane Resources Ltd., Northern Minerals Limited, Avalon Advanced Materials Inc. and other key players |
| Key Drivers | •Rising Demand for Electric Vehicles and Renewable Energy Technologies Drives the Growth of Rare Earth Metals Market •Surge in Demand for High-Performance Electronics and Advanced Technologies Increases Rare Earth Metals Consumption |
| Restraints | •Environmental Impact of Mining and Processing Rare Earth Metals Hinders Market Expansion |
Ans: The Rare Earth Metals Market is expected to grow at a CAGR of 8.75%
Ans: The Rare Earth Metals Market size was valued at USD 7.66 billion in 2023 and is expected to reach USD 16.26 billion by 2032.
Ans: Rare earth recycling, government incentives, strategic alliances, and new extraction technologies are driving market growth by enhancing supply security and sustainability.
Ans: Global supply and price volatility of rare earth metals threaten market stability, impacting industries and necessitating diversified supply chains and alternative sourcing strategies.
Ans: Asia-Pacific dominated the Rare Earth Metals Market with an estimated 65% share, driven by China's leading role in production, supported by India and Australia, and bolstered by strong regional demand from electronics and electric vehicle industries.
Table of Contents:
1. Introduction
1.1 Market Definition
1.2 Scope (Inclusion and Exclusions)
1.3 Research Assumptions
2. Executive Summary
2.1 Market Overview
2.2 Regional Synopsis
2.3 Competitive Summary
3. Research Methodology
3.1 Top-Down Approach
3.2 Bottom-up Approach
3.3. Data Validation
3.4 Primary Interviews
4. Market Dynamics Impact Analysis
4.1 Market Driving Factors Analysis
4.1.1 Drivers
4.1.2 Restraints
4.1.3 Opportunities
4.1.4 Challenges
4.2 PESTLE Analysis
4.3 Porter’s Five Forces Model
5. Statistical Insights and Trends Reporting
5.1 Production Volume and Distribution
5.2 Global Trade and Export Trends
5.3 Price Volatility and Fluctuations
5.4 Investment in Mining and Extraction Technologies
5.5 Supply Chain Dynamics
6. Competitive Landscape
6.1 List of Major Companies, By Region
6.2 Market Share Analysis, By Region
6.3 Product Benchmarking
6.3.1 Product specifications and features
6.3.2 Pricing
6.4 Strategic Initiatives
6.4.1 Marketing and promotional activities
6.4.2 Distribution and supply chain strategies
6.4.3 Expansion plans and new product launches
6.4.4 Strategic partnerships and collaborations
6.5 Technological Advancements
6.6 Market Positioning and Branding
7. Rare Earth Metals Market Segmentation, by Type
7.1 Chapter Overview
7.2 Lanthanum
7.2.1 Lanthanum Market Trends Analysis (2020-2032)
7.2.2 Lanthanum Market Size Estimates and Forecasts to 2032 (USD Billion)
7.3 Praseodymium
7.3.1 Praseodymium Market Trends Analysis (2020-2032)
7.3.2 Praseodymium Market Size Estimates and Forecasts to 2032 (USD Billion)
7.4 Cerium
7.4.1 Cerium Market Trends Analysis (2020-2032)
7.4.2 Cerium Market Size Estimates and Forecasts to 2032 (USD Billion)
7.5 Neodymium
7.5.1 Neodymium Market Trends Analysis (2020-2032)
7.5.2 Neodymium Market Size Estimates and Forecasts to 2032 (USD Billion)
7.6 Samarium
7.6.1 Samarium Market Trends Analysis (2020-2032)
7.6.2 Samarium Market Size Estimates and Forecasts to 2032 (USD Billion)
7.7 Others
7.7.1 Others Market Trends Analysis (2020-2032)
7.7.2 Others Market Size Estimates and Forecasts to 2032 (USD Billion)
8. Rare Earth Metals Market Segmentation, by Application
8.1 Chapter Overview
8.2 Magnets
8.2.1 Magnets Market Trends Analysis (2020-2032)
8.2.2 Magnets Market Size Estimates and Forecasts to 2032 (USD Billion)
8.3 Catalysts
8.3.1 Catalysts Market Trends Analysis (2020-2032)
8.3.2 Catalysts Market Size Estimates and Forecasts to 2032 (USD Billion)
8.4 Metallurgy
8.4.1 Metallurgy Market Trends Analysis (2020-2032)
8.4.2 Metallurgy Market Size Estimates and Forecasts to 2032 (USD Billion)
8.5 Phosphors
8.5.1 Phosphors Market Trends Analysis (2020-2032)
8.5.2 Phosphors Market Size Estimates and Forecasts to 2032 (USD Billion)
8.6 Ceramics
8.6.1 Ceramics Market Trends Analysis (2020-2032)
8.6.2 Ceramics Market Size Estimates and Forecasts to 2032 (USD Billion)
8.7 Polishing
8.7.1 Polishing Market Trends Analysis (2020-2032)
8.7.2 Polishing Market Size Estimates and Forecasts to 2032 (USD Billion)
8.8 Others
8.8.1 Others Market Trends Analysis (2020-2032)
8.8.2 Others Market Size Estimates and Forecasts to 2032 (USD Billion)
9. Rare Earth Metals Market Segmentation, by End-Use Industry
9.1 Chapter Overview
9.2 Electronics
9.2.1 Electronics Market Trends Analysis (2020-2032)
9.2.2 Electronics Market Size Estimates and Forecasts to 2032 (USD Billion)
9.3 Automotive
9.3.1 Automotive Market Trends Analysis (2020-2032)
9.3.2 Automotive Market Size Estimates and Forecasts to 2032 (USD Billion)
9.4 Energy
9.4.1 Energy Market Trends Analysis (2020-2032)
9.4.2 Energy Market Size Estimates and Forecasts to 2032 (USD Billion)
9.5 Defense & Aerospace
9.5.1 Defense & Aerospace Market Trends Analysis (2020-2032)
9.5.2 Defense & Aerospace Market Size Estimates and Forecasts to 2032 (USD Billion)
9.6 Healthcare
9.6.1 Healthcare Market Trends Analysis (2020-2032)
9.6.2 Healthcare Market Size Estimates and Forecasts to 2032 (USD Billion)
9.7 Others
9.7.1 Others Market Trends Analysis (2020-2032)
9.7.2 Others Market Size Estimates and Forecasts to 2032 (USD Billion)
10. Regional Analysis
10.1 Chapter Overview
10.2 North America
10.2.1 Trends Analysis
10.2.2 North America Rare Earth Metals Market Estimates and Forecasts, by Country (2020-2032) (USD Billion)
10.2.3 North America Rare Earth Metals Market Estimates and Forecasts, by Type (2020-2032) (USD Billion)
10.2.4 North America Rare Earth Metals Market Estimates and Forecasts, by Application (2020-2032) (USD Billion)
10.2.5 North America Rare Earth Metals Market Estimates and Forecasts, by End-Use Industry (2020-2032) (USD Billion)
10.2.6 USA
10.2.6.1 USA Rare Earth Metals Market Estimates and Forecasts, by Type (2020-2032) (USD Billion)
10.2.6.2 USA Rare Earth Metals Market Estimates and Forecasts, by Application (2020-2032) (USD Billion)
10.2.6.3 USA Rare Earth Metals Market Estimates and Forecasts, by End-Use Industry (2020-2032) (USD Billion)
10.2.7 Canada
10.2.7.1 Canada Rare Earth Metals Market Estimates and Forecasts, by Type (2020-2032) (USD Billion)
10.2.7.2 Canada Rare Earth Metals Market Estimates and Forecasts, by Application (2020-2032) (USD Billion)
10.2.7.3 Canada Rare Earth Metals Market Estimates and Forecasts, by End-Use Industry (2020-2032) (USD Billion)
10.2.8 Mexico
10.2.8.1 Mexico Rare Earth Metals Market Estimates and Forecasts, by Type (2020-2032) (USD Billion)
10.2.8.2 Mexico Rare Earth Metals Market Estimates and Forecasts, by Application (2020-2032) (USD Billion)
10.2.8.3 Mexico Rare Earth Metals Market Estimates and Forecasts, by End-Use Industry (2020-2032) (USD Billion)
10.3 Europe
10.3.1 Eastern Europe
10.3.1.1 Trends Analysis
10.3.1.2 Eastern Europe Rare Earth Metals Market Estimates and Forecasts, by Country (2020-2032) (USD Billion)
10.3.1.3 Eastern Europe Rare Earth Metals Market Estimates and Forecasts, by Type (2020-2032) (USD Billion)
10.3.1.4 Eastern Europe Rare Earth Metals Market Estimates and Forecasts, by Application (2020-2032) (USD Billion)
10.3.1.5 Eastern Europe Rare Earth Metals Market Estimates and Forecasts, by End-Use Industry (2020-2032) (USD Billion)
10.3.1.6 Poland
10.3.1.6.1 Poland Rare Earth Metals Market Estimates and Forecasts, by Type (2020-2032) (USD Billion)
10.3.1.6.2 Poland Rare Earth Metals Market Estimates and Forecasts, by Application (2020-2032) (USD Billion)
10.3.1.6.3 Poland Rare Earth Metals Market Estimates and Forecasts, by End-Use Industry (2020-2032) (USD Billion)
10.3.1.7 Romania
10.3.1.7.1 Romania Rare Earth Metals Market Estimates and Forecasts, by Type (2020-2032) (USD Billion)
10.3.1.7.2 Romania Rare Earth Metals Market Estimates and Forecasts, by Application (2020-2032) (USD Billion)
10.3.1.7.3 Romania Rare Earth Metals Market Estimates and Forecasts, by End-Use Industry (2020-2032) (USD Billion)
10.3.1.8 Hungary
10.3.1.8.1 Hungary Rare Earth Metals Market Estimates and Forecasts, by Type (2020-2032) (USD Billion)
10.3.1.8.2 Hungary Rare Earth Metals Market Estimates and Forecasts, by Application (2020-2032) (USD Billion)
10.3.1.8.3 Hungary Rare Earth Metals Market Estimates and Forecasts, by End-Use Industry (2020-2032) (USD Billion)
10.3.1.9 Turkey
10.3.1.9.1 Turkey Rare Earth Metals Market Estimates and Forecasts, by Type (2020-2032) (USD Billion)
10.3.1.9.2 Turkey Rare Earth Metals Market Estimates and Forecasts, by Application (2020-2032) (USD Billion)
10.3.1.9.3 Turkey Rare Earth Metals Market Estimates and Forecasts, by End-Use Industry (2020-2032) (USD Billion)
10.3.1.10 Rest of Eastern Europe
10.3.1.10.1 Rest of Eastern Europe Rare Earth Metals Market Estimates and Forecasts, by Type (2020-2032) (USD Billion)
10.3.1.10.2 Rest of Eastern Europe Rare Earth Metals Market Estimates and Forecasts, by Application (2020-2032) (USD Billion)
10.3.1.10.3 Rest of Eastern Europe Rare Earth Metals Market Estimates and Forecasts, by End-Use Industry (2020-2032) (USD Billion)
10.3.2 Western Europe
10.3.2.1 Trends Analysis
10.3.2.2 Western Europe Rare Earth Metals Market Estimates and Forecasts, by Country (2020-2032) (USD Billion)
10.3.2.3 Western Europe Rare Earth Metals Market Estimates and Forecasts, by Type (2020-2032) (USD Billion)
10.3.2.4 Western Europe Rare Earth Metals Market Estimates and Forecasts, by Application (2020-2032) (USD Billion)
10.3.2.5 Western Europe Rare Earth Metals Market Estimates and Forecasts, by End-Use Industry (2020-2032) (USD Billion)
10.3.2.6 Germany
10.3.2.6.1 Germany Rare Earth Metals Market Estimates and Forecasts, by Type (2020-2032) (USD Billion)
10.3.2.6.2 Germany Rare Earth Metals Market Estimates and Forecasts, by Application (2020-2032) (USD Billion)
10.3.2.6.3 Germany Rare Earth Metals Market Estimates and Forecasts, by End-Use Industry (2020-2032) (USD Billion)
10.3.2.7 France
10.3.2.7.1 France Rare Earth Metals Market Estimates and Forecasts, by Type (2020-2032) (USD Billion)
10.3.2.7.2 France Rare Earth Metals Market Estimates and Forecasts, by Application (2020-2032) (USD Billion)
10.3.2.7.3 France Rare Earth Metals Market Estimates and Forecasts, by End-Use Industry (2020-2032) (USD Billion)
10.3.2.8 UK
10.3.2.8.1 UK Rare Earth Metals Market Estimates and Forecasts, by Type (2020-2032) (USD Billion)
10.3.2.8.2 UK Rare Earth Metals Market Estimates and Forecasts, by Application (2020-2032) (USD Billion)
10.3.2.8.3 UK Rare Earth Metals Market Estimates and Forecasts, by End-Use Industry (2020-2032) (USD Billion)
10.3.2.9 Italy
10.3.2.9.1 Italy Rare Earth Metals Market Estimates and Forecasts, by Type (2020-2032) (USD Billion)
10.3.2.9.2 Italy Rare Earth Metals Market Estimates and Forecasts, by Application (2020-2032) (USD Billion)
10.3.2.9.3 Italy Rare Earth Metals Market Estimates and Forecasts, by End-Use Industry (2020-2032) (USD Billion)
10.3.2.10 Spain
10.3.2.10.1 Spain Rare Earth Metals Market Estimates and Forecasts, by Type (2020-2032) (USD Billion)
10.3.2.10.2 Spain Rare Earth Metals Market Estimates and Forecasts, by Application (2020-2032) (USD Billion)
10.3.2.10.3 Spain Rare Earth Metals Market Estimates and Forecasts, by End-Use Industry (2020-2032) (USD Billion)
10.3.2.11 Netherlands
10.3.2.11.1 Netherlands Rare Earth Metals Market Estimates and Forecasts, by Type (2020-2032) (USD Billion)
10.3.2.11.2 Netherlands Rare Earth Metals Market Estimates and Forecasts, by Application (2020-2032) (USD Billion)
10.3.2.11.3 Netherlands Rare Earth Metals Market Estimates and Forecasts, by End-Use Industry (2020-2032) (USD Billion)
10.3.2.12 Switzerland
10.3.2.12.1 Switzerland Rare Earth Metals Market Estimates and Forecasts, by Type (2020-2032) (USD Billion)
10.3.2.12.2 Switzerland Rare Earth Metals Market Estimates and Forecasts, by Application (2020-2032) (USD Billion)
10.3.2.12.3 Switzerland Rare Earth Metals Market Estimates and Forecasts, by End-Use Industry (2020-2032) (USD Billion)
10.3.2.13 Austria
10.3.2.13.1 Austria Rare Earth Metals Market Estimates and Forecasts, by Type (2020-2032) (USD Billion)
10.3.2.13.2 Austria Rare Earth Metals Market Estimates and Forecasts, by Application (2020-2032) (USD Billion)
10.3.2.13.3 Austria Rare Earth Metals Market Estimates and Forecasts, by End-Use Industry (2020-2032) (USD Billion)
10.3.2.14 Rest of Western Europe
10.3.2.14.1 Rest of Western Europe Rare Earth Metals Market Estimates and Forecasts, by Type (2020-2032) (USD Billion)
10.3.2.14.2 Rest of Western Europe Rare Earth Metals Market Estimates and Forecasts, by Application (2020-2032) (USD Billion)
10.3.2.14.3 Rest of Western Europe Rare Earth Metals Market Estimates and Forecasts, by End-Use Industry (2020-2032) (USD Billion)
10.4 Asia Pacific
10.4.1 Trends Analysis
10.4.2 Asia Pacific Rare Earth Metals Market Estimates and Forecasts, by Country (2020-2032) (USD Billion)
10.4.3 Asia Pacific Rare Earth Metals Market Estimates and Forecasts, by Type (2020-2032) (USD Billion)
10.4.4 Asia Pacific Rare Earth Metals Market Estimates and Forecasts, by Application (2020-2032) (USD Billion)
10.4.5 Asia Pacific Rare Earth Metals Market Estimates and Forecasts, by End-Use Industry (2020-2032) (USD Billion)
10.4.6 China
10.4.6.1 China Rare Earth Metals Market Estimates and Forecasts, by Type (2020-2032) (USD Billion)
10.4.6.2 China Rare Earth Metals Market Estimates and Forecasts, by Application (2020-2032) (USD Billion)
10.4.6.3 China Rare Earth Metals Market Estimates and Forecasts, by End-Use Industry (2020-2032) (USD Billion)
10.4.7 India
10.4.7.1 India Rare Earth Metals Market Estimates and Forecasts, by Type (2020-2032) (USD Billion)
10.4.7.2 India Rare Earth Metals Market Estimates and Forecasts, by Application (2020-2032) (USD Billion)
10.4.7.3 India Rare Earth Metals Market Estimates and Forecasts, by End-Use Industry (2020-2032) (USD Billion)
10.4.8 Japan
10.4.8.1 Japan Rare Earth Metals Market Estimates and Forecasts, by Type (2020-2032) (USD Billion)
10.4.8.2 Japan Rare Earth Metals Market Estimates and Forecasts, by Application (2020-2032) (USD Billion)
10.4.8.3 Japan Rare Earth Metals Market Estimates and Forecasts, by End-Use Industry (2020-2032) (USD Billion)
10.4.9 South Korea
10.4.9.1 South Korea Rare Earth Metals Market Estimates and Forecasts, by Type (2020-2032) (USD Billion)
10.4.9.2 South Korea Rare Earth Metals Market Estimates and Forecasts, by Application (2020-2032) (USD Billion)
10.4.9.3 South Korea Rare Earth Metals Market Estimates and Forecasts, by End-Use Industry (2020-2032) (USD Billion)
10.4.10 Vietnam
10.4.10.1 Vietnam Rare Earth Metals Market Estimates and Forecasts, by Type (2020-2032) (USD Billion)
10.4.10.2 Vietnam Rare Earth Metals Market Estimates and Forecasts, by Application (2020-2032) (USD Billion)
10.4.10.3 Vietnam Rare Earth Metals Market Estimates and Forecasts, by End-Use Industry (2020-2032) (USD Billion)
10.4.11 Singapore
10.4.11.1 Singapore Rare Earth Metals Market Estimates and Forecasts, by Type (2020-2032) (USD Billion)
10.4.11.2 Singapore Rare Earth Metals Market Estimates and Forecasts, by Application (2020-2032) (USD Billion)
10.4.11.3 Singapore Rare Earth Metals Market Estimates and Forecasts, by End-Use Industry (2020-2032) (USD Billion)
10.4.12 Australia
10.4.12.1 Australia Rare Earth Metals Market Estimates and Forecasts, by Type (2020-2032) (USD Billion)
10.4.12.2 Australia Rare Earth Metals Market Estimates and Forecasts, by Application (2020-2032) (USD Billion)
10.4.12.3 Australia Rare Earth Metals Market Estimates and Forecasts, by End-Use Industry (2020-2032) (USD Billion)
10.4.13 Rest of Asia Pacific
10.4.13.1 Rest of Asia Pacific Rare Earth Metals Market Estimates and Forecasts, by Type (2020-2032) (USD Billion)
10.4.13.2 Rest of Asia Pacific Rare Earth Metals Market Estimates and Forecasts, by Application (2020-2032) (USD Billion)
10.4.13.3 Rest of Asia Pacific Rare Earth Metals Market Estimates and Forecasts, by End-Use Industry (2020-2032) (USD Billion)
10.5 Middle East and Africa
10.5.1 Middle East
10.5.1.1 Trends Analysis
10.5.1.2 Middle East Rare Earth Metals Market Estimates and Forecasts, by Country (2020-2032) (USD Billion)
10.5.1.3 Middle East Rare Earth Metals Market Estimates and Forecasts, by Type (2020-2032) (USD Billion)
10.5.1.4 Middle East Rare Earth Metals Market Estimates and Forecasts, by Application (2020-2032) (USD Billion)
10.5.1.5 Middle East Rare Earth Metals Market Estimates and Forecasts, by End-Use Industry (2020-2032) (USD Billion)
10.5.1.6 UAE
10.5.1.6.1 UAE Rare Earth Metals Market Estimates and Forecasts, by Type (2020-2032) (USD Billion)
10.5.1.6.2 UAE Rare Earth Metals Market Estimates and Forecasts, by Application (2020-2032) (USD Billion)
10.5.1.6.3 UAE Rare Earth Metals Market Estimates and Forecasts, by End-Use Industry (2020-2032) (USD Billion)
10.5.1.7 Egypt
10.5.1.7.1 Egypt Rare Earth Metals Market Estimates and Forecasts, by Type (2020-2032) (USD Billion)
10.5.1.7.2 Egypt Rare Earth Metals Market Estimates and Forecasts, by Application (2020-2032) (USD Billion)
10.5.1.7.3 Egypt Rare Earth Metals Market Estimates and Forecasts, by End-Use Industry (2020-2032) (USD Billion)
10.5.1.8 Saudi Arabia
10.5.1.8.1 Saudi Arabia Rare Earth Metals Market Estimates and Forecasts, by Type (2020-2032) (USD Billion)
10.5.1.8.2 Saudi Arabia Rare Earth Metals Market Estimates and Forecasts, by Application (2020-2032) (USD Billion)
10.5.1.8.3 Saudi Arabia Rare Earth Metals Market Estimates and Forecasts, by End-Use Industry (2020-2032) (USD Billion)
10.5.1.9 Qatar
10.5.1.9.1 Qatar Rare Earth Metals Market Estimates and Forecasts, by Type (2020-2032) (USD Billion)
10.5.1.9.2 Qatar Rare Earth Metals Market Estimates and Forecasts, by Application (2020-2032) (USD Billion)
10.5.1.9.3 Qatar Rare Earth Metals Market Estimates and Forecasts, by End-Use Industry (2020-2032) (USD Billion)
10.5.1.10 Rest of Middle East
10.5.1.10.1 Rest of Middle East Rare Earth Metals Market Estimates and Forecasts, by Type (2020-2032) (USD Billion)
10.5.1.10.2 Rest of Middle East Rare Earth Metals Market Estimates and Forecasts, by Application (2020-2032) (USD Billion)
10.5.1.10.3 Rest of Middle East Rare Earth Metals Market Estimates and Forecasts, by End-Use Industry (2020-2032) (USD Billion)
10.5.2 Africa
10.5.2.1 Trends Analysis
10.5.2.2 Africa Rare Earth Metals Market Estimates and Forecasts, by Country (2020-2032) (USD Billion)
10.5.2.3 Africa Rare Earth Metals Market Estimates and Forecasts, by Type (2020-2032) (USD Billion)
10.5.2.4 Africa Rare Earth Metals Market Estimates and Forecasts, by Application (2020-2032) (USD Billion)
10.5.2.5 Africa Rare Earth Metals Market Estimates and Forecasts, by End-Use Industry (2020-2032) (USD Billion)
10.5.2.6 South Africa
10.5.2.6.1 South Africa Rare Earth Metals Market Estimates and Forecasts, by Type (2020-2032) (USD Billion)
10.5.2.6.2 South Africa Rare Earth Metals Market Estimates and Forecasts, by Application (2020-2032) (USD Billion)
10.5.2.6.3 South Africa Rare Earth Metals Market Estimates and Forecasts, by End-Use Industry (2020-2032) (USD Billion)
10.5.2.7 Nigeria
10.5.2.7.1 Nigeria Rare Earth Metals Market Estimates and Forecasts, by Type (2020-2032) (USD Billion)
10.5.2.7.2 Nigeria Rare Earth Metals Market Estimates and Forecasts, by Application (2020-2032) (USD Billion)
10.5.2.7.3 Nigeria Rare Earth Metals Market Estimates and Forecasts, by End-Use Industry (2020-2032) (USD Billion)
10.5.2.8 Rest of Africa
10.5.2.8.1 Rest of Africa Rare Earth Metals Market Estimates and Forecasts, by Type (2020-2032) (USD Billion)
10.5.2.8.2 Rest of Africa Rare Earth Metals Market Estimates and Forecasts, by Application (2020-2032) (USD Billion)
10.5.2.8.3 Rest of Africa Rare Earth Metals Market Estimates and Forecasts, by End-Use Industry (2020-2032) (USD Billion)
10.6 Latin America
10.6.1 Trends Analysis
10.6.2 Latin America Rare Earth Metals Market Estimates and Forecasts, by Country (2020-2032) (USD Billion)
10.6.3 Latin America Rare Earth Metals Market Estimates and Forecasts, by Type (2020-2032) (USD Billion)
10.6.4 Latin America Rare Earth Metals Market Estimates and Forecasts, by Application (2020-2032) (USD Billion)
10.6.5 Latin America Rare Earth Metals Market Estimates and Forecasts, by End-Use Industry (2020-2032) (USD Billion)
10.6.6 Brazil
10.6.6.1 Brazil Rare Earth Metals Market Estimates and Forecasts, by Type (2020-2032) (USD Billion)
10.6.6.2 Brazil Rare Earth Metals Market Estimates and Forecasts, by Application (2020-2032) (USD Billion)
10.6.6.3 Brazil Rare Earth Metals Market Estimates and Forecasts, by End-Use Industry (2020-2032) (USD Billion)
10.6.7 Argentina
10.6.7.1 Argentina Rare Earth Metals Market Estimates and Forecasts, by Type (2020-2032) (USD Billion)
10.6.7.2 Argentina Rare Earth Metals Market Estimates and Forecasts, by Application (2020-2032) (USD Billion)
10.6.7.3 Argentina Rare Earth Metals Market Estimates and Forecasts, by End-Use Industry (2020-2032) (USD Billion)
10.6.8 Colombia
10.6.8.1 Colombia Rare Earth Metals Market Estimates and Forecasts, by Type (2020-2032) (USD Billion)
10.6.8.2 Colombia Rare Earth Metals Market Estimates and Forecasts, by Application (2020-2032) (USD Billion)
10.6.8.3 Colombia Rare Earth Metals Market Estimates and Forecasts, by End-Use Industry (2020-2032) (USD Billion)
10.6.9 Rest of Latin America
10.6.9.1 Rest of Latin America Rare Earth Metals Market Estimates and Forecasts, by Type (2020-2032) (USD Billion)
10.6.9.2 Rest of Latin America Rare Earth Metals Market Estimates and Forecasts, by Application (2020-2032) (USD Billion)
10.6.9.3 Rest of Latin America Rare Earth Metals Market Estimates and Forecasts, by End-Use Industry (2020-2032) (USD Billion)
11. Company Profiles
11.1 Lynas Rare Earths Ltd.
11.1.1 Company Overview
11.1.2 Financial
11.1.3 Products/ Services Offered
11.1.4 SWOT Analysis
11.2 MP Materials
11.2.1 Company Overview
11.2.2 Financial
11.2.3 Products/ Services Offered
11.2.4 SWOT Analysis
11.3 China Northern Rare Earth (Group) High-Tech Co., Ltd.
11.3.1 Company Overview
11.3.2 Financial
11.3.3 Products/ Services Offered
11.3.4 SWOT Analysis
11.4 Arafura Rare Earths
11.4.1 Company Overview
11.4.2 Financial
11.4.3 Products/ Services Offered
11.4.4 SWOT Analysis
11.5 China Minmetals Rare Earth Co., Ltd.
11.5.1 Company Overview
11.5.2 Financial
11.5.3 Products/ Services Offered
11.5.4 SWOT Analysis
11.6 Iluka Resources Limited
11.6.1 Company Overview
11.6.2 Financial
11.6.3 Products/ Services Offered
11.6.4 SWOT Analysis
11.7 Shenghe Resources Hording Co., Ltd.
11.7.1 Company Overview
11.7.2 Financial
11.7.3 Products/ Services Offered
11.7.4 SWOT Analysis
11.8 Alkane Resources Ltd.
11.8.1 Company Overview
11.8.2 Financial
11.8.3 Products/ Services Offered
11.8.4 SWOT Analysis
11.9 Northern Minerals Limited
11.9.1 Company Overview
11.9.2 Financial
11.9.3 Products/ Services Offered
11.9.4 SWOT Analysis
11.10 Avalon Advanced Materials Inc.
11.10.1 Company Overview
11.10.2 Financial
11.10.3 Products/ Services Offered
11.10.4 SWOT Analysis
12. Use Cases and Best Practices
13. Conclusion
An accurate research report requires proper strategizing as well as implementation. There are multiple factors involved in the completion of good and accurate research report and selecting the best methodology to compete the research is the toughest part. Since the research reports we provide play a crucial role in any company’s decision-making process, therefore we at SNS Insider always believe that we should choose the best method which gives us results closer to reality. This allows us to reach at a stage wherein we can provide our clients best and accurate investment to output ratio.
Each report that we prepare takes a timeframe of 350-400 business hours for production. Starting from the selection of titles through a couple of in-depth brain storming session to the final QC process before uploading our titles on our website we dedicate around 350 working hours. The titles are selected based on their current market cap and the foreseen CAGR and growth.
The 5 steps process:
Step 1: Secondary Research:
Secondary Research or Desk Research is as the name suggests is a research process wherein, we collect data through the readily available information. In this process we use various paid and unpaid databases which our team has access to and gather data through the same. This includes examining of listed companies’ annual reports, Journals, SEC filling etc. Apart from this our team has access to various associations across the globe across different industries. Lastly, we have exchange relationships with various university as well as individual libraries.

Step 2: Primary Research
When we talk about primary research, it is a type of study in which the researchers collect relevant data samples directly, rather than relying on previously collected data. This type of research is focused on gaining content specific facts that can be sued to solve specific problems. Since the collected data is fresh and first hand therefore it makes the study more accurate and genuine.
We at SNS Insider have divided Primary Research into 2 parts.
Part 1 wherein we interview the KOLs of major players as well as the upcoming ones across various geographic regions. This allows us to have their view over the market scenario and acts as an important tool to come closer to the accurate market numbers. As many as 45 paid and unpaid primary interviews are taken from both the demand and supply side of the industry to make sure we land at an accurate judgement and analysis of the market.
This step involves the triangulation of data wherein our team analyses the interview transcripts, online survey responses and observation of on filed participants. The below mentioned chart should give a better understanding of the part 1 of the primary interview.

Part 2: In this part of primary research the data collected via secondary research and the part 1 of the primary research is validated with the interviews from individual consultants and subject matter experts.
Consultants are those set of people who have at least 12 years of experience and expertise within the industry whereas Subject Matter Experts are those with at least 15 years of experience behind their back within the same space. The data with the help of two main processes i.e., FGDs (Focused Group Discussions) and IDs (Individual Discussions). This gives us a 3rd party nonbiased primary view of the market scenario making it a more dependable one while collation of the data pointers.
Step 3: Data Bank Validation
Once all the information is collected via primary and secondary sources, we run that information for data validation. At our intelligence centre our research heads track a lot of information related to the market which includes the quarterly reports, the daily stock prices, and other relevant information. Our data bank server gets updated every fortnight and that is how the information which we collected using our primary and secondary information is revalidated in real time.

Step 4: QA/QC Process
After all the data collection and validation our team does a final level of quality check and quality assurance to get rid of any unwanted or undesired mistakes. This might include but not limited to getting rid of the any typos, duplication of numbers or missing of any important information. The people involved in this process include technical content writers, research heads and graphics people. Once this process is completed the title gets uploader on our platform for our clients to read it.
Step 5: Final QC/QA Process:
This is the last process and comes when the client has ordered the study. In this process a final QA/QC is done before the study is emailed to the client. Since we believe in giving our clients a good experience of our research studies, therefore, to make sure that we do not lack at our end in any way humanly possible we do a final round of quality check and then dispatch the study to the client.
Key Segments:
By Type
Lanthanum
Praseodymium
Cerium
Neodymium
Samarium
Others
By Application
Magnets
Catalysts
Metallurgy
Phosphors
Ceramics
Polishing
Others
By End-Use Industry
Electronics
Automotive
Energy
Defense & Aerospace
Healthcare
Others
Request for Segment Customization as per your Business Requirement: Segment Customization Request
Regional Coverage:
North America
US
Canada
Mexico
Europe
Eastern Europe
Poland
Romania
Hungary
Turkey
Rest of Eastern Europe
Western Europe
Germany
France
UK
Italy
Spain
Netherlands
Switzerland
Austria
Rest of Western Europe
Asia Pacific
China
India
Japan
South Korea
Vietnam
Singapore
Australia
Rest of Asia Pacific
Middle East & Africa
Middle East
UAE
Egypt
Saudi Arabia
Qatar
Rest of Middle East
Africa
Nigeria
South Africa
Rest of Africa
Latin America
Brazil
Argentina
Colombia
Rest of Latin America
Request for Country Level Research Report: Country Level Customization Request
Available Customization
With the given market data, SNS Insider offers customization as per the company’s specific needs. The following customization options are available for the report:
Product Analysis
Criss-Cross segment analysis (e.g. Product X Application)
Product Matrix which gives a detailed comparison of product portfolio of each company
Geographic Analysis
Additional countries in any of the regions
Company Information
Detailed analysis and profiling of additional market players (Up to five)
Calcined Bauxite Market size was USD 1.7 billion in 2023 and is expected to reach USD 2.5 billion by 2032, growing at a CAGR of 4.1% from 2024 to 2032.
The Green and Bio Polyols market size was valued at USD 5.11 billion in 2023 and is expected to reach USD 10.87 billion by 2032 and grow at a CAGR of 8.75% over the forecast period 2024-2032.
The Direct Reduced Iron Market Size was valued at USD 37.66 Billion in 2023 and is expected to reach USD 75.96 Billion by 2032, growing at a CAGR of 7.98% over the forecast period of 2024-2032.
The Adipic Acid Market size was valued at USD 5.20 billion in 2023. It is estimated to hit USD 7.46 billion by 2032 and grow at a CAGR of 4.09% over the forecast period of 2024-2032.
The Self Compacting Concrete Market Size was valued at USD 13.4 billion in 2023 and is expected to reach USD 26.5 billion by 2032 and grow at a CAGR of 7.9% over the forecast period 2024-2032.
The plant growth regulators market size was valued at USD 3.29 billion in 2023 and is expected to reach USD 6.45 billion by 2032, growing at a CAGR of 7.77% over the forecast period of 2024-2032.

Hi! Click one of our member below to chat on Phone
© 2025 All Rights Reserved by SNS Insider Pvt Ltd


