Get More Information on R&D in GCC Market - Request Sample Report
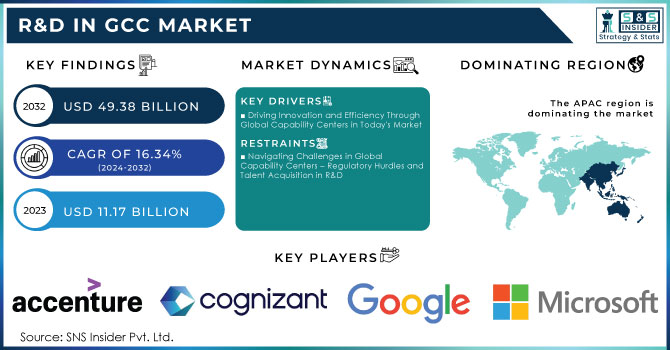
The R&D in GCC Market Size was valued at USD 11.17 billion in 2023 and is expected to reach USD 49.38 billion by 2032 with a growing CAGR of 16.34% over the forecast period of 2024-2032.
R&D in the Global Capability Center market has emerged as a huge force for companies trying to leverage global talent resources and expertise. GCCs encompass a wide array of functions such as R&D, IT, business process outsourcing, and engineering solution services usually located within large corporate structures. These centers play a huge role in providing companies with access to specialized skills, facilitating cost reductions, and enhancing operational efficiencies so that companies can remain competitive in the global market.
The distinction that makes R&D in GCCs is the emphasis on innovation and high-tech projects as key objectives. Through collaborating with the local ecosystems, research institutions, startups, and industry partners, the GCCs act as catalysts for innovation in a way that may further lead to innovation in new products and services. Therefore, it is not only beneficial for the company to produce more innovations but also to form it as an industry leader. Moreover, GCCs are important tools for conducting market research that can help promote the organizational understanding of variations in market dynamics as well as consumers' preferences. In these creative surroundings, the GCCs are also able to produce prototypes that can be used in determining the feasibility and workability of new products.
The R&D in GCC market is growing at an impressive pace due to mounting demand for both innovation and operational efficiency in almost all parts of the economy. India positioned itself as an attractive destination for GCCs, backed by initiatives from government agencies in the form of Special Economic Zones that enjoy tax breaks. Tamil Nadu recently became the first state in India to announce GCC-specific subsidies.
On the other hand, according to reports, by the year 2023, the R&D in GCC market in that region had grown in a manner that added up to as high as 50,000 new jobs within three years alone, in the State of Tamil Nadu. The growth trajectory points to the continued globalization of businesses and the increasing need for the advancement of technology. In this scenario, where firms are expected to continue competing in an increasingly dynamic market environment, the investment in R&D-focused GCCs would still be strategic. These centers do not only serve to fuel sustainable growth and innovation but are also more importantly shaping the future face of global business operations. As organizations utilize the capacities of GCCs, they are always well prepared to face the intricacies of modern product development and meet every demand that is defined in an ever-evolving marketplace which will propel the growth of the R&D in GCC market.
Drivers
Driving Innovation and Efficiency Through Global Capability Centers in Today's Market
The Global Capability Center market propelling with the rapid growth, and the trends are being driven by various factors. One key reason for this trend is investment in R&D by multinational companies to remain innovative and competitive. ZS Associates and Torry Harris, among others, are setting up GCCs to add operational efficiency and further service excellence. India is also emerging as a prominent GCC hub, provided with a vast pool of skilled talent, a favorable regulatory environment, and cost-effective operational benefits. The increase in digital technologies and increasing demand for agile business solutions led organizations to make use of GCCs for enhanced R&D capabilities. Additionally, GCCs enable firms to accelerate product development cycles and respond rapidly to market demands that are considerably important in today's fast business landscape. As companies are trying to be more efficient and reduce time-to-market while increasing innovation, the use of GCCs is bound to increase and firms are going to splurge on advanced technologies as well as talent acquisition. More importantly, this impending focus on sustainability and corporate social responsibility is forcing organizations to set up GCCs, where profitability besides being enhanced also socially contributes. This integrative approach to R&D in GCCs makes them a progressively important component of the global business ecosystem.
Restraints
Navigating Challenges in Global Capability Centers – Regulatory Hurdles and Talent Acquisition in R&D
Regulatory complexity can become an obstacle in locating GCCs in various regions due to factors of compliance with local laws and international standards. Talent shortages in specific high-tech domains can also constrain the operational effectiveness of GCCs. Economic and political uncertainty may also deter investment in GCCs, as companies exercise caution while expanding their operations in uncertain environments. These restraints require strategic solutions in terms of addressing the regulatory as well as talent acquisition challenges for full exploitation of the benefits of GCCs in R&D.
By Industry
Information technology and software development represented the market leader in 2023, accounting for approximately 50.36%. This is due to the growing dependence on digital solutions within many types of businesses, spurred by the ever-increasing transition into a wholly digital system. Digital transformation has thus led to a significant investment of capital in software development, cloud computing, and cybersecurity by business entities to gain greater operational efficiency and customer engagement.
The Pharmaceutical and Biotechnology segment is the fastest growing segment with the highest growth rate during the forecast period 2024-2032. This is mostly attributed to trends in advancements of biopharmaceuticals, growing emphasis on personalized medicine, and increasing investment in R&D activities. The increasing interest in developing vaccines and new drug therapies amidst continued challenges in the health sector, such as those arising in the aftermath of the COVID-19 pandemic, has driven demand for biopharmaceuticals to unprecedented levels.
By Technology
At the R&D level, in 2023, AI and ML technologies held a market share of around 52.3%. Their dominance in the R&D in GCC market is mainly because of enhanced patient care, smooth operations, and data-driven decision-making. These algorithms are increasingly being used for applications in diagnostics, predictive analytics, and personalized treatment plans- which is a really valuable support to healthcare providers. Increased AI integration in applications including applications such as radiology and genomics has significantly improved accuracy and efficiency, thus assuring it of a leadership spot in the market.
Cloud Computing is anticipated to be the fastest-growing technology segment over the forecast period 2024-2032. This growth rate can be attributed to the increased demand by healthcare organizations for scalable storage and data management capabilities. Access to and sharing of patient information are increasingly important as healthcare systems migrate toward electronic health records (EHR) and telemedicine. The flexibility and cost-effectiveness of cloud solutions coupled with enhanced security measures in place for data have provided an opening for this segment to grow at a very high pace during the next few years.
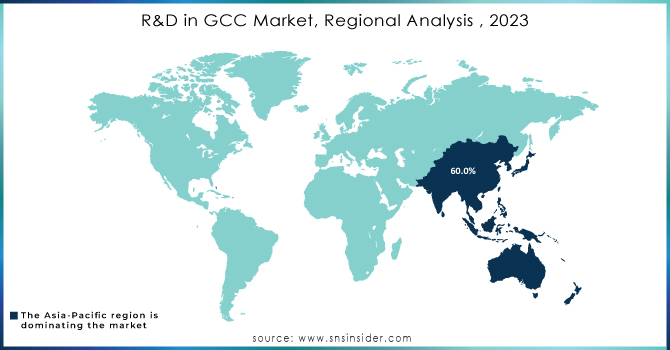
Asia-Pacific emerged as the most prominent hub in 2023, accounting for approximately 60.0% of the R&D GCC market. The cradle of such success rests in India with a vast pool of talent, is cost-effective, and now offers leadership in IT and software development. India has been likened to being the "GCC capital of the world." Multi-nationals increasingly rely on India for software engineering, data analytics, and digital transformation initiatives. China contributes more to the region, especially in manufacturing and electronics. The Asia-Pacific region is expected to expand at a CAGR of % from 2024 to 2032.
North America is robustly led by the U.S., which continues to make large investments in AI, ML, and cloud computing, hence driving innovation. The setting up of GCCs in North America is led by companies across industries such as IT, pharmaceutical, and automotive to maintain business competitiveness and enhance productivity. There is a growing trend of collaboration with offshore GCCs, especially those of India, in addition to concerted domestic efforts, as GCCs are hubs for advanced R&D initiatives. The region is expected to expand at a CAGR of % from 2024 through 2032, driven by sustained demand towards technological adoption and innovation-driven sectors.
Need Any Customization Research On R&D in GCC Market - Inquiry Now
Accenture
IBM
Tata Consultancy Services (TCS)
Wipro
Cognizant
Saudi Aramco
Qatar Petroleum
Emirates National Oil Company (ENOC)
Siemens
Microsoft
Huawei
Riyadh Techno Valley
Dubai Silicon Oasis Authority (DSOA)
Gulf Organization for Research and Development (GORD)
Frost & Sullivan
In Sept 2024, ZF Lifetec inaugurated a new Global Capability Center (GCC) in Hyderabad, backed by a €5 million investment aimed at advancing passive safety technology. This facility is designed to enhance road safety not only in India but also on a global scale. It will initially employ approximately 220 professionals, with plans for future expansion. The initiative has received support from the Telangana government, highlighting the region's commitment to fostering innovation in safety technologies.
In July 2024, Tamil Nadu positioned itself as a hub for Global Capability Centers (GCC), with pharmaceutical giant AstraZeneca spearheading the initiative. In addition to AstraZeneca, major players such as Pfizer and Roche have established their centers in the state, further enhancing its appeal as a key destination for R&D activities in the region.
| Report Attributes | Details |
|---|---|
| Market Size in 2023 | US$ 11.17 billion |
| Market Size by 2032 | US$ 49.38 billion |
| CAGR | CAGR of 16.34% From 2024 to 2032 |
| Base Year | 2023 |
| Forecast Period | 2024-2032 |
| Historical Data | 2020-2022 |
| Report Scope & Coverage | Market Size, Segments Analysis, Competitive Landscape, Regional Analysis, DROC & SWOT Analysis, Forecast Outlook |
| Key Segments |
• By Industry (Information Technology (IT) and Software Development, Pharmaceutical and Biotechnology, Manufacturing and Engineering, Consumer Electronics, Automotive) |
| Regional Analysis/Coverage | North America (US, Canada, Mexico), Europe (Eastern Europe [Poland, Romania, Hungary, Turkey, Rest of Eastern Europe] Western Europe [Germany, France, UK, Italy, Spain, Netherlands, Switzerland, Austria, Rest of Western Europe]), Asia Pacific (China, India, Japan, South Korea, Vietnam, Singapore, Australia, Rest of Asia Pacific), Middle East & Africa (Middle East [UAE, Egypt, Saudi Arabia, Qatar, Rest of Middle East], Africa [Nigeria, South Africa, Rest of Africa], Latin America (Brazil, Argentina, Colombia, Rest of Latin America) |
| Company Profiles | Accenture, IBM, Tata Consultancy Services (TCS), Wipro, Cognizant, Saudi Aramco, Qatar Petroleum, Emirates National Oil Company (ENOC), Siemens, Microsoft, Huawei, Riyadh Techno Valley, Dubai Silicon Oasis Authority (DSOA), Gulf Organization for Research and Development (GORD), Frost & Sullivan |
| Key Drivers | • Driving Innovation and Efficiency Through Global Capability Centers in Today's Market |
| Restraints | • Navigating Challenges in Global Capability Centers – Regulatory Hurdles and Talent Acquisition in R&D • Inadequate reimbursement policies |
Ans: The estimated compound annual growth rate is 16.34% during the forecast period for the R&D in GCC market.
Ans: The projected market value of the R&D in GCC market is estimated at USD 11.17 billion in 2023 and is expected to reach USD 49.38 billion by 2032.
Ans: Driving innovation and efficiency through global capability centers in today's market.
Ans: Navigating challenges in global capability centers – regulatory hurdles and talent acquisition in R&D
Ans: Asia-Pacific is the dominant region with a 60.0% share in the R&D in GCC market.
1. Introduction
1.1 Market Definition
1.2 Scope (Inclusion and Exclusions)
1.3 Research Assumptions
2. Executive Summary
2.1 Market Overview
2.2 Regional Synopsis
2.3 Competitive Summary
3. Research Methodology
3.1 Top-Down Approach
3.2 Bottom-up Approach
3.3. Data Validation
3.4 Primary Interviews
4. Market Dynamics Impact Analysis
4.1 Market Driving Factors Analysis
4.1.2 Drivers
4.1.2 Restraints
4.1.3 Opportunities
4.1.4 Challenges
4.2 PESTLE Analysis
4.3 Porter’s Five Forces Model
5. Statistical Insights and Trends Reporting
5.1 Number of GCCs Established by Region (2023)
5.2 R&D Spending by GCCs (2023), by Region
5.3 Number of Patents Filed or Innovations Developed through GCCs (2020-2032), by Region
5.4 R&D Workforce Distribution in GCCs, by Region (2023)
5.5 Investment in Emerging Technologies by GCCs (AI, ML, Cloud, etc.), by Region (2023)
6. Competitive Landscape
6.1 List of Major Companies, By Region
6.2 Market Share Analysis, By Region
6.3 Service Benchmarking
6.3.1 Service specifications and features
6.3.2 Pricing
6.4 Strategic Initiatives
6.4.1 Marketing and promotional activities
6.4.2 Distribution and Supply Chain Strategies
6.4.3 Expansion plans and new Service launches
6.4.4 Strategic partnerships and collaborations
6.5 Technological Advancements
6.6 Market Positioning and Branding
7. R&D in GCC Market Segmentation, by Industry
7.2 Information Technology (IT) and Software Development
7.2.1 Information Technology (IT) and Software Development Market Trends Analysis (2020-2032)
7.2.2 Information Technology (IT) and Software Development Market Size Estimates and Forecasts to 2032 (USD Million)
7.3 Pharmaceutical and Biotechnology
7.3.1 Pharmaceutical and Biotechnology Market Trends Analysis (2020-2032)
7.3.2 Pharmaceutical and Biotechnology Market Size Estimates and Forecasts to 2032 (USD Million)
7.4 Manufacturing and Engineering
7.4.1 Manufacturing and Engineering Market Trends Analysis (2020-2032)
7.4.2 Manufacturing and Engineering Market Size Estimates and Forecasts to 2032 (USD Million)
7.5 Consumer Electronics
7.5.1 Consumer Electronics Market Trends Analysis (2020-2032)
7.5.2 Consumer Electronics Market Size Estimates and Forecasts to 2032 (USD Million)
7.6 Automotive
7.6.1 Automotive Market Trends Analysis (2020-2032)
7.6.2 Automotive Market Size Estimates and Forecasts to 2032 (USD Million)
8. R&D in GCC Market Segmentation, by Technology
8.2 Artificial Intelligence and Machine Learning
8.2.1 Artificial Intelligence and Machine Learning Market Trends Analysis (2020-2032)
8.2.2 Artificial Intelligence and Machine Learning Market Size Estimates and Forecasts to 2032 (USD Million)
8.3 Cloud Computing
8.3.1 Cloud Computing Market Trends Analysis (2020-2032)
8.3.2 Cloud Computing Market Size Estimates and Forecasts to 2032 (USD Million)
8.4 Internet of Things (IoT)
8.4.1 Internet of Things (IoT) Market Trends Analysis (2020-2032)
8.4.2 Internet of Things (IoT) Market Size Estimates and Forecasts to 2032 (USD Million)
8.5 Biotechnology Tools
8.5.1 Biotechnology Tools Market Trends Analysis (2020-2032)
8.5.2 Biotechnology Tools Market Size Estimates and Forecasts to 2032 (USD Million)
9. Regional Analysis
9.1 Chapter Overview
9.2 North America
9.2.1 Trends Analysis
9.2.2 North America R&D in GCC Market Estimates and Forecasts, by Country (2020-2032) (USD Million)
9.2.3 North America R&D in GCC Market Estimates and Forecasts, by Industry (2020-2032) (USD Million)
9.2.4 North America R&D in GCC Market Estimates and Forecasts, by Technology(2020-2032) (USD Million)
9.2.5 USA
9.2.5.1 USA R&D in GCC Market Estimates and Forecasts, by Industry (2020-2032) (USD Million)
9.2.5.2 USA R&D in GCC Market Estimates and Forecasts, by Technology(2020-2032) (USD Million)
9.2.6 Canada
9.2.6.1 Canada R&D in GCC Market Estimates and Forecasts, by Industry (2020-2032) (USD Million)
9.2.6.2 Canada R&D in GCC Market Estimates and Forecasts, by Technology(2020-2032) (USD Million)
9.2.7 Mexico
9.2.7.1 Mexico R&D in GCC Market Estimates and Forecasts, by Industry (2020-2032) (USD Million)
9.2.7.2 Mexico R&D in GCC Market Estimates and Forecasts, by Technology(2020-2032) (USD Million)
9.3 Europe
9.3.1 Eastern Europe
9.3.1.1 Trends Analysis
9.3.1.2 Eastern Europe R&D in GCC Market Estimates and Forecasts, by Country (2020-2032) (USD Million)
9.3.1.3 Eastern Europe R&D in GCC Market Estimates and Forecasts, by Industry (2020-2032) (USD Million)
9.3.1.4 Eastern Europe R&D in GCC Market Estimates and Forecasts, by Technology(2020-2032) (USD Million)
9.3.1.5 Poland
9.3.1.5.1 Poland R&D in GCC Market Estimates and Forecasts, by Industry (2020-2032) (USD Million)
9.3.1.5.2 Poland R&D in GCC Market Estimates and Forecasts, by Technology(2020-2032) (USD Million)
9.3.1.6 Romania
9.3.1.6.1 Romania R&D in GCC Market Estimates and Forecasts, by Industry (2020-2032) (USD Million)
9.3.1.6.2 Romania R&D in GCC Market Estimates and Forecasts, by Technology(2020-2032) (USD Million)
9.3.1.7 Hungary
9.3.1.7.1 Hungary R&D in GCC Market Estimates and Forecasts, by Industry (2020-2032) (USD Million)
9.3.1.7.2 Hungary R&D in GCC Market Estimates and Forecasts, by Technology(2020-2032) (USD Million)
9.3.1.8 Turkey
9.3.1.8.1 Turkey R&D in GCC Market Estimates and Forecasts, by Industry (2020-2032) (USD Million)
9.3.1.8.2 Turkey R&D in GCC Market Estimates and Forecasts, by Technology(2020-2032) (USD Million)
9.3.1.9 Rest of Eastern Europe
9.3.1.9.1 Rest of Eastern Europe R&D in GCC Market Estimates and Forecasts, by Industry (2020-2032) (USD Million)
9.3.1.9.2 Rest of Eastern Europe R&D in GCC Market Estimates and Forecasts, by Technology(2020-2032) (USD Million)
9.3.2 Western Europe
9.3.2.1 Trends Analysis
9.3.2.2 Western Europe R&D in GCC Market Estimates and Forecasts, by Country (2020-2032) (USD Million)
9.3.2.3 Western Europe R&D in GCC Market Estimates and Forecasts, by Industry (2020-2032) (USD Million)
9.3.2.4 Western Europe R&D in GCC Market Estimates and Forecasts, by Technology(2020-2032) (USD Million)
9.3.2.5 Germany
9.3.2.5.1 Germany R&D in GCC Market Estimates and Forecasts, by Industry (2020-2032) (USD Million)
9.3.2.5.2 Germany R&D in GCC Market Estimates and Forecasts, by Technology(2020-2032) (USD Million)
9.3.2.6 France
9.3.2.6.1 France R&D in GCC Market Estimates and Forecasts, by Industry (2020-2032) (USD Million)
9.3.2.6.2 France R&D in GCC Market Estimates and Forecasts, by Technology(2020-2032) (USD Million)
9.3.2.7 UK
9.3.2.7.1 UK R&D in GCC Market Estimates and Forecasts, by Industry (2020-2032) (USD Million)
9.3.2.7.2 UK R&D in GCC Market Estimates and Forecasts, by Technology(2020-2032) (USD Million)
9.3.2.8 Italy
9.3.2.8.1 Italy R&D in GCC Market Estimates and Forecasts, by Industry (2020-2032) (USD Million)
9.3.2.8.2 Italy R&D in GCC Market Estimates and Forecasts, by Technology(2020-2032) (USD Million)
9.3.2.9 Spain
9.3.2.9.1 Spain R&D in GCC Market Estimates and Forecasts, by Industry (2020-2032) (USD Million)
9.3.2.9.2 Spain R&D in GCC Market Estimates and Forecasts, by Technology(2020-2032) (USD Million)
9.3.2.10 Netherlands
9.3.2.10.1 Netherlands R&D in GCC Market Estimates and Forecasts, by Industry (2020-2032) (USD Million)
9.3.2.10.2 Netherlands R&D in GCC Market Estimates and Forecasts, by Technology(2020-2032) (USD Million)
9.3.2.11 Switzerland
9.3.2.11.1 Switzerland R&D in GCC Market Estimates and Forecasts, by Industry (2020-2032) (USD Million)
9.3.2.11.2 Switzerland R&D in GCC Market Estimates and Forecasts, by Technology(2020-2032) (USD Million)
9.3.2.12 Austria
9.3.2.12.1 Austria R&D in GCC Market Estimates and Forecasts, by Industry (2020-2032) (USD Million)
9.3.2.12.2 Austria R&D in GCC Market Estimates and Forecasts, by Technology(2020-2032) (USD Million)
9.3.2.13 Rest of Western Europe
9.3.2.13.1 Rest of Western Europe R&D in GCC Market Estimates and Forecasts, by Industry (2020-2032) (USD Million)
9.3.2.13.2 Rest of Western Europe R&D in GCC Market Estimates and Forecasts, by Technology(2020-2032) (USD Million)
9.4 Asia Pacific
9.4.1 Trends Analysis
9.4.2 Asia Pacific R&D in GCC Market Estimates and Forecasts, by Country (2020-2032) (USD Million)
9.4.3 Asia Pacific R&D in GCC Market Estimates and Forecasts, by Industry (2020-2032) (USD Million)
9.4.4 Asia Pacific R&D in GCC Market Estimates and Forecasts, by Technology(2020-2032) (USD Million)
9.4.5 China
9.4.5.1 China R&D in GCC Market Estimates and Forecasts, by Industry (2020-2032) (USD Million)
9.4.5.2 China R&D in GCC Market Estimates and Forecasts, by Technology(2020-2032) (USD Million)
9.4.6 India
9.4.5.1 India R&D in GCC Market Estimates and Forecasts, by Industry (2020-2032) (USD Million)
9.4.5.2 India R&D in GCC Market Estimates and Forecasts, by Technology(2020-2032) (USD Million)
9.4.5 Japan
9.4.5.1 Japan R&D in GCC Market Estimates and Forecasts, by Industry (2020-2032) (USD Million)
9.4.5.2 Japan R&D in GCC Market Estimates and Forecasts, by Technology(2020-2032) (USD Million)
9.4.6 South Korea
9.4.6.1 South Korea R&D in GCC Market Estimates and Forecasts, by Industry (2020-2032) (USD Million)
9.4.6.2 South Korea R&D in GCC Market Estimates and Forecasts, by Technology(2020-2032) (USD Million)
9.4.7 Vietnam
9.4.7.1 Vietnam R&D in GCC Market Estimates and Forecasts, by Industry (2020-2032) (USD Million)
9.2.7.2 Vietnam R&D in GCC Market Estimates and Forecasts, by Technology(2020-2032) (USD Million)
9.4.8 Singapore
9.4.8.1 Singapore R&D in GCC Market Estimates and Forecasts, by Industry (2020-2032) (USD Million)
9.4.8.2 Singapore R&D in GCC Market Estimates and Forecasts, by Technology(2020-2032) (USD Million)
9.4.9 Australia
9.4.9.1 Australia R&D in GCC Market Estimates and Forecasts, by Industry (2020-2032) (USD Million)
9.4.9.2 Australia R&D in GCC Market Estimates and Forecasts, by Technology(2020-2032) (USD Million)
9.4.10 Rest of Asia Pacific
9.4.10.1 Rest of Asia Pacific R&D in GCC Market Estimates and Forecasts, by Industry (2020-2032) (USD Million)
9.4.10.2 Rest of Asia Pacific R&D in GCC Market Estimates and Forecasts, by Technology(2020-2032) (USD Million)
9.5 Middle East and Africa
9.5.1 Middle East
9.5.1.1 Trends Analysis
9.5.1.2 Middle East R&D in GCC Market Estimates and Forecasts, by Country (2020-2032) (USD Million)
9.5.1.3 Middle East R&D in GCC Market Estimates and Forecasts, by Industry (2020-2032) (USD Million)
9.5.1.4 Middle East R&D in GCC Market Estimates and Forecasts, by Technology (2020-2032) (USD Million)
9.5.1.5 UAE
9.5.1.5.1 UAE R&D in GCC Market Estimates and Forecasts, by Industry (2020-2032) (USD Million)
9.5.1.5.2 UAE R&D in GCC Market Estimates and Forecasts, by Technology (2020-2032) (USD Million)
9.5.1.6 Egypt
9.5.1.6.1 Egypt R&D in GCC Market Estimates and Forecasts, by Industry (2020-2032) (USD Million)
9.5.1.6.2 Egypt R&D in GCC Market Estimates and Forecasts, by Technology (2020-2032) (USD Million)
9.5.1.7 Saudi Arabia
9.5.1.7.1 Saudi Arabia R&D in GCC Market Estimates and Forecasts, by Industry (2020-2032) (USD Million)
9.5.1.7.2 Saudi Arabia R&D in GCC Market Estimates and Forecasts, by Technology(2020-2032) (USD Million)
9.5.1.8 Qatar
9.5.1.8.1 Qatar R&D in GCC Market Estimates and Forecasts, by Industry (2020-2032) (USD Million)
9.5.1.8.2 Qatar R&D in GCC Market Estimates and Forecasts, by Technology(2020-2032) (USD Million)
9.5.1.9 Rest of Middle East
9.5.1.9.1 Rest of Middle East R&D in GCC Market Estimates and Forecasts, by Industry (2020-2032) (USD Million)
9.5.1.9.2 Rest of Middle East R&D in GCC Market Estimates and Forecasts, by Technology(2020-2032) (USD Million)
9.5.2 Africa
9.5.2.1 Trends Analysis
9.5.2.2 Africa R&D in GCC Market Estimates and Forecasts, by Country (2020-2032) (USD Million)
9.5.2.3 Africa R&D in GCC Market Estimates and Forecasts, by Industry (2020-2032) (USD Million)
9.5.2.4 Africa R&D in GCC Market Estimates and Forecasts, by Technology(2020-2032) (USD Million)
9.5.2.5 South Africa
9.5.2.5.1 South Africa R&D in GCC Market Estimates and Forecasts, by Industry (2020-2032) (USD Million)
9.5.2.5.2 South Africa R&D in GCC Market Estimates and Forecasts, by Technology(2020-2032) (USD Million)
9.5.2.6 Nigeria
9.5.2.6.1 Nigeria R&D in GCC Market Estimates and Forecasts, by Industry (2020-2032) (USD Million)
9.5.2.6.2 Nigeria R&D in GCC Market Estimates and Forecasts, by Technology(2020-2032) (USD Million)
9.6 Latin America
9.6.1 Trends Analysis
9.6.2 Latin America R&D in GCC Market Estimates and Forecasts, by Country (2020-2032) (USD Million)
9.6.3 Latin America R&D in GCC Market Estimates and Forecasts, by Industry (2020-2032) (USD Million)
9.6.4 Latin America R&D in GCC Market Estimates and Forecasts, by Technology(2020-2032) (USD Million)
9.6.5 Brazil
9.6.5.1 Brazil R&D in GCC Market Estimates and Forecasts, by Industry (2020-2032) (USD Million)
9.6.5.2 Brazil R&D in GCC Market Estimates and Forecasts, by Technology(2020-2032) (USD Million)
9.6.6 Argentina
9.6.6.1 Argentina R&D in GCC Market Estimates and Forecasts, by Industry (2020-2032) (USD Million)
9.6.6.2 Argentina R&D in GCC Market Estimates and Forecasts, by Technology(2020-2032) (USD Million)
9.6.7 Colombia
9.6.7.1 Colombia R&D in GCC Market Estimates and Forecasts, by Industry (2020-2032) (USD Million)
9.6.7.2 Colombia R&D in GCC Market Estimates and Forecasts, by Technology(2020-2032) (USD Million)
9.6.8 Rest of Latin America
9.6.8.1 Rest of Latin America R&D in GCC Market Estimates and Forecasts, by Industry (2020-2032) (USD Million)
9.6.8.2 Rest of Latin America R&D in GCC Market Estimates and Forecasts, by Technology(2020-2032) (USD Million)
10. Company Profiles
10.1 Accenture
10.1.1 Company Overview
10.1.2 Financial
10.1.3 Services/ Services Offered
110.1.4 SWOT Analysis
10.2 Tata Consultancy Services (TCS)
10.2.1 Company Overview
10.2.2 Financial
10.2.3 Services/ Services Offered
10.2.4 SWOT Analysis
10.3 Wipro
10.3.1 Company Overview
10.3.2 Financial
10.3.3 Services/ Services Offered
10.3.4 SWOT Analysis
10.4 Cognizant
10.4.1 Company Overview
10.4.2 Financial
10.4.3 Services/ Services Offered
10.4.4 SWOT Analysis
10.5 Qatar Petroleum
10.5.1 Company Overview
10.5.2 Financial
10.5.3 Services/ Services Offered
10.5.4 SWOT Analysis
10.6 IBM
10.6.1 Company Overview
10.6.2 Financial
10.6.3 Services/ Services Offered
10.6.4 SWOT Analysis
10.7 Microsoft
10.7.1 Company Overview
10.7.2 Financial
10.7.3 Services/ Services Offered
10.7.4 SWOT Analysis
10.8 Siemens
10.8.1 Company Overview
10.8.2 Financial
10.8.3 Services/ Services Offered
10.8.4 SWOT Analysis
10.9 Riyadh Techno Valley
10.9.1 Company Overview
10.9.2 Financial
10.9.3 Services/ Services Offered
10.9.4 SWOT Analysis
10.10 Huawei
10.9.1 Company Overview
10.9.2 Financial
10.9.3 Services/ Services Offered
10.9.4 SWOT Analysis
11. Use Cases and Best Practices
12. Conclusion
An accurate research report requires proper strategizing as well as implementation. There are multiple factors involved in the completion of good and accurate research report and selecting the best methodology to compete the research is the toughest part. Since the research reports we provide play a crucial role in any company’s decision-making process, therefore we at SNS Insider always believe that we should choose the best method which gives us results closer to reality. This allows us to reach at a stage wherein we can provide our clients best and accurate investment to output ratio.
Each report that we prepare takes a timeframe of 350-400 business hours for production. Starting from the selection of titles through a couple of in-depth brain storming session to the final QC process before uploading our titles on our website we dedicate around 350 working hours. The titles are selected based on their current market cap and the foreseen CAGR and growth.
The 5 steps process:
Step 1: Secondary Research:
Secondary Research or Desk Research is as the name suggests is a research process wherein, we collect data through the readily available information. In this process we use various paid and unpaid databases which our team has access to and gather data through the same. This includes examining of listed companies’ annual reports, Journals, SEC filling etc. Apart from this our team has access to various associations across the globe across different industries. Lastly, we have exchange relationships with various university as well as individual libraries.

Step 2: Primary Research
When we talk about primary research, it is a type of study in which the researchers collect relevant data samples directly, rather than relying on previously collected data. This type of research is focused on gaining content specific facts that can be sued to solve specific problems. Since the collected data is fresh and first hand therefore it makes the study more accurate and genuine.
We at SNS Insider have divided Primary Research into 2 parts.
Part 1 wherein we interview the KOLs of major players as well as the upcoming ones across various geographic regions. This allows us to have their view over the market scenario and acts as an important tool to come closer to the accurate market numbers. As many as 45 paid and unpaid primary interviews are taken from both the demand and supply side of the industry to make sure we land at an accurate judgement and analysis of the market.
This step involves the triangulation of data wherein our team analyses the interview transcripts, online survey responses and observation of on filed participants. The below mentioned chart should give a better understanding of the part 1 of the primary interview.

Part 2: In this part of primary research the data collected via secondary research and the part 1 of the primary research is validated with the interviews from individual consultants and subject matter experts.
Consultants are those set of people who have at least 12 years of experience and expertise within the industry whereas Subject Matter Experts are those with at least 15 years of experience behind their back within the same space. The data with the help of two main processes i.e., FGDs (Focused Group Discussions) and IDs (Individual Discussions). This gives us a 3rd party nonbiased primary view of the market scenario making it a more dependable one while collation of the data pointers.
Step 3: Data Bank Validation
Once all the information is collected via primary and secondary sources, we run that information for data validation. At our intelligence centre our research heads track a lot of information related to the market which includes the quarterly reports, the daily stock prices, and other relevant information. Our data bank server gets updated every fortnight and that is how the information which we collected using our primary and secondary information is revalidated in real time.

Step 4: QA/QC Process
After all the data collection and validation our team does a final level of quality check and quality assurance to get rid of any unwanted or undesired mistakes. This might include but not limited to getting rid of the any typos, duplication of numbers or missing of any important information. The people involved in this process include technical content writers, research heads and graphics people. Once this process is completed the title gets uploader on our platform for our clients to read it.
Step 5: Final QC/QA Process:
This is the last process and comes when the client has ordered the study. In this process a final QA/QC is done before the study is emailed to the client. Since we believe in giving our clients a good experience of our research studies, therefore, to make sure that we do not lack at our end in any way humanly possible we do a final round of quality check and then dispatch the study to the client.
By Industry
Information Technology (IT) and Software Development
Pharmaceutical and Biotechnology
Manufacturing and Engineering
Consumer Electronics
Automotive
By Technology
Artificial Intelligence and Machine Learning
Cloud Computing
Internet of Things (IoT)
Biotechnology Tools
Request for Segment Customization as per your Business Requirement: Segment Customization Request
Regional Coverage:
North America
US
Canada
Mexico
Europe
Eastern Europe
Poland
Romania
Hungary
Turkey
Rest of Eastern Europe
Western Europe
Germany
France
UK
Italy
Spain
Netherlands
Switzerland
Austria
Rest of Western Europe
Asia Pacific
China
India
Japan
South Korea
Vietnam
Singapore
Australia
Rest of Asia Pacific
Middle East & Africa
Middle East
UAE
Egypt
Saudi Arabia
Qatar
Rest of the Middle East
Africa
Nigeria
South Africa
Rest of Africa
Latin America
Brazil
Argentina
Colombia
Rest of Latin America
Request for Country Level Research Report: Country Level Customization Request
Available Customization
With the given market data, SNS Insider offers customization as per the company’s specific needs. The following customization options are available for the report:
Product Analysis
Criss-Cross segment analysis (e.g. Product X Application)
Product Matrix which gives a detailed comparison of the product portfolio of each company
Geographic Analysis
Additional countries in any of the regions
Company Information
Detailed analysis and profiling of additional market players (Up to five)
The Artificial Intelligence in Manufacturing Market was valued at USD 3.4 billion in 2023 and is expected to reach USD 103.3 billion by 2032, growing at a CAGR of 46.08% from 2024-2032.
The Logistics Automation Market Size was valued at USD 34.57 Billion in 2023, and is expected to reach USD 120.10 Billion by 2032, and grow at a CAGR of 15.62% over the forecast period 2024-2032.
The Talent Management Software Market size was recorded at USD 9.17 billion in 2023 and is expected to reach USD 25.42 billion by 2032, growing at a CAGR of 12.0 % over the forecast period of 2024-2032.
The Business Process Automation Market size was USD 13.80 billion in 2023 and is expected to Reach USD 38.48 billion by 2032 and grow at a CAGR of 12.10% over the forecast period of 2024-2032.
The Audio Communication Monitoring Market was valued at USD 2.6 Billion in 2023 and will reach USD 11.2 Billion by 2032, growing at a CAGR of 17.90% by 2032.
The Content Analytics Market was valued at USD 8.2 Billion in 2023 and will reach USD 38.0 Billion by 2032, growing at a CAGR of 18.69% by 2032.

Hi! Click one of our member below to chat on Phone
© 2025 All Rights Reserved by SNS Insider Pvt Ltd


