image

Radiology Information Systems Market Report Scope & Overview:

The Radiology Information Systems Market Size was valued at USD 1.18 billion in 2023 and is expected to reach USD 2.61 billion by 2032, and grow at a CAGR of 9.2% over the forecast period 2024-2032
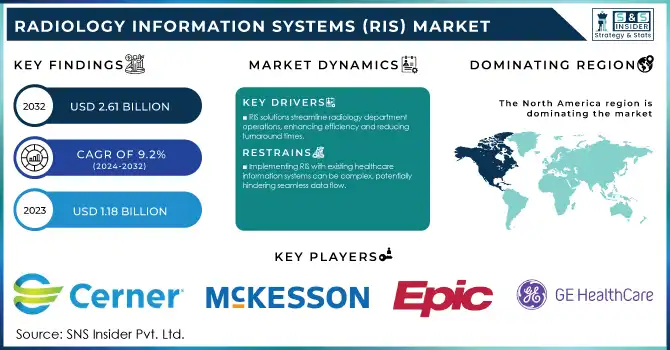
Radiology Information Systems (RIS) Market Revenue Analysis

Get more information on Radiology Information Systems Market - Request Sample Report

The Global Radiology Information Systems (RIS) market is witnessing substantial growth due to various factors. Major factors driving the growth of the market are increasing government initiatives for adopting healthcare IT solutions. For example, in the USA, the Centers for Medicare & Medicaid Services (CMS) has established the Promoting Interoperability Programs to incentivize eligible hospitals and healthcare professionals to adopt certified electronic health record (EHR) technology, including RIS, and to use it in a meaningful way. More than 95% of hospitals and 78% of office-based physicians were using certified electronic health record (EHR) technology in 2023, according to the Office of the National Coordinator for Health Information Technology (ONC), reflecting an increasing push toward digital solutions for healthcare. Furthermore, the increasing incidence of chronic diseases, which require imaging diagnostics on a frequent basis, is propelling the growth of the market. Given that 71% of all deaths worldwide are due to chronic diseases, the World Health Organization (WHO) underlines the need for efficient diagnostic tools and information systems.

In addition, the COVID-19 pandemic has also provided a needed push to digitization of healthcare services where countries around the world have embraced telemedicine and remote diagnostic solutions like never before, for instance, the United Kingdom's National Health Service (NHS) observed a 91% rise in the utilization of the digital consultation platform in February to April 2020 period. The pandemic has brought this change in direction from manual care to digital healthcare. Technological advancements also benefit the market, with RIS integrating artificial intelligence (AI) and machine learning algorithms to improve diagnostic accuracy and increase workflow efficiency. Over the last year, a handful of AI-driven radiology tools have won FDA approval as the acceptance of this clinical application of AI technology continues to marry medical image interpretation. With the effort of healthcare systems to provide better patient care, cost-effective services, and the efficiency of operations, the demand for integrated RIS solutions will continue to be on an upward trend across the globe.

Market Dynamics

Drivers

  • RIS solutions streamline radiology department operations, enhancing efficiency and reducing turnaround times.

  • Combining RIS with EHRs centralizes patient data, improving accessibility for clinicians and reducing errors.

  • The incorporation of artificial intelligence (AI) and cloud-based solutions in RIS enhances diagnostic accuracy and operational flexibility.

Workflow optimization is one of the most crucial factors for driving the demand for Radiology Information Systems (RIS), accordingly, it is acting as a fuel for the increasing efficiency and patient care in radiology departments. With automated patient scheduling, image tracking, and report generation functions, RIS reduces manual interventions, significantly decreasing errors and speeding up processes. With this in mind, automation means shorter times between imaging and results which has a direct impact on patient care. For example, digital check-in systems enable the patient to fill out required forms electronically before their appointment, accelerating the check-in process and lessening the time spent waiting earlier in the day. Finally, the integration with advanced imaging technology and PACS allows for smooth image management, making the workflow even simpler.

In addition, incorporating the AI into RIS also appears to have efficacy for optimizing workflows. In one study of smart chest X-ray worklist prioritization using AI, the authors showed that the report turnaround time for critical findings decreased significantly with AI-driven prioritization, illustrating the possible role of AI prioritization in improving radiology workflows. When radiology departments implement these workflow optimization strategies, they realize that they can turn around reports faster, their patients are happier, they get more referrals, and operational costs go down. Workflow optimization using RIS and related products is central to improving radiology efficiency, improving productivity, and therefore, the practice of radiology resulting in more patient care, batch work, and an overall smooth flow of operations in our departments.

Restraints:

  • Implementing RIS with existing healthcare information systems can be complex, potentially hindering seamless data flow.

  • Ensuring that RIS adheres to healthcare regulations, such as data security and patient privacy laws, can be demanding for healthcare providers.

  • The initial investment required for RIS, including software, hardware, and training, may be a barrier for some healthcare facilities.

The adoption of Radiology Information Systems (RIS) often entails significant initial costs, posing a barrier for healthcare facilities, especially smaller ones with limited budgets. These costs include purchasing or upgrading software, acquiring compatible hardware, and investing in infrastructure to support the system. Additionally, healthcare providers must allocate resources for staff training to ensure effective use of the RIS, which can add to the overall expense.

Beyond financial outlay, the implementation process may disrupt routine operations temporarily, leading to productivity losses and increased administrative burden during the transition phase. For many institutions, the long-term benefits of streamlined workflows and enhanced patient care may not immediately offset the upfront costs, creating hesitation in adoption. This challenge is particularly pronounced in emerging markets, where budget constraints and resource limitations often slow down the integration of advanced healthcare technologies like RIS.

Radiology Information Systems Market Segmentation Analysis

By deployment mode

In 2023, the web-based segment held the largest revenue share of over 76%. The reasons behind this supremacy are myriad but their heightened affordability, accessibility, and scalability through web-based solutions are some major contributors. Web-based healthcare IT systems have been promoted by government initiatives. As an example, the U.S. Department of Health and Human Services (HHS) has been promoting the adoption of cloud-based and web-accessible health information systems via its Federal Health IT Strategic Plan. The ONC reported that as of 2023, almost 84% of the hospitals were using one of the cloud-based or web-based EHR systems which denotes a high preference for these deployment modes. Web-based RIS solutions enable healthcare providers to access patient and imaging data from throughout the world to support remote consultations and enhance care coordination. Such a feature, in light of the global move to telemedicine and other remote healthcare services, has become necessary and invaluable. For one, web-based systems often involve a lower cost of entry and less IT infrastructure, which can also be attractive to smaller healthcare facilities and practices. According to the U.S. Small Business Administration, many small healthcare practices, which play a large role in the health landscape, are adopting web-based health IT solutions at a mark as they are more cost-effective and easier to implement. Moreover, the web-based RIS solutions also provide regular updates and maintenance eliminating the need to remain compliant with changing healthcare regulations and security standards readily as they do not require much effort from the part of the healthcare providers.

By Product

The integrated RIS segment accounted for the highest revenue share of above 66% in 2023, which can be attributed to the functionality of these solutions to completely integrate with other healthcare information systems. The adoption of integrated healthcare IT solutions across the country is majorly aided by government initiatives. Within Europe, the action plan 2012–2020 for European eHealth underscores the significance of interoperable health information systems and advocates integrated systems implementation by member states. The European Commission showed that more than 70% of EU hospitals have some type of integrated electronic health record system (including RIS) by 2023. The integrated RIS solutions provide several benefits including improved workflow efficiency, reduced risk of data entry errors, and improved interaction between different departments under one roof in a healthcare facility. According to the U.S. Office of the National Coordinator for Health Information Technology (ONC), integrated EHR systems capable of being integrated into RIS are associated with a 30% reduction in medication errors and a 25% increase in operational efficiency for hospitals. Integrated RIS solutions also offer improved reassurance of compliance with regulatory standards, like the United States Health Insurance Portability and Accountability Act (HIPAA). The U.S. Department of Health and Human Services reported a 15% decrease in HIPAA violations among healthcare providers using integrated health information systems between 2020 and 2023. The amalgamation of RIS with other systems powerful Picture Archiving and Communication Systems (PACS) and Electronic Health Records (EHR) forms a more holistic platform for patient care, which allows the user to make better-informed decisions based on all things considered patient data.
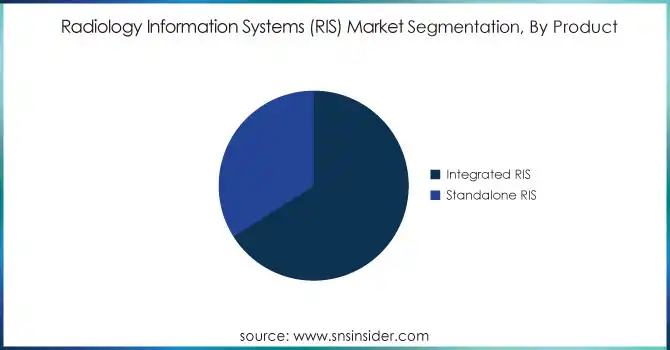
Radiology-Information-Systems-RIS-Market-Segmentation-By-Product

By End use

The hospitals & clinics segment accounted for the largest revenue share of over 79% in 2023, as hospitals and clinics play crucial roles in providing these services, and they make substantial investments in healthcare infrastructure. According to the U.S. Centers for Disease Control and Prevention (CDC), there were around 883.7 million physician office visits in 2019, a substantial number of which included one or more types of radiological procedures. The high volume of patients they handle necessitates effective information management systems including RIS. In addition, government programs have pushed hospitals and clinics to start using health information technology. As an example, in the United States, the HITECH Act of 2009 incentivizes the meaningful use of EHR, which will include RIS. According to the Office of the National Coordinator for Health Information Technology (ONC), 94% of non-federal acute care hospitals had adopted certified EHR technology by 2017, up from 71.9% in 2011. At the same time, the mainstream acceptance of health IT in hospitals and clinics provides a conducive and stimulating environment for RIS implementations. Again, positively impacting the adoption of RIS in hospital applications, the hospital operates multiple departments and specialties that may benefit from the comprehensive and controlled data that the RIS collects and supplies to the various departments via an integrated system.

Regional Analysis

North America held the largest revenue share of the Radiology Information Systems market, which accounted for over 48% in 2023, North America's dominance can be attributed to its mature healthcare infrastructure, high penetration of healthcare IT solutions, and supportive government initiatives. National health expenditure, as reported by the U.S. Centers for Medicare & Medicaid Services (CMS), increased by 9.7%, a sign that money is still pouring into the healthcare services sector and supporting expensive new technology. The region's leadership in RIS adoption is further supported by the Office of the National Coordinator for Health Information Technology (ONC), which reported that as of 2021, 96% of non-federal acute care hospitals had adopted certified EHR technology, including RIS components.

During the forecast period, the Asia Pacific region is expected to achieve the highest CAGR. The rapid development of this region is being propelled by the rising consumer spending on healthcare, the rising acceptance of digital health solutions, and the government campaigns to transition healthcare systems into digitized platforms. China is using national health plans such as the "Healthy China 2030" initiative to rapidly advance the quality of health care, in particular by expanding access to high-tech medical technologies. The National Digital Health Mission, announced by the Indian Government in 2020, aims to establish a digital infrastructure for the healthcare system, which is expected to facilitate the widespread adoption of healthcare IT solutions, thereby, driving the market for RIS in India. As Japan is one of the leaders in healthcare technology in the region, the country has promoted AI and big data in healthcare, with healthcare on the list of priority areas in the government's "AI Strategy 2019." The large and fast-aging population of the region, along with these initiatives will boost the growth of the regional Market of RIS during the forecast period.
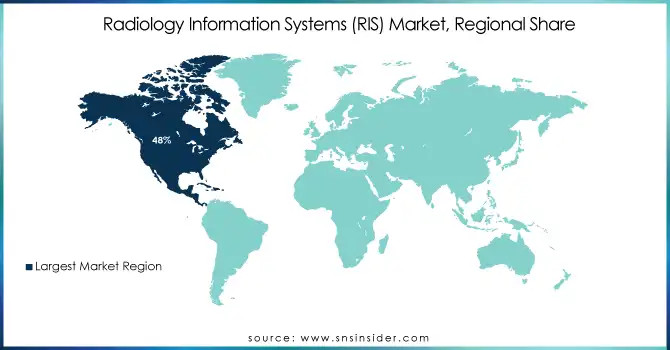
Radiology-Information-Systems-RIS-Market-Regional-Share

Need any customization research on Radiology Information Systems Market - Enquiry Now

Recent developments

  • In June 2024, DeepHealth, Inc. a RadNet, Inc. subsidiary, announced the launch of its cloud-based DeepHealth OS in Italy. Lung, breast, prostate, and brain diseases are the target of high-throughput clinical programs across the United States and Europe that combine clinical data integration with individualized workspaces to optimize detection and treatment.

  • In February 2024, Pro Medicus Ltd released Visage Ease VP for Apple Vision Pro, providing a true to life high-end imaging experience for diagnostic and non-diagnostic imaging and multimedia functions.

Key Players

Key Service Providers/Manufacturers

  • Cerner Corporation (PowerChart Radiology, RadNet Radiology Information System)

  • McKesson Corporation (McKesson Radiology, Horizon Medical Imaging)

  • Epic Systems Corporation (Radiant RIS, EpicCare Radiology)

  • GE Healthcare (Centricity RIS, Centricity PACS)

  • Siemens Healthineers (syngo Workflow, syngo.plaza)

  • Philips Healthcare (IntelliSpace RIS, Xcelera)

  • IBM (Merge Healthcare) (Merge RIS, Merge PACS)

  • Allscripts Healthcare Solutions (Allscripts Sunrise Radiology, Allscripts TouchWorks EHR)

  • MedInformatix, Inc. (MedInformatix RIS, MedInformatix EHR)

  • eRAD (eRAD RIS, eRAD PACS)

  • Pro Medicus Ltd. (Visage RIS, Visage 7)

  • Carestream Health (Carestream RIS, Carestream PACS)

  • Agfa HealthCare (IMPAX RIS, Enterprise Imaging)

  • Sectra AB (Sectra RIS, Sectra PACS)

  • Intelerad Medical Systems (InteleRIS, IntelePACS)

  • RamSoft Inc. (PowerServer RIS, PowerServer PACS)

  • Novarad Corporation (NovaRIS, NovaPACS)

  • Merge Healthcare (Merge RIS, Merge PACS)

  • Koninklijke Philips N.V. (IntelliSpace RIS, IntelliSpace PACS)

  • Siemens Healthineers AG (syngo Workflow, syngo.plaza)

Radiology Information Systems Market Report Scope:

Report Attributes Details
Market Size in 2023 USD 1.18 Billion 
Market Size by 2032 USD 2.61 Billion 
CAGR CAGR of 9.2% From 2024 to 2032
Base Year 2023
Forecast Period 2024-2032
Historical Data 2020-2022
Report Scope & Coverage Market Size, Segments Analysis, Competitive  Landscape, Regional Analysis, DROC & SWOT Analysis, Forecast Outlook
Key Segments • By Product (Integrated RIS, Standalone RIS)
• By Deployment Mode (Web-based, Cloud-based, On-premise)
• By End Use (Hospitals & Clinics, Outpatient Department (OPD) Clinics, Others)
Regional Analysis/Coverage North America (US, Canada, Mexico), Europe (Eastern Europe [Poland, Romania, Hungary, Turkey, Rest of Eastern Europe] Western Europe] Germany, France, UK, Italy, Spain, Netherlands, Switzerland, Austria, Rest of Western Europe]), Asia Pacific (China, India, Japan, South Korea, Vietnam, Singapore, Australia, Rest of Asia Pacific), Middle East & Africa (Middle East [UAE, Egypt, Saudi Arabia, Qatar, Rest of Middle East], Africa [Nigeria, South Africa, Rest of Africa], Latin America (Brazil, Argentina, Colombia, Rest of Latin America)
Company Profiles Cerner Corporation, McKesson Corporation, Epic Systems Corporation, GE Healthcare, Siemens Healthineers, Philips Healthcare, IBM (Merge Healthcare), Allscripts Healthcare Solutions, MedInformatix, eRAD, Pro Medicus Ltd., Carestream Health, Agfa HealthCare, Sectra AB, Intelerad Medical Systems, RamSoft Inc., Novarad Corporation, Merge Healthcare, Koninklijke Philips N.V., Siemens Healthineers AG.
Key Drivers • RIS solutions streamline radiology department operations, enhancing efficiency and reducing turnaround times.
• Combining RIS with EHRs centralizes patient data, improving accessibility for clinicians and reducing errors. 
Restraints • Implementing RIS with existing healthcare information systems can be complex, potentially hindering seamless data flow.
• Ensuring that RIS adheres to healthcare regulations, such as data security and patient privacy laws, can be demanding for healthcare providers. 

Frequently Asked Questions

Ans. The projected market size for the Radiology Information Systems (RIS) Market is USD 26.1 Billion by 2032.

Ans. The CAGR of the Radiology Information Systems (RIS) Market is 9.2% During the forecast period of 2024-2032.

Ans: The North American region dominated the Radiology Information Systems (RIS) Market in 2023.

Ans:  The major key players in the market are Cerner Corporation, McKesson Corporation, Epic Systems Corporation, GE Healthcare, Siemens Healthineers, Philips Healthcare, IBM (Merge Healthcare), Allscripts Healthcare Solutions, MedInformatix, eRAD, Pro Medicus Ltd., Carestream Health, Agfa HealthCare, Sectra AB, Intelerad Medical Systems, RamSoft Inc., Novarad Corporation, Merge Healthcare, Koninklijke Philips N.V., Siemens Healthineers AG., and others in final report.

Ans:  

  • RIS solutions streamline radiology department operations, enhancing efficiency and reducing turnaround times.
  • The incorporation of artificial intelligence (AI) and cloud-based solutions in RIS enhances diagnostic accuracy and operational flexibility.

Table of Contents

1. Introduction

1.1 Market Definition

1.2 Scope (Inclusion and Exclusions)

1.3 Research Assumptions

2. Executive Summary

2.1 Market Overview

2.2 Regional Synopsis

2.3 Competitive Summary

3. Research Methodology

3.1 Top-Down Approach

3.2 Bottom-up Approach

3.3. Data Validation

3.4 Primary Interviews

4. Market Dynamics Impact Analysis

4.1 Market Driving Factors Analysis

4.1.1 Drivers

4.1.2 Restraints

4.1.3 Opportunities

4.1.4 Challenges

4.2 PESTLE Analysis

4.3 Porter’s Five Forces Model

5. Statistical Insights and Trends Reporting

5.1 Adoption Rates, 2023

5.2 User Demographics, By User Type and Roles, 2023

5.3 Feature Analysis, by Feature Type

5.4 Cost Analysis, by Software

5.5 Integration Capabilities

5.6 Regulatory Compliance, by Region

6. Competitive Landscape

6.1 List of Major Companies, By Region

6.2 Market Share Analysis, By Region

6.3 Product Benchmarking

6.3.1 Product specifications and features

6.3.2 Pricing

6.4 Strategic Initiatives

6.4.1 Marketing and promotional activities

6.4.2 Distribution and Supply Chain Strategies

6.4.3 Expansion plans and new product launches

6.4.4 Strategic partnerships and collaborations

6.5 Technological Advancements

6.6 Market Positioning and Branding

7. Radiology Information Systems (RIS) Market Segmentation, By Product

7.1 Chapter Overview

7.2 Integrated RIS

7.2.1 Integrated RIS Market Trends Analysis (2020-2032)

7.2.2 Integrated RIS Market Size Estimates and Forecasts to 2032 (USD Billion)

7.3 Standalone RIS

7.3.1 Standalone RIS Market Trends Analysis (2020-2032)

7.3.2 Standalone RIS Market Size Estimates and Forecasts to 2032 (USD Billion)

8. Radiology Information Systems (RIS) Market Segmentation, By Deployment Mode

8.1 Chapter Overview

8.2 Web-based

8.2.1 Web-based Market Trends Analysis (2020-2032)

8.2.2 Web-based Market Size Estimates and Forecasts to 2032 (USD Billion)

8.3 Cloud-based

8.3.1 Cloud-based Market Trends Analysis (2020-2032)

8.3.2 Cloud-based Market Size Estimates and Forecasts to 2032 (USD Billion)

8.4 On-premise

8.4.1 On-premise Market Trends Analysis (2020-2032)

8.4.2 On-premise Market Size Estimates and Forecasts to 2032 (USD Billion)

9. Radiology Information Systems (RIS) Market Segmentation, By End-use

9.1 Chapter Overview

9.2 Hospitals & Clinics

9.2.1 Hospitals & Clinics Market Trends Analysis (2020-2032)

9.2.2 Hospitals & Clinics Market Size Estimates and Forecasts to 2032 (USD Billion)

9.3 Outpatient Department (OPD) Clinics

9.3.1 Outpatient Department (OPD) Clinics Market Trends Analysis (2020-2032)

9.3.2 Outpatient Department (OPD) Clinics Market Size Estimates and Forecasts to 2032 (USD Billion)

9.4 Others

9.4.1 Others Market Trends Analysis (2020-2032)

9.4.2 Others Market Size Estimates and Forecasts to 2032 (USD Billion)

10. Regional Analysis

10.1 Chapter Overview

10.2 North America

10.2.1 Trends Analysis

10.2.2 North America Radiology Information Systems (RIS) Market Estimates and Forecasts, by Country (2020-2032) (USD Billion)

10.2.3 North America Radiology Information Systems (RIS) Market Estimates and Forecasts, By Product (2020-2032) (USD Billion) 

10.2.4 North America Radiology Information Systems (RIS) Market Estimates and Forecasts, By Deployment Mode (2020-2032) (USD Billion)

10.2.5 North America Radiology Information Systems (RIS) Market Estimates and Forecasts, By End-use (2020-2032) (USD Billion)

10.2.6 USA

10.2.6.1 USA Radiology Information Systems (RIS) Market Estimates and Forecasts, By Product (2020-2032) (USD Billion)

10.2.6.2 USA Radiology Information Systems (RIS) Market Estimates and Forecasts, By Deployment Mode (2020-2032) (USD Billion)

10.2.6.3 USA Radiology Information Systems (RIS) Market Estimates and Forecasts, By End-use (2020-2032) (USD Billion)

10.2.7 Canada

10.2.7.1 Canada Radiology Information Systems (RIS) Market Estimates and Forecasts, By Product (2020-2032) (USD Billion)

10.2.7.2 Canada Radiology Information Systems (RIS) Market Estimates and Forecasts, By Deployment Mode (2020-2032) (USD Billion)

10.2.7.3 Canada Radiology Information Systems (RIS) Market Estimates and Forecasts, By End-use (2020-2032) (USD Billion)

10.2.8 Mexico

10.2.8.1 Mexico Radiology Information Systems (RIS) Market Estimates and Forecasts, By Product (2020-2032) (USD Billion)

10.2.8.2 Mexico Radiology Information Systems (RIS) Market Estimates and Forecasts, By Deployment Mode (2020-2032) (USD Billion)

10.2.8.3 Mexico Radiology Information Systems (RIS) Market Estimates and Forecasts, By End-use (2020-2032) (USD Billion)

10.3 Europe

10.3.1 Eastern Europe

10.3.1.1 Trends Analysis

10.3.1.2 Eastern Europe Radiology Information Systems (RIS) Market Estimates and Forecasts, by Country (2020-2032) (USD Billion)

10.3.1.3 Eastern Europe Radiology Information Systems (RIS) Market Estimates and Forecasts, By Product (2020-2032) (USD Billion) 

10.3.1.4 Eastern Europe Radiology Information Systems (RIS) Market Estimates and Forecasts, By Deployment Mode (2020-2032) (USD Billion)

10.3.1.5 Eastern Europe Radiology Information Systems (RIS) Market Estimates and Forecasts, By End-use (2020-2032) (USD Billion)

10.3.1.6 Poland

10.3.1.6.1 Poland Radiology Information Systems (RIS) Market Estimates and Forecasts, By Product (2020-2032) (USD Billion)

10.3.1.6.2 Poland Radiology Information Systems (RIS) Market Estimates and Forecasts, By Deployment Mode (2020-2032) (USD Billion)

10.3.1.6.3 Poland Radiology Information Systems (RIS) Market Estimates and Forecasts, By End-use (2020-2032) (USD Billion)

10.3.1.7 Romania

10.3.1.7.1 Romania Radiology Information Systems (RIS) Market Estimates and Forecasts, By Product (2020-2032) (USD Billion)

10.3.1.7.2 Romania Radiology Information Systems (RIS) Market Estimates and Forecasts, By Deployment Mode (2020-2032) (USD Billion)

10.3.1.7.3 Romania Radiology Information Systems (RIS) Market Estimates and Forecasts, By End-use (2020-2032) (USD Billion)

10.3.1.8 Hungary

10.3.1.8.1 Hungary Radiology Information Systems (RIS) Market Estimates and Forecasts, By Product (2020-2032) (USD Billion)

10.3.1.8.2 Hungary Radiology Information Systems (RIS) Market Estimates and Forecasts, By Deployment Mode (2020-2032) (USD Billion)

10.3.1.8.3 Hungary Radiology Information Systems (RIS) Market Estimates and Forecasts, By End-use (2020-2032) (USD Billion)

10.3.1.9 Turkey

10.3.1.9.1 Turkey Radiology Information Systems (RIS) Market Estimates and Forecasts, By Product (2020-2032) (USD Billion)

10.3.1.9.2 Turkey Radiology Information Systems (RIS) Market Estimates and Forecasts, By Deployment Mode (2020-2032) (USD Billion)

10.3.1.9.3 Turkey Radiology Information Systems (RIS) Market Estimates and Forecasts, By End-use (2020-2032) (USD Billion)

10.3.1.10 Rest of Eastern Europe

10.3.1.10.1 Rest of Eastern Europe Radiology Information Systems (RIS) Market Estimates and Forecasts, By Product (2020-2032) (USD Billion)

10.3.1.10.2 Rest of Eastern Europe Radiology Information Systems (RIS) Market Estimates and Forecasts, By Deployment Mode (2020-2032) (USD Billion)

10.3.1.10.3 Rest of Eastern Europe Radiology Information Systems (RIS) Market Estimates and Forecasts, By End-use (2020-2032) (USD Billion)

10.3.2 Western Europe

10.3.2.1 Trends Analysis

10.3.2.2 Western Europe Radiology Information Systems (RIS) Market Estimates and Forecasts, by Country (2020-2032) (USD Billion)

10.3.2.3 Western Europe Radiology Information Systems (RIS) Market Estimates and Forecasts, By Product (2020-2032) (USD Billion) 

10.3.2.4 Western Europe Radiology Information Systems (RIS) Market Estimates and Forecasts, By Deployment Mode (2020-2032) (USD Billion)

10.3.2.5 Western Europe Radiology Information Systems (RIS) Market Estimates and Forecasts, By End-use (2020-2032) (USD Billion)

10.3.2.6 Germany

10.3.2.6.1 Germany Radiology Information Systems (RIS) Market Estimates and Forecasts, By Product (2020-2032) (USD Billion)

10.3.2.6.2 Germany Radiology Information Systems (RIS) Market Estimates and Forecasts, By Deployment Mode (2020-2032) (USD Billion)

10.3.2.6.3 Germany Radiology Information Systems (RIS) Market Estimates and Forecasts, By End-use (2020-2032) (USD Billion)

10.3.2.7 France

10.3.2.7.1 France Radiology Information Systems (RIS) Market Estimates and Forecasts, By Product (2020-2032) (USD Billion)

10.3.2.7.2 France Radiology Information Systems (RIS) Market Estimates and Forecasts, By Deployment Mode (2020-2032) (USD Billion)

10.3.2.7.3 France Radiology Information Systems (RIS) Market Estimates and Forecasts, By End-use (2020-2032) (USD Billion)

10.3.2.8 UK

10.3.2.8.1 UK Radiology Information Systems (RIS) Market Estimates and Forecasts, By Product (2020-2032) (USD Billion)

10.3.2.8.2 UK Radiology Information Systems (RIS) Market Estimates and Forecasts, By Deployment Mode (2020-2032) (USD Billion)

10.3.2.8.3 UK Radiology Information Systems (RIS) Market Estimates and Forecasts, By End-use (2020-2032) (USD Billion)

10.3.2.9 Italy

10.3.2.9.1 Italy Radiology Information Systems (RIS) Market Estimates and Forecasts, By Product (2020-2032) (USD Billion)

10.3.2.9.2 Italy Radiology Information Systems (RIS) Market Estimates and Forecasts, By Deployment Mode (2020-2032) (USD Billion)

10.3.2.9.3 Italy Radiology Information Systems (RIS) Market Estimates and Forecasts, By End-use (2020-2032) (USD Billion)

10.3.2.10 Spain

10.3.2.10.1 Spain Radiology Information Systems (RIS) Market Estimates and Forecasts, By Product (2020-2032) (USD Billion)

10.3.2.10.2 Spain Radiology Information Systems (RIS) Market Estimates and Forecasts, By Deployment Mode (2020-2032) (USD Billion)

10.3.2.10.3 Spain Radiology Information Systems (RIS) Market Estimates and Forecasts, By End-use (2020-2032) (USD Billion)

10.3.2.11 Netherlands

10.3.2.11.1 Netherlands Radiology Information Systems (RIS) Market Estimates and Forecasts, By Product (2020-2032) (USD Billion)

10.3.2.11.2 Netherlands Radiology Information Systems (RIS) Market Estimates and Forecasts, By Deployment Mode (2020-2032) (USD Billion)

10.3.2.11.3 Netherlands Radiology Information Systems (RIS) Market Estimates and Forecasts, By End-use (2020-2032) (USD Billion)

10.3.2.12 Switzerland

10.3.2.12.1 Switzerland Radiology Information Systems (RIS) Market Estimates and Forecasts, By Product (2020-2032) (USD Billion)

10.3.2.12.2 Switzerland Radiology Information Systems (RIS) Market Estimates and Forecasts, By Deployment Mode (2020-2032) (USD Billion)

10.3.2.12.3 Switzerland Radiology Information Systems (RIS) Market Estimates and Forecasts, By End-use (2020-2032) (USD Billion)

10.3.2.13 Austria

10.3.2.13.1 Austria Radiology Information Systems (RIS) Market Estimates and Forecasts, By Product (2020-2032) (USD Billion)

10.3.2.13.2 Austria Radiology Information Systems (RIS) Market Estimates and Forecasts, By Deployment Mode (2020-2032) (USD Billion)

10.3.2.13.3 Austria Radiology Information Systems (RIS) Market Estimates and Forecasts, By End-use (2020-2032) (USD Billion)

10.3.2.14 Rest of Western Europe

10.3.2.14.1 Rest of Western Europe Radiology Information Systems (RIS) Market Estimates and Forecasts, By Product (2020-2032) (USD Billion)

10.3.2.14.2 Rest of Western Europe Radiology Information Systems (RIS) Market Estimates and Forecasts, By Deployment Mode (2020-2032) (USD Billion)

10.3.2.14.3 Rest of Western Europe Radiology Information Systems (RIS) Market Estimates and Forecasts, By End-use (2020-2032) (USD Billion)

10.4 Asia Pacific

10.4.1 Trends Analysis

10.4.2 Asia Pacific Radiology Information Systems (RIS) Market Estimates and Forecasts, by Country (2020-2032) (USD Billion)

10.4.3 Asia Pacific Radiology Information Systems (RIS) Market Estimates and Forecasts, By Product (2020-2032) (USD Billion) 

10.4.4 Asia Pacific Radiology Information Systems (RIS) Market Estimates and Forecasts, By Deployment Mode (2020-2032) (USD Billion)

10.4.5 Asia Pacific Radiology Information Systems (RIS) Market Estimates and Forecasts, By End-use (2020-2032) (USD Billion)

10.4.6 China

10.4.6.1 China Radiology Information Systems (RIS) Market Estimates and Forecasts, By Product (2020-2032) (USD Billion)

10.4.6.2 China Radiology Information Systems (RIS) Market Estimates and Forecasts, By Deployment Mode (2020-2032) (USD Billion)

10.4.6.3 China Radiology Information Systems (RIS) Market Estimates and Forecasts, By End-use (2020-2032) (USD Billion)

10.4.7 India

10.4.7.1 India Radiology Information Systems (RIS) Market Estimates and Forecasts, By Product (2020-2032) (USD Billion)

10.4.7.2 India Radiology Information Systems (RIS) Market Estimates and Forecasts, By Deployment Mode (2020-2032) (USD Billion)

10.4.7.3 India Radiology Information Systems (RIS) Market Estimates and Forecasts, By End-use (2020-2032) (USD Billion)

10.4.8 Japan

10.4.8.1 Japan Radiology Information Systems (RIS) Market Estimates and Forecasts, By Product (2020-2032) (USD Billion)

10.4.8.2 Japan Radiology Information Systems (RIS) Market Estimates and Forecasts, By Deployment Mode (2020-2032) (USD Billion)

10.4.8.3 Japan Radiology Information Systems (RIS) Market Estimates and Forecasts, By End-use (2020-2032) (USD Billion)

10.4.9 South Korea

10.4.9.1 South Korea Radiology Information Systems (RIS) Market Estimates and Forecasts, By Product (2020-2032) (USD Billion)

10.4.9.2 South Korea Radiology Information Systems (RIS) Market Estimates and Forecasts, By Deployment Mode (2020-2032) (USD Billion)

10.4.9.3 South Korea Radiology Information Systems (RIS) Market Estimates and Forecasts, By End-use (2020-2032) (USD Billion)

10.4.10 Vietnam

10.4.10.1 Vietnam Radiology Information Systems (RIS) Market Estimates and Forecasts, By Product (2020-2032) (USD Billion)

10.4.10.2 Vietnam Radiology Information Systems (RIS) Market Estimates and Forecasts, By Deployment Mode (2020-2032) (USD Billion)

10.4.10.3 Vietnam Radiology Information Systems (RIS) Market Estimates and Forecasts, By End-use (2020-2032) (USD Billion)

10.4.11 Singapore

10.4.11.1 Singapore Radiology Information Systems (RIS) Market Estimates and Forecasts, By Product (2020-2032) (USD Billion)

10.4.11.2 Singapore Radiology Information Systems (RIS) Market Estimates and Forecasts, By Deployment Mode (2020-2032) (USD Billion)

10.4.11.3 Singapore Radiology Information Systems (RIS) Market Estimates and Forecasts, By End-use (2020-2032) (USD Billion)

10.4.12 Australia

10.4.12.1 Australia Radiology Information Systems (RIS) Market Estimates and Forecasts, By Product (2020-2032) (USD Billion)

10.4.12.2 Australia Radiology Information Systems (RIS) Market Estimates and Forecasts, By Deployment Mode (2020-2032) (USD Billion)

10.4.12.3 Australia Radiology Information Systems (RIS) Market Estimates and Forecasts, By End-use (2020-2032) (USD Billion)

10.4.13 Rest of Asia Pacific

10.4.13.1 Rest of Asia Pacific Radiology Information Systems (RIS) Market Estimates and Forecasts, By Product (2020-2032) (USD Billion)

10.4.13.2 Rest of Asia Pacific Radiology Information Systems (RIS) Market Estimates and Forecasts, By Deployment Mode (2020-2032) (USD Billion)

10.4.13.3 Rest of Asia Pacific Radiology Information Systems (RIS) Market Estimates and Forecasts, By End-use (2020-2032) (USD Billion)

10.5 Middle East and Africa

10.5.1 Middle East

10.5.1.1 Trends Analysis

10.5.1.2 Middle East Radiology Information Systems (RIS) Market Estimates and Forecasts, by Country (2020-2032) (USD Billion)

10.5.1.3 Middle East Radiology Information Systems (RIS) Market Estimates and Forecasts, By Product (2020-2032) (USD Billion) 

10.5.1.4 Middle East Radiology Information Systems (RIS) Market Estimates and Forecasts, By Deployment Mode (2020-2032) (USD Billion)

10.5.1.5 Middle East Radiology Information Systems (RIS) Market Estimates and Forecasts, By End-use (2020-2032) (USD Billion)

10.5.1.6 UAE

10.5.1.6.1 UAE Radiology Information Systems (RIS) Market Estimates and Forecasts, By Product (2020-2032) (USD Billion)

10.5.1.6.2 UAE Radiology Information Systems (RIS) Market Estimates and Forecasts, By Deployment Mode (2020-2032) (USD Billion)

10.5.1.6.3 UAE Radiology Information Systems (RIS) Market Estimates and Forecasts, By End-use (2020-2032) (USD Billion)

10.5.1.7 Egypt

10.5.1.7.1 Egypt Radiology Information Systems (RIS) Market Estimates and Forecasts, By Product (2020-2032) (USD Billion)

10.5.1.7.2 Egypt Radiology Information Systems (RIS) Market Estimates and Forecasts, By Deployment Mode (2020-2032) (USD Billion)

10.5.1.7.3 Egypt Radiology Information Systems (RIS) Market Estimates and Forecasts, By End-use (2020-2032) (USD Billion)

10.5.1.8 Saudi Arabia

10.5.1.8.1 Saudi Arabia Radiology Information Systems (RIS) Market Estimates and Forecasts, By Product (2020-2032) (USD Billion)

10.5.1.8.2 Saudi Arabia Radiology Information Systems (RIS) Market Estimates and Forecasts, By Deployment Mode (2020-2032) (USD Billion)

10.5.1.8.3 Saudi Arabia Radiology Information Systems (RIS) Market Estimates and Forecasts, By End-use (2020-2032) (USD Billion)

10.5.1.9 Qatar

10.5.1.9.1 Qatar Radiology Information Systems (RIS) Market Estimates and Forecasts, By Product (2020-2032) (USD Billion)

10.5.1.9.2 Qatar Radiology Information Systems (RIS) Market Estimates and Forecasts, By Deployment Mode (2020-2032) (USD Billion)

10.5.1.9.3 Qatar Radiology Information Systems (RIS) Market Estimates and Forecasts, By End-use (2020-2032) (USD Billion)

10.5.1.10 Rest of Middle East

10.5.1.10.1 Rest of Middle East Radiology Information Systems (RIS) Market Estimates and Forecasts, By Product (2020-2032) (USD Billion)

10.5.1.10.2 Rest of Middle East Radiology Information Systems (RIS) Market Estimates and Forecasts, By Deployment Mode (2020-2032) (USD Billion)

10.5.1.10.3 Rest of Middle East Radiology Information Systems (RIS) Market Estimates and Forecasts, By End-use (2020-2032) (USD Billion)

10.5.2 Africa

10.5.2.1 Trends Analysis

10.5.2.2 Africa Radiology Information Systems (RIS) Market Estimates and Forecasts, by Country (2020-2032) (USD Billion)

10.5.2.3 Africa Radiology Information Systems (RIS) Market Estimates and Forecasts, By Product (2020-2032) (USD Billion) 

10.5.2.4 Africa Radiology Information Systems (RIS) Market Estimates and Forecasts, By Deployment Mode (2020-2032) (USD Billion)

10.5.2.5 Africa Radiology Information Systems (RIS) Market Estimates and Forecasts, By End-use (2020-2032) (USD Billion)

10.5.2.6 South Africa

10.5.2.6.1 South Africa Radiology Information Systems (RIS) Market Estimates and Forecasts, By Product (2020-2032) (USD Billion)

10.5.2.6.2 South Africa Radiology Information Systems (RIS) Market Estimates and Forecasts, By Deployment Mode (2020-2032) (USD Billion)

10.5.2.6.3 South Africa Radiology Information Systems (RIS) Market Estimates and Forecasts, By End-use (2020-2032) (USD Billion)

10.5.2.7 Nigeria

10.5.2.7.1 Nigeria Radiology Information Systems (RIS) Market Estimates and Forecasts, By Product (2020-2032) (USD Billion)

10.5.2.7.2 Nigeria Radiology Information Systems (RIS) Market Estimates and Forecasts, By Deployment Mode (2020-2032) (USD Billion)

10.5.2.7.3 Nigeria Radiology Information Systems (RIS) Market Estimates and Forecasts, By End-use (2020-2032) (USD Billion)

10.5.2.8 Rest of Africa

10.5.2.8.1 Rest of Africa Radiology Information Systems (RIS) Market Estimates and Forecasts, By Product (2020-2032) (USD Billion)

10.5.2.8.2 Rest of Africa Radiology Information Systems (RIS) Market Estimates and Forecasts, By Deployment Mode (2020-2032) (USD Billion)

10.5.2.8.3 Rest of Africa Radiology Information Systems (RIS) Market Estimates and Forecasts, By End-use (2020-2032) (USD Billion)

10.6 Latin America

10.6.1 Trends Analysis

10.6.2 Latin America Radiology Information Systems (RIS) Market Estimates and Forecasts, by Country (2020-2032) (USD Billion)

10.6.3 Latin America Radiology Information Systems (RIS) Market Estimates and Forecasts, By Product (2020-2032) (USD Billion) 

10.6.4 Latin America Radiology Information Systems (RIS) Market Estimates and Forecasts, By Deployment Mode (2020-2032) (USD Billion)

10.6.5 Latin America Radiology Information Systems (RIS) Market Estimates and Forecasts, By End-use (2020-2032) (USD Billion)

10.6.6 Brazil

10.6.6.1 Brazil Radiology Information Systems (RIS) Market Estimates and Forecasts, By Product (2020-2032) (USD Billion)

10.6.6.2 Brazil Radiology Information Systems (RIS) Market Estimates and Forecasts, By Deployment Mode (2020-2032) (USD Billion)

10.6.6.3 Brazil Radiology Information Systems (RIS) Market Estimates and Forecasts, By End-use (2020-2032) (USD Billion)

10.6.7 Argentina

10.6.7.1 Argentina Radiology Information Systems (RIS) Market Estimates and Forecasts, By Product (2020-2032) (USD Billion)

10.6.7.2 Argentina Radiology Information Systems (RIS) Market Estimates and Forecasts, By Deployment Mode (2020-2032) (USD Billion)

10.6.7.3 Argentina Radiology Information Systems (RIS) Market Estimates and Forecasts, By End-use (2020-2032) (USD Billion)

10.6.8 Colombia

10.6.8.1 Colombia Radiology Information Systems (RIS) Market Estimates and Forecasts, By Product (2020-2032) (USD Billion)

10.6.8.2 Colombia Radiology Information Systems (RIS) Market Estimates and Forecasts, By Deployment Mode (2020-2032) (USD Billion)

10.6.8.3 Colombia Radiology Information Systems (RIS) Market Estimates and Forecasts, By End-use (2020-2032) (USD Billion)

10.6.9 Rest of Latin America

10.6.9.1 Rest of Latin America Radiology Information Systems (RIS) Market Estimates and Forecasts, By Product (2020-2032) (USD Billion)

10.6.9.2 Rest of Latin America Radiology Information Systems (RIS) Market Estimates and Forecasts, By Deployment Mode (2020-2032) (USD Billion)

10.6.9.3 Rest of Latin America Radiology Information Systems (RIS) Market Estimates and Forecasts, By End-use (2020-2032) (USD Billion)

11. Company Profiles

11.1 Cerner Corporation

11.1.1 Company Overview

11.1.2 Financial

11.1.3 Products/ Services Offered

11.1.4 SWOT Analysis

11.2 McKesson Corporation

11.2.1 Company Overview

11.2.2 Financial

11.2.3 Products/ Services Offered

11.2.4 SWOT Analysis

11.3 Epic Systems Corporation

11.3.1 Company Overview

11.3.2 Financial

11.3.3 Products/ Services Offered

11.3.4 SWOT Analysis

11.4 GE Healthcare.

11.4.1 Company Overview

11.4.2 Financial

11.4.3 Products/ Services Offered

11.4.4 SWOT Analysis

11.5 Siemens Healthineers

11.5.1 Company Overview

11.5.2 Financial

11.5.3 Products/ Services Offered

11.5.4 SWOT Analysis

11.6 Philips Healthcare

11.6.1 Company Overview

11.6.2 Financial

11.6.3 Products/ Services Offered

11.6.4 SWOT Analysis

11.7 IBM (Merge Healthcare)

11.7.1 Company Overview

11.7.2 Financial

11.7.3 Products/ Services Offered

11.7.4 SWOT Analysis

11.8 Allscripts Healthcare Solutions

11.8.1 Company Overview

11.8.2 Financial

11.8.3 Products/ Services Offered

11.8.4 SWOT Analysis

11.9 MedInformatix

11.9.1 Company Overview

11.9.2 Financial

11.9.3 Products/ Services Offered

11.9.4 SWOT Analysis

11.10 Pro Medicus Ltd.

11.10.1 Company Overview

11.10.2 Financial

11.10.3 Products/ Services Offered

11.10.4 SWOT Analysis

12. Use Cases and Best Practices

13. Conclusion

An accurate research report requires proper strategizing as well as implementation. There are multiple factors involved in the completion of good and accurate research report and selecting the best methodology to compete the research is the toughest part. Since the research reports we provide play a crucial role in any company’s decision-making process, therefore we at SNS Insider always believe that we should choose the best method which gives us results closer to reality. This allows us to reach at a stage wherein we can provide our clients best and accurate investment to output ratio.

Each report that we prepare takes a timeframe of 350-400 business hours for production. Starting from the selection of titles through a couple of in-depth brain storming session to the final QC process before uploading our titles on our website we dedicate around 350 working hours. The titles are selected based on their current market cap and the foreseen CAGR and growth.


The 5 steps process:

Step 1: Secondary Research:

Secondary Research or Desk Research is as the name suggests is a research process wherein, we collect data through the readily available information. In this process we use various paid and unpaid databases which our team has access to and gather data through the same. This includes examining of listed companies’ annual reports, Journals, SEC filling etc. Apart from this our team has access to various associations across the globe across different industries. Lastly, we have exchange relationships with various university as well as individual libraries.

Secondary Research

Step 2: Primary Research

When we talk about primary research, it is a type of study in which the researchers collect relevant data samples directly, rather than relying on previously collected data.  This type of research is focused on gaining content specific facts that can be sued to solve specific problems. Since the collected data is fresh and first hand therefore it makes the study more accurate and genuine.

We at SNS Insider have divided Primary Research into 2 parts.

Part 1 wherein we interview the KOLs of major players as well as the upcoming ones across various geographic regions. This allows us to have their view over the market scenario and acts as an important tool to come closer to the accurate market numbers. As many as 45 paid and unpaid primary interviews are taken from both the demand and supply side of the industry to make sure we land at an accurate judgement and analysis of the market.

This step involves the triangulation of data wherein our team analyses the interview transcripts, online survey responses and observation of on filed participants. The below mentioned chart should give a better understanding of the part 1 of the primary interview.

Primary Research

Part 2: In this part of primary research the data collected via secondary research and the part 1 of the primary research is validated with the interviews from individual consultants and subject matter experts.

Consultants are those set of people who have at least 12 years of experience and expertise within the industry whereas Subject Matter Experts are those with at least 15 years of experience behind their back within the same space. The data with the help of two main processes i.e., FGDs (Focused Group Discussions) and IDs (Individual Discussions). This gives us a 3rd party nonbiased primary view of the market scenario making it a more dependable one while collation of the data pointers.

Step 3: Data Bank Validation

Once all the information is collected via primary and secondary sources, we run that information for data validation. At our intelligence centre our research heads track a lot of information related to the market which includes the quarterly reports, the daily stock prices, and other relevant information. Our data bank server gets updated every fortnight and that is how the information which we collected using our primary and secondary information is revalidated in real time.

Data Bank Validation

Step 4: QA/QC Process

After all the data collection and validation our team does a final level of quality check and quality assurance to get rid of any unwanted or undesired mistakes. This might include but not limited to getting rid of the any typos, duplication of numbers or missing of any important information. The people involved in this process include technical content writers, research heads and graphics people. Once this process is completed the title gets uploader on our platform for our clients to read it.

Step 5: Final QC/QA Process:

This is the last process and comes when the client has ordered the study. In this process a final QA/QC is done before the study is emailed to the client. Since we believe in giving our clients a good experience of our research studies, therefore, to make sure that we do not lack at our end in any way humanly possible we do a final round of quality check and then dispatch the study to the client.

Key Market Segments:

By Product

  • Integrated RIS

  • Standalone RIS

By Deployment Mode

  • Web-based

  • Cloud-based

  • On-premise

By End Use

  • Hospitals & Clinics

  • Outpatient Department (OPD) Clinics

  • Others

Request for Segment Customization as per your Business Requirement: Segment Customization Request

REGIONAL COVERAGE:

North America

  • US

  • Canada

  • Mexico

Europe

  • Eastern Europe

    • Poland

    • Romania

    • Hungary

    • Turkey

    • Rest of Eastern Europe

  • Western Europe

    • Germany

    • France

    • UK

    • Italy

    • Spain

    • Netherlands

    • Switzerland

    • Austria

    • Rest of Western Europe

Asia Pacific

  • China

  • India

  • Japan

  • South Korea

  • Vietnam

  • Singapore

  • Australia

  • Rest of Asia Pacific

Middle East & Africa

  • Middle East

    • UAE

    • Egypt

    • Saudi Arabia

    • Qatar

    • Rest of the Middle East

  • Africa

    • Nigeria

    • South Africa

    • Rest of Africa

Latin America

  • Brazil

  • Argentina

  • Colombia

  • Rest of Latin America

Request for Country Level Research Report: Country Level Customization Request

Available Customization

With the given market data, SNS Insider offers customization as per the company’s specific needs. The following customization options are available for the report:

  • Product Analysis

  • Criss-Cross segment analysis (e.g. Product X Application)

  • Product Matrix which gives a detailed comparison of product portfolio of each company

  • Geographic Analysis

  • Additional countries in any of the regions

  • Company Information

  • Detailed analysis and profiling of additional market players (Up to five)


  •            5000 (33% Discount)


  •            8950 (40% Discount)


  •            3050 (23% Discount)

Start a Conversation

Hi! Click one of our member below to chat on Phone