image

Radiation Dose Optimization Software Market Report Scope & Overview:

Radiation Dose Optimization Software Market Revenue Analysis

Get More Information on Radiation Dose Optimization Software Market - Request Sample Report

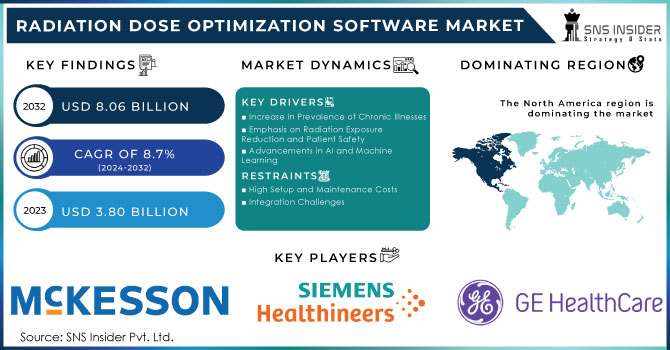
The Radiation Dose Optimization Software Market was valued at USD 3.80 Billion in 2023 and will reach USD 8.06 Billion by 2032, with a growing CAGR of 8.7% during the forecast period of 2024-2032.

The Radiation Dose Optimization Software market is experiencing notable growth due to a heightened focus on patient safety and regulatory compliance in diagnostic imaging and therapeutic procedures. This growth is driven by increased awareness of radiation risks and the push for precise dose management to reduce adverse effects while maximizing diagnostic accuracy. One of the drivers is the growing emphasis on radiation safety and patient protection, as medical professionals aim to minimize radiation exposure during diagnostic procedures. The increasing prevalence of chronic illnesses, such as cancer, cardiovascular diseases, and respiratory conditions, is significantly driving the demand for radiation dose optimization technologies. Chronic diseases often necessitate frequent imaging procedures to monitor disease progression, evaluate treatment efficacy, and guide medical interventions. Patients undergoing treatment for cancer frequently require imaging to assess tumor size, response to therapy, and disease spread. According to the World Health Organization (WHO), cancer incidence is expected to rise, leading to an increased need for imaging technologies. Optimization software helps manage the radiation dose during these frequent scans, minimizing risks while ensuring accurate diagnostic results. Advances in artificial intelligence (AI) and machine learning are enhancing the precision and efficacy of these software solutions, enabling improved dose management and real-time analytics. Additionally, stringent regulatory standards and guidelines for radiation dose monitoring are compelling healthcare facilities to adopt advanced optimization software to ensure compliance and enhance patient outcomes. For example, a June 2022 study in the Children's Journal explored AI, specifically deep convolutional neural networks (CNNs), to reduce radiation doses in pediatric CT scans. The study found AI could cut radiation by 36-70% while maintaining diagnostic image quality.

The Radiation Dose Optimization Software market benefits significantly from early detection capabilities, enabling timely identification of excessive radiation exposure and adjustment needs. By integrating advanced analytics and real-time monitoring, these software solutions enhance the early detection of dose deviations, which helps in mitigating risks and ensuring patient safety. This proactive approach supports adherence to regulatory standards and improves overall diagnostic accuracy and efficiency.

On the supply side, key players are investing significantly in research and development to enhance their radiation dose optimization software. Innovations are centered on integrating AI and machine learning to improve dose accuracy, streamline workflows, and provide actionable insights for clinicians. Companies are expanding their product offerings to include features like real-time dose tracking, automatic dose adjustment, and comprehensive reporting tools. The competitive supply landscape includes both established players and emerging startups contributing to advanced solutions.

Governments worldwide are enforcing stringent regulations and guidelines for radiation exposure management. Regulatory bodies such as the U.S. Food and Drug Administration (FDA), the European Commission, and various national health agencies have set standards for radiation dose limits and reporting requirements. These regulations drive healthcare providers to adopt dose optimization software to ensure compliance and enhance patient safety. Additionally, initiatives like the Image Gently Alliance and the Radiological Society of North America (RSNA) promote best practices in radiation dose management and encourage the adoption of advanced software solutions.

Market Dynamics

Drivers:

  • Increase in Prevalence of Chronic Illnesses

The rising incidence of chronic diseases such as cancer and cardiovascular conditions is driving the demand for diagnostic imaging tests. This increase in imaging procedures necessitates sophisticated dose optimization tools to manage and monitor radiation levels effectively. With cardiovascular diseases being a leading cause of mortality worldwide, regular imaging such as CT angiography or cardiac MRI is essential for patient management. The American Heart Association highlights the growing number of cardiovascular cases i.e. About 1 in 3 adults in the United States, which equates to approximately 85 million people, are affected by cardiovascular diseases (CVD) including heart disease, stroke, and high blood pressure., driving the need for effective dose management solutions to balance diagnostic accuracy and radiation safety.
Chronic respiratory diseases, such as chronic obstructive pulmonary disease (COPD), necessitate regular imaging to assess lung function and track disease progression. According to the National Institutes of Health (NIH), COPD affects approximately 16 million adults in the United States. This high prevalence underscores the growing need for advanced radiation dose optimization software to ensure patient safety during frequent imaging procedures. As COPD and similar conditions become more common, the demand for technologies that can manage and reduce radiation exposure while maintaining diagnostic accuracy is intensifying. This trend highlights the critical role of dose optimization software in protecting patients during routine imaging and managing the burden of chronic respiratory diseases. The integration of radiation dose optimization technologies in response to the growing incidence of these chronic conditions ensures that imaging procedures are performed safely and effectively, maintaining high diagnostic quality while minimizing patient exposure to harmful radiation.

  • Emphasis on Radiation Exposure Reduction and Patient Safety

There is a growing focus on minimizing radiation exposure and enhancing patient safety in medical imaging. This has heightened the demand for advanced software solutions that ensure precise dose management, reducing the risk of radiation-induced complications.

  • Advancements in AI and Machine Learning

Developments in artificial intelligence (AI) and machine learning are significantly enhancing the capabilities of dose optimization software. These technologies enable real-time dose adjustments, predictive analytics, and improved accuracy, thereby increasing the effectiveness and efficiency of radiation dose management.

  • Strict Legal Restrictions and Regulations

Regulatory requirements mandating efficient radiation dosage monitoring are pushing healthcare providers to adopt advanced software solutions. Compliance with stringent guidelines ensures patient safety and avoids potential legal repercussions.

Disease Category

Specific Disease

Imaging Techniques

Purpose of Imaging

Cancer

  • Breast Cancer

Mammograms, CT scans, MRIs

Monitor tumor progression and response to treatment


  • Lung Cancer

CT scans, PET scans

Assess tumor size and metastasis


  • Colorectal Cancer

CT scans, MRIs

Track disease status and detect recurrence

Cardiovascular Diseases

Coronary Artery Disease (CAD)

CT angiography, Cardiac MRIs

Evaluate coronary artery blockages and heart function


  • Heart Failure

Echocardiograms, Cardiac MRIs

Monitor heart function and structure

Chronic Respiratory Diseases

Chronic Obstructive Pulmonary Disease (COPD)

Chest X-rays, CT scans

Monitor lung damage and disease progression


  • Asthma

Imaging to assess airway inflammation and structural changes

Assess airway inflammation and structural changes

Autoimmune Diseases

Rheumatoid Arthritis

X-rays, MRIs

Monitor joint damage and disease progression


  • Systemic Lupus Erythematosus (SLE)

Imaging studies to assess internal organ involvement

Assess internal organ involvement and damage

Neurological Disorders

Multiple Sclerosis (MS)

MRIs

Track lesion development and disease progression


  • Epilepsy

Brain MRIs, PET scans

Identify focal abnormalities and assess treatment efficacy


The above table outlines the key diseases that require frequent imaging, the specific techniques used, and the purpose of these imaging procedures, which are crucial for optimizing radiation dose and ensuring patient safety.

Market Restraints:

  • High Setup and Maintenance Costs

The initial investment and ongoing maintenance expenses associated with sophisticated dose optimization software can be prohibitively high. This cost barrier may deter smaller healthcare facilities from adopting these advanced solutions.

  • Integration Challenges

  • Limited Knowledge and Training

  • Data Security and Privacy Concerns

Key Segmentation:

By Components

In the Radiation Dose Optimization Software Market, the Software segment commanded a leading 29.0% share in 2023. This dominance can be attributed to the widespread implementation of automated dose tracking and optimization tools within healthcare facilities. These software solutions are highly valued for their precision in monitoring and adjusting radiation doses, thereby ensuring both patient safety and adherence to stringent regulatory standards. Automated systems offer real-time analytics and accurate dose management, which are crucial for minimizing radiation exposure while enhancing diagnostic accuracy. As healthcare providers increasingly recognize the importance of effective dose management, the adoption of advanced software solutions continues to rise.

On the other hand, the Services segment, with a notable focus on Support services, is poised to experience the fastest growth. The complexity of modern dose optimization software necessitates ongoing technical support, system maintenance, and regular updates to ensure optimal performance and reliability. As healthcare facilities integrate more sophisticated software into their operations, the demand for comprehensive support services is expected to surge. This growth reflects the need for continuous technical assistance to manage and optimize advanced dose management systems effectively, further driving the expansion of the Services segment in the market.

By End-User

In the Radiation Dose Optimization Software Market, hospitals led with a substantial 32.9% share in 2023. This dominance is attributed to the extensive adoption of radiation dose optimization tools for both diagnostic imaging and cancer treatment within hospital settings. Hospitals are major consumers of these technologies, driven by the need to comply with rigorous regulatory standards and enhance patient safety. The large-scale implementation of dose optimization solutions helps hospitals manage radiation exposure effectively, ensuring adherence to safety protocols while delivering high-quality diagnostic and therapeutic outcomes. The significant investment in these technologies underscores hospitals' commitment to improving patient care and meeting regulatory requirements.

Conversely, Cancer Research Institutes are anticipated to witness the fastest growth in the market over the forecast period. This growth is propelled by the institutes’ focus on cutting-edge research and their commitment to minimizing radiation exposure during cancer treatments. As these institutions push the boundaries of cancer research, they increasingly adopt advanced radiation dose optimization technologies to refine treatment protocols and improve patient outcomes. The drive for innovation and precision in cancer care fuels the demand for sophisticated dose management solutions, positioning Cancer Research Institutes as key contributors to the market's rapid expansion.
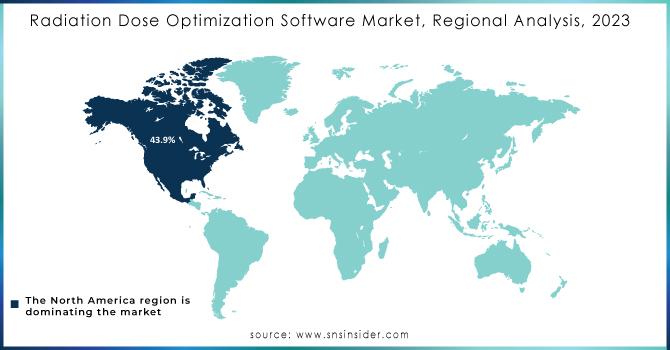
Regional Analysis

North America

In 2023, North America held a commanding 43.9% share of the radiation dose optimization software market, largely due to the region's advanced healthcare infrastructure and rigorous regulatory standards. The United States and Canada have established themselves as leaders in adopting cutting-edge healthcare technologies, including sophisticated radiation dose optimization solutions. The strong regulatory frameworks in these countries play a crucial role in driving market demand. Agencies like the U.S. Food and Drug Administration (FDA) and Health Canada enforce strict guidelines for radiation safety and dose management, compelling healthcare providers to implement advanced software to ensure compliance. This regulatory pressure, combined with the region's substantial investment in healthcare technology, has fostered an environment ripe for the growth of radiation dose optimization software. The high level of technological adoption in North America, including the integration of artificial intelligence and machine learning in medical imaging, further supports the region's dominant position in the market.

Europe

Europe is experiencing notable growth in the radiation dose optimization software market, fueled by similar regulatory pressures and technological advancements as seen in North America. European countries such as Germany, the United Kingdom, and France are at the forefront of adopting and integrating advanced dose optimization technologies. The European Union has established comprehensive guidelines and standards aimed at enhancing patient safety and minimizing radiation exposure, driving healthcare facilities across the continent to invest in sophisticated software solutions. The emphasis on compliance with these regulations, coupled with ongoing advancements in healthcare technology, contributes to Europe's significant market growth. Furthermore, European countries are engaged in continuous research and development to improve software capabilities, ensuring that healthcare providers have access to the latest innovations in dose management. This commitment to regulatory adherence and technological progress solidifies Europe’s position as a key player in the radiation dose optimization software market.

Asia-Pacific

The Asia-Pacific region is emerging as the fastest-growing market for radiation dose optimization software, driven by rapid advancements in healthcare infrastructure and increasing investments in medical technology. Countries such as China, India, and Japan are witnessing significant growth in demand for radiation dose optimization solutions due to their expanding healthcare networks and a rising prevalence of chronic diseases. The region's rapid development of healthcare facilities is enhancing access to advanced diagnostic imaging technologies, which in turn increases the need for effective dose management solutions. Additionally, government initiatives aimed at improving healthcare quality and safety are further propelling the market. The growing focus on integrating advanced software solutions into medical practices reflects the region's commitment to enhancing patient care and optimizing radiation exposure. As healthcare technology continues to advance and the burden of chronic diseases rises, the Asia-Pacific market is expected to maintain its robust growth trajectory, driven by both technological and healthcare infrastructure developments.

Radiation-Dose-Optimization-Software-Market-Regional-Analysis-2023

Need any customization research on Radiation Dose Optimization Software Market - Enquiry Now

Key Players

Recent Developments

  • July 2024: GE Healthcare introduced an AI-driven dose management solution to enhance real-time dose adjustments and imaging accuracy.

  • June 2024: Siemens Healthineers launched a new dose optimization software version with improved integration capabilities for seamless data sharing.

  • April 2024: Philips Healthcare unveiled an updated radiation dose management system with advanced visualization tools and automated dose tracking.

  • March 2024: Canon Medical Systems released a software update featuring improved dose reduction algorithms and enhanced user interfaces.

  • February 2024: Varian Medical Systems introduced a new dose optimization tool focused on precision and patient-specific adjustments for radiation therapy.

Radiation Dose Optimization Software Market Report Scope:

Report Attributes Details
Market Size in 2023 US$ 3.80 Billion 
Market Size by 2032 US$ 8.06 billion 
CAGR CAGR of 8.7% From 2024 to 2032
Base Year 2023
Forecast Period 2024-2032
Historical Data 2020-2022
Report Scope & Coverage Market Size, Segments Analysis, Competitive  Landscape, Regional Analysis, DROC & SWOT Analysis, Forecast Outlook
Key Segments

• By Component (Software, Automatic, Manual, Services, Education & Training, Support)
• By End User (Hospitals, Diagnostic Centres, Cancer Research Institutes, Others)

Regional Analysis/Coverage North America (US, Canada, Mexico), Europe (Eastern Europe [Poland, Romania, Hungary, Turkey, Rest of Eastern Europe] Western Europe] Germany, France, UK, Italy, Spain, Netherlands, Switzerland, Austria, Rest of Western Europe]), Asia Pacific (China, India, Japan, South Korea, Vietnam, Singapore, Australia, Rest of Asia Pacific), Middle East & Africa (Middle East [UAE, Egypt, Saudi Arabia, Qatar, Rest of Middle East], Africa [Nigeria, South Africa, Rest of Africa], Latin America (Brazil, Argentina, Colombia, Rest of Latin America)
Company Profiles GE Healthcare, Siemens Healthineers, Philips Healthcare, Canon Medical Systems, Varian Medical Systems, McKesson Corporation, IMAGO Radiology, Sectra AB, Merge Healthcare (an IBM Company), Toshiba Medical Systems, and others.
Key Drivers

• Emphasis on Radiation Exposure Reduction and Patient Safety
• Increase in Prevalence of Chronic Illnesses
• Advancements in AI and Machine Learning
• Strict Legal Restrictions and Regulations

Restraints

• High Setup and Maintenance Costs
• Limited Knowledge and Training
• Data Security and Privacy Concerns
• Integration Challenges


Frequently Asked Questions

Ans: The estimated compound annual growth rate is 8.7% during the forecast period for the Radiation Dose Optimization Software market.

Ans: The projected market value of the Radiation Dose Optimization Software market is estimated at USD 3.80 Billion in 2023 and is expected to reach USD 8.60 billion by 2032.

Ans: There is a growing focus on minimizing radiation exposure and enhancing patient safety in medical imaging is one of the drivers for the radiation dose optimization software market.

Ans: The initial investment and ongoing maintenance expenses associated with sophisticated dose optimization software can be prohibitively high.

Ans: North America is the dominant region with a 43.9% market share in the Radiation Dose Optimization Software market.

Table of Contents

1. Introduction

1.1 Market Definition

1.2 Scope (Inclusion and Exclusions)

1.3 Research Assumptions

2. Executive Summary

2.1 Market Overview

2.2 Regional Synopsis

2.3 Competitive Summary

3. Research Methodology

3.1 Top-Down Approach

3.2 Bottom-up Approach

3.3. Data Validation

3.4 Primary Interviews

4. Market Dynamics Impact Analysis

4.1 Market Driving Factors Analysis

4.1.2 Drivers

4.1.2 Restraints

4.1.3 Opportunities

4.1.4 Challenges

4.2 PESTLE Analysis

4.3 Porter’s Five Forces Model

5. Statistical Insights and Trends Reporting

5.1 Adoption Rates, 2023

5.2 User Demographics, By User Type and Roles, 2023

5.3 Feature Analysis, by Feature Type

5.4 Cost Analysis, by Software

5.5 Integration Capabilities

5.6 Regulatory Compliance, by Region

6. Competitive Landscape

6.1 List of Major Companies, By Region

6.2 Market Share Analysis, By Region

6.3 Product Benchmarking

6.3.1 Product specifications and features

6.3.2 Pricing

6.4 Strategic Initiatives

6.4.1 Marketing and promotional activities

6.4.2 Distribution and Supply Chain Strategies

6.4.3 Expansion plans and new product launches

6.4.4 Strategic partnerships and collaborations

6.5 Technological Advancements

6.6 Market Positioning and Branding

7. Radiation Dose Optimization Software Market Segmentation, by Component

     7.1 Chapter Overview

     7.2 Software

             7.2.1 Software Market Trends Analysis (2020-2032)

7.2.2 Software Market Size Estimates and Forecasts to 2032 (USD Million)

     7.3 Automatic

             7.3.1 Automatic Market Trends Analysis (2020-2032)

7.3.2 Automatic Market Size Estimates and Forecasts to 2032 (USD Million)

     7.4 Manual

             7.4.1 Manual Market Trends Analysis (2020-2032)

7.4.2 Manual Market Size Estimates and Forecasts to 2032 (USD Million)

     7.5 Services

             7.5.1 Services Market Trends Analysis (2020-2032)

7.5.2 Services Market Size Estimates and Forecasts to 2032 (USD Million)

     7.6 Education & Training

             7.6.1 Education & Training Market Trends Analysis (2020-2032)

7.6.2 Education & Training Market Size Estimates and Forecasts to 2032 (USD Million)

     7.7 Support

             7.7.1 Support Market Trends Analysis (2020-2032)

7.7.2 Support Market Size Estimates and Forecasts to 2032 (USD Million)

8. Radiation Dose Optimization Software Market Segmentation, by End User

     8.1 Chapter Overview

     8.2 Hospitals

             8.2.1 Hospitals Market Trends Analysis (2020-2032)

8.2.2 Hospitals Market Size Estimates and Forecasts to 2032 (USD Million)

     8.3 Diagnostic Centres

8.3.1 Diagnostic Centres Market Trends Analysis (2020-2032)

              8.3.2 Diagnostic Centres Market Size Estimates and Forecasts to 2032 (USD Million)

   8.4 Cancer Research Institutes

           8.4.1 Cancer Research Institutes Market Trends Analysis (2020-2032)

           8.4.2 Cancer Research Institutes Market Size Estimates and Forecasts to 2032 (USD Million)

   8.5 Others

           8.5.1 Others Market Trends Analysis (2020-2032)

           8.5.2 Others Market Size Estimates and Forecasts to 2032 (USD Million)

9. Regional Analysis

9.1 Chapter Overview

9.2 North America

9.2.1 Trends Analysis

9.2.2 North America Radiation Dose Optimization Software Market Estimates and Forecasts, by Country (2020-2032) (USD Million)

9.2.3 North America Radiation Dose Optimization Software Market Estimates and Forecasts, by Component (2020-2032) (USD Million) 

9.2.4 North America Radiation Dose Optimization Software Market Estimates and Forecasts, by End User (2020-2032) (USD Million)

9.2.5 USA

9.2.5.1 USA Radiation Dose Optimization Software Market Estimates and Forecasts, by Component (2020-2032) (USD Million)

9.2.5.2 USA Radiation Dose Optimization Software Market Estimates and Forecasts, by End User (2020-2032) (USD Million)

9.2.6 Canada

9.2.6.1 Canada Radiation Dose Optimization Software Market Estimates and Forecasts, by Component (2020-2032) (USD Million)

9.2.6.2 Canada Radiation Dose Optimization Software Market Estimates and Forecasts, by End User (2020-2032) (USD Million)

9.2.7 Mexico

9.2.7.1 Mexico Radiation Dose Optimization Software Market Estimates and Forecasts, by Component (2020-2032) (USD Million)

9.2.7.2 Mexico Radiation Dose Optimization Software Market Estimates and Forecasts, by End User (2020-2032) (USD Million)

9.3 Europe

9.3.1 Eastern Europe

9.3.1.1 Trends Analysis

9.3.1.2 Eastern Europe Radiation Dose Optimization Software Market Estimates and Forecasts, by Country (2020-2032) (USD Million)

9.3.1.3 Eastern Europe Radiation Dose Optimization Software Market Estimates and Forecasts, by Component (2020-2032) (USD Million) 

9.3.1.4 Eastern Europe Radiation Dose Optimization Software Market Estimates and Forecasts, by End User (2020-2032) (USD Million)

9.3.1.5 Poland

9.3.1.5.1 Poland Radiation Dose Optimization Software Market Estimates and Forecasts, by Component (2020-2032) (USD Million)

9.3.1.5.2 Poland Radiation Dose Optimization Software Market Estimates and Forecasts, by End User (2020-2032) (USD Million)

9.3.1.6 Romania

9.3.1.6.1 Romania Radiation Dose Optimization Software Market Estimates and Forecasts, by Component (2020-2032) (USD Million)

9.3.1.6.2 Romania Radiation Dose Optimization Software Market Estimates and Forecasts, by End User (2020-2032) (USD Million)

9.3.1.7 Hungary

9.3.1.7.1 Hungary Radiation Dose Optimization Software Market Estimates and Forecasts, by Component (2020-2032) (USD Million)

9.3.1.7.2 Hungary Radiation Dose Optimization Software Market Estimates and Forecasts, by End User (2020-2032) (USD Million)

9.3.1.8 Turkey

9.3.1.8.1 Turkey Radiation Dose Optimization Software Market Estimates and Forecasts, by Component (2020-2032) (USD Million)

9.3.1.8.2 Turkey Radiation Dose Optimization Software Market Estimates and Forecasts, by End User (2020-2032) (USD Million)

9.3.1.9 Rest of Eastern Europe

9.3.1.9.1 Rest of Eastern Europe Radiation Dose Optimization Software Market Estimates and Forecasts, by Component (2020-2032) (USD Million)

9.3.1.9.2 Rest of Eastern Europe Radiation Dose Optimization Software Market Estimates and Forecasts, by End User (2020-2032) (USD Million)

9.3.2 Western Europe

9.3.2.1 Trends Analysis

9.3.2.2 Western Europe Radiation Dose Optimization Software Market Estimates and Forecasts, by Country (2020-2032) (USD Million)

9.3.2.3 Western Europe Radiation Dose Optimization Software Market Estimates and Forecasts, by Component (2020-2032) (USD Million) 

9.3.2.4 Western Europe Radiation Dose Optimization Software Market Estimates and Forecasts, by End User (2020-2032) (USD Million)

9.3.2.5 Germany

9.3.2.5.1 Germany Radiation Dose Optimization Software Market Estimates and Forecasts, by Component (2020-2032) (USD Million)

9.3.2.5.2 Germany Radiation Dose Optimization Software Market Estimates and Forecasts, by End User (2020-2032) (USD Million)

9.3.2.6 France

9.3.2.6.1 France Radiation Dose Optimization Software Market Estimates and Forecasts, by Component (2020-2032) (USD Million)

9.3.2.6.2 France Radiation Dose Optimization Software Market Estimates and Forecasts, by End User (2020-2032) (USD Million)

9.3.2.7 UK

9.3.2.7.1 UK Radiation Dose Optimization Software Market Estimates and Forecasts, by Component (2020-2032) (USD Million)

9.3.2.7.2 UK Radiation Dose Optimization Software Market Estimates and Forecasts, by End User (2020-2032) (USD Million)

9.3.2.8 Italy

9.3.2.8.1 Italy Radiation Dose Optimization Software Market Estimates and Forecasts, by Component (2020-2032) (USD Million)

9.3.2.8.2 Italy Radiation Dose Optimization Software Market Estimates and Forecasts, by End User (2020-2032) (USD Million)

9.3.2.9 Spain

9.3.2.9.1 Spain Radiation Dose Optimization Software Market Estimates and Forecasts, by Component (2020-2032) (USD Million)

9.3.2.9.2 Spain Radiation Dose Optimization Software Market Estimates and Forecasts, by End User (2020-2032) (USD Million)

9.3.2.10 Netherlands

9.3.2.10.1 Netherlands Radiation Dose Optimization Software Market Estimates and Forecasts, by Component (2020-2032) (USD Million)

9.3.2.10.2 Netherlands Radiation Dose Optimization Software Market Estimates and Forecasts, by End User (2020-2032) (USD Million)

9.3.2.11 Switzerland

9.3.2.11.1 Switzerland Radiation Dose Optimization Software Market Estimates and Forecasts, by Component (2020-2032) (USD Million)

9.3.2.11.2 Switzerland Radiation Dose Optimization Software Market Estimates and Forecasts, by End User (2020-2032) (USD Million)

9.3.2.12 Austria

9.3.2.12.1 Austria Radiation Dose Optimization Software Market Estimates and Forecasts, by Component (2020-2032) (USD Million)

9.3.2.12.2 Austria Radiation Dose Optimization Software Market Estimates and Forecasts, by End User (2020-2032) (USD Million)

9.3.2.13 Rest of Western Europe

9.3.2.13.1 Rest of Western Europe Radiation Dose Optimization Software Market Estimates and Forecasts, by Component (2020-2032) (USD Million)

9.3.2.13.2 Rest of Western Europe Radiation Dose Optimization Software Market Estimates and Forecasts, by End User (2020-2032) (USD Million)

9.4 Asia Pacific

9.4.1 Trends Analysis

9.4.2 Asia Pacific Radiation Dose Optimization Software Market Estimates and Forecasts, by Country (2020-2032) (USD Million)

9.4.3 Asia Pacific Radiation Dose Optimization Software Market Estimates and Forecasts, by Component (2020-2032) (USD Million) 

9.4.4 Asia Pacific Radiation Dose Optimization Software Market Estimates and Forecasts, by End User (2020-2032) (USD Million)

9.4.5 China

9.4.5.1 China Radiation Dose Optimization Software Market Estimates and Forecasts, by Component (2020-2032) (USD Million)

9.4.5.2 China Radiation Dose Optimization Software Market Estimates and Forecasts, by End User (2020-2032) (USD Million)

9.4.6 India

9.4.5.1 India Radiation Dose Optimization Software Market Estimates and Forecasts, by Component (2020-2032) (USD Million)

9.4.5.2 India Radiation Dose Optimization Software Market Estimates and Forecasts, by End User (2020-2032) (USD Million)

9.4.5 Japan

9.4.5.1 Japan Radiation Dose Optimization Software Market Estimates and Forecasts, by Component (2020-2032) (USD Million)

9.4.5.2 Japan Radiation Dose Optimization Software Market Estimates and Forecasts, by End User (2020-2032) (USD Million)

9.4.6 South Korea

9.4.6.1 South Korea Radiation Dose Optimization Software Market Estimates and Forecasts, by Component (2020-2032) (USD Million)

9.4.6.2 South Korea Radiation Dose Optimization Software Market Estimates and Forecasts, by End User (2020-2032) (USD Million)

9.4.7 Vietnam

9.4.7.1 Vietnam Radiation Dose Optimization Software Market Estimates and Forecasts, by Component (2020-2032) (USD Million)

9.2.7.2 Vietnam Radiation Dose Optimization Software Market Estimates and Forecasts, by End User (2020-2032) (USD Million)

9.4.8 Singapore

9.4.8.1 Singapore Radiation Dose Optimization Software Market Estimates and Forecasts, by Component (2020-2032) (USD Million)

9.4.8.2 Singapore Radiation Dose Optimization Software Market Estimates and Forecasts, by End User (2020-2032) (USD Million)

9.4.9 Australia

9.4.9.1 Australia Radiation Dose Optimization Software Market Estimates and Forecasts, by Component (2020-2032) (USD Million)

9.4.9.2 Australia Radiation Dose Optimization Software Market Estimates and Forecasts, by End User (2020-2032) (USD Million)

9.4.10 Rest of Asia Pacific

9.4.10.1 Rest of Asia Pacific Radiation Dose Optimization Software Market Estimates and Forecasts, by Component (2020-2032) (USD Million)

9.4.10.2 Rest of Asia Pacific Radiation Dose Optimization Software Market Estimates and Forecasts, by End User (2020-2032) (USD Million)

9.5 Middle East and Africa

9.5.1 Middle East

9.5.1.1 Trends Analysis

9.5.1.2 Middle East Radiation Dose Optimization Software Market Estimates and Forecasts, by Country (2020-2032) (USD Million)

9.5.1.3 Middle East Radiation Dose Optimization Software Market Estimates and Forecasts, by Component (2020-2032) (USD Million) 

9.5.1.4 Middle East Radiation Dose Optimization Software Market Estimates and Forecasts, by End User (2020-2032) (USD Million)

9.5.1.5 UAE

9.5.1.5.1 UAE Radiation Dose Optimization Software Market Estimates and Forecasts, by Component (2020-2032) (USD Million)

9.5.1.5.2 UAE Radiation Dose Optimization Software Market Estimates and Forecasts, by End User (2020-2032) (USD Million)

9.5.1.6 Egypt

9.5.1.6.1 Egypt Radiation Dose Optimization Software Market Estimates and Forecasts, by Component (2020-2032) (USD Million)

9.5.1.6.2 Egypt Radiation Dose Optimization Software Market Estimates and Forecasts, by End User (2020-2032) (USD Million)

9.5.1.7 Saudi Arabia

9.5.1.7.1 Saudi Arabia Radiation Dose Optimization Software Market Estimates and Forecasts, by Component (2020-2032) (USD Million)

9.5.1.7.2 Saudi Arabia Radiation Dose Optimization Software Market Estimates and Forecasts, by End User (2020-2032) (USD Million)

9.5.1.8 Qatar

9.5.1.8.1 Qatar Radiation Dose Optimization Software Market Estimates and Forecasts, by Component (2020-2032) (USD Million)

9.5.1.8.2 Qatar Radiation Dose Optimization Software Market Estimates and Forecasts, by End User (2020-2032) (USD Million)

9.5.1.9 Rest of Middle East

9.5.1.9.1 Rest of Middle East Radiation Dose Optimization Software Market Estimates and Forecasts, by Component (2020-2032) (USD Million)

9.5.1.9.2 Rest of Middle East Radiation Dose Optimization Software Market Estimates and Forecasts, by End User (2020-2032) (USD Million)

9.5.2 Africa

9.5.2.1 Trends Analysis

9.5.2.2 Africa Radiation Dose Optimization Software Market Estimates and Forecasts, by Country (2020-2032) (USD Million)

9.5.2.3 Africa Radiation Dose Optimization Software Market Estimates and Forecasts, by Component (2020-2032) (USD Million) 

9.5.2.4 Africa Radiation Dose Optimization Software Market Estimates and Forecasts, by End User (2020-2032) (USD Million)

9.5.2.5 South Africa

9.5.2.5.1 South Africa Radiation Dose Optimization Software Market Estimates and Forecasts, by Component (2020-2032) (USD Million)

9.5.2.5.2 South Africa Radiation Dose Optimization Software Market Estimates and Forecasts, by End User (2020-2032) (USD Million)

9.5.2.6 Nigeria

9.5.2.6.1 Nigeria Radiation Dose Optimization Software Market Estimates and Forecasts, by Component (2020-2032) (USD Million)

9.5.2.6.2 Nigeria Radiation Dose Optimization Software Market Estimates and Forecasts, by End User (2020-2032) (USD Million)

9.6 Latin America

9.6.1 Trends Analysis

9.6.2 Latin America Radiation Dose Optimization Software Market Estimates and Forecasts, by Country (2020-2032) (USD Million)

9.6.3 Latin America Radiation Dose Optimization Software Market Estimates and Forecasts, by Component (2020-2032) (USD Million) 

9.6.4 Latin America Radiation Dose Optimization Software Market Estimates and Forecasts, by End User (2020-2032) (USD Million)

9.6.5 Brazil

9.6.5.1 Brazil Radiation Dose Optimization Software Market Estimates and Forecasts, by Component (2020-2032) (USD Million)

9.6.5.2 Brazil Radiation Dose Optimization Software Market Estimates and Forecasts, by End User (2020-2032) (USD Million)

9.6.6 Argentina

9.6.6.1 Argentina Radiation Dose Optimization Software Market Estimates and Forecasts, by Component (2020-2032) (USD Million)

9.6.6.2 Argentina Radiation Dose Optimization Software Market Estimates and Forecasts, by End User (2020-2032) (USD Million)

9.6.7 Colombia

9.6.7.1 Colombia Radiation Dose Optimization Software Market Estimates and Forecasts, by Component (2020-2032) (USD Million)

9.6.7.2 Colombia Radiation Dose Optimization Software Market Estimates and Forecasts, by End User (2020-2032) (USD Million)

9.6.8 Rest of Latin America

9.6.8.1 Rest of Latin America Radiation Dose Optimization Software Market Estimates and Forecasts, by Component (2020-2032) (USD Million)

9.6.8.2 Rest of Latin America Radiation Dose Optimization Software Market Estimates and Forecasts, by End User (2020-2032) (USD Million)

10. Company Profiles

10.1 GE Healthcare

10.1.1 Company Overview

10.1.2 Financial

10.1.3 Products/ Services Offered

110.1.4 SWOT Analysis

10.2 Siemens Healthineers

10.2.1 Company Overview

10.2.2 Financial

10.2.3 Products/ Services Offered

10.2.4 SWOT Analysis

10.3 Philips Healthcare

10.3.1 Company Overview

10.3.2 Financial

10.3.3 Products/ Services Offered

10.3.4 SWOT Analysis

10.4 Canon Medical Systems

10.4.1 Company Overview

10.4.2 Financial

10.4.3 Products/ Services Offered

10.4.4 SWOT Analysis

10.5 Fujifilm (FUJIFILM Corporation)

10.5.1 Company Overview

10.5.2 Financial

10.5.3 Products/ Services Offered

10.5.4 SWOT Analysis

10.6 McKesson Corporation

10.6.1 Company Overview

10.6.2 Financial

10.6.3 Products/ Services Offered

10.6.4 SWOT Analysis

10.7 IMAGO Radiology

10.7.1 Company Overview

10.7.2 Financial

10.7.3 Products/ Services Offered

10.7.4 SWOT Analysis

10.8 Sectra AB

10.8.1 Company Overview

10.8.2 Financial

10.8.3 Products/ Services Offered

10.8.4 SWOT Analysis

10.9 Merge Healthcare (an IBM Company)

10.9.1 Company Overview

10.9.2 Financial

10.9.3 Products/ Services Offered

10.9.4 SWOT Analysis

10.10 Toshiba Medical Systems

10.9.1 Company Overview

10.9.2 Financial

10.9.3 Products/ Services Offered

10.9.4 SWOT Analysis

11. Use Cases and Best Practices

12. Conclusion


An accurate research report requires proper strategizing as well as implementation. There are multiple factors involved in the completion of good and accurate research report and selecting the best methodology to compete the research is the toughest part. Since the research reports we provide play a crucial role in any company’s decision-making process, therefore we at SNS Insider always believe that we should choose the best method which gives us results closer to reality. This allows us to reach at a stage wherein we can provide our clients best and accurate investment to output ratio.

Each report that we prepare takes a timeframe of 350-400 business hours for production. Starting from the selection of titles through a couple of in-depth brain storming session to the final QC process before uploading our titles on our website we dedicate around 350 working hours. The titles are selected based on their current market cap and the foreseen CAGR and growth.


The 5 steps process:

Step 1: Secondary Research:

Secondary Research or Desk Research is as the name suggests is a research process wherein, we collect data through the readily available information. In this process we use various paid and unpaid databases which our team has access to and gather data through the same. This includes examining of listed companies’ annual reports, Journals, SEC filling etc. Apart from this our team has access to various associations across the globe across different industries. Lastly, we have exchange relationships with various university as well as individual libraries.

Secondary Research

Step 2: Primary Research

When we talk about primary research, it is a type of study in which the researchers collect relevant data samples directly, rather than relying on previously collected data.  This type of research is focused on gaining content specific facts that can be sued to solve specific problems. Since the collected data is fresh and first hand therefore it makes the study more accurate and genuine.

We at SNS Insider have divided Primary Research into 2 parts.

Part 1 wherein we interview the KOLs of major players as well as the upcoming ones across various geographic regions. This allows us to have their view over the market scenario and acts as an important tool to come closer to the accurate market numbers. As many as 45 paid and unpaid primary interviews are taken from both the demand and supply side of the industry to make sure we land at an accurate judgement and analysis of the market.

This step involves the triangulation of data wherein our team analyses the interview transcripts, online survey responses and observation of on filed participants. The below mentioned chart should give a better understanding of the part 1 of the primary interview.

Primary Research

Part 2: In this part of primary research the data collected via secondary research and the part 1 of the primary research is validated with the interviews from individual consultants and subject matter experts.

Consultants are those set of people who have at least 12 years of experience and expertise within the industry whereas Subject Matter Experts are those with at least 15 years of experience behind their back within the same space. The data with the help of two main processes i.e., FGDs (Focused Group Discussions) and IDs (Individual Discussions). This gives us a 3rd party nonbiased primary view of the market scenario making it a more dependable one while collation of the data pointers.

Step 3: Data Bank Validation

Once all the information is collected via primary and secondary sources, we run that information for data validation. At our intelligence centre our research heads track a lot of information related to the market which includes the quarterly reports, the daily stock prices, and other relevant information. Our data bank server gets updated every fortnight and that is how the information which we collected using our primary and secondary information is revalidated in real time.

Data Bank Validation

Step 4: QA/QC Process

After all the data collection and validation our team does a final level of quality check and quality assurance to get rid of any unwanted or undesired mistakes. This might include but not limited to getting rid of the any typos, duplication of numbers or missing of any important information. The people involved in this process include technical content writers, research heads and graphics people. Once this process is completed the title gets uploader on our platform for our clients to read it.

Step 5: Final QC/QA Process:

This is the last process and comes when the client has ordered the study. In this process a final QA/QC is done before the study is emailed to the client. Since we believe in giving our clients a good experience of our research studies, therefore, to make sure that we do not lack at our end in any way humanly possible we do a final round of quality check and then dispatch the study to the client.

Key Market Segments:

By Component

  • Software

  • Automatic

  • Manual

  • Services

  • Education & Training

  • Support

By End User

  • Hospitals

  • Diagnostic Centres

  • Cancer Research Institutes

  • Others

Request for Segment Customization as per your Business Requirement: Segment Customization Request

Regional Coverage:

North America

  • US

  • Canada

  • Mexico

Europe

  • Eastern Europe

    • Poland

    • Romania

    • Hungary

    • Turkey

    • Rest of Eastern Europe

  • Western Europe

    • Germany

    • France

    • UK

    • Italy

    • Spain

    • Netherlands

    • Switzerland

    • Austria

    • Rest of Western Europe

Asia Pacific

  • China

  • India

  • Japan

  • South Korea

  • Vietnam

  • Singapore

  • Australia

  • Rest of Asia Pacific

Middle East & Africa

Middle East

  • UAE

  • Egypt

  • Saudi Arabia

  • Qatar

  • Rest of the Middle East

Africa

  • Nigeria

  • South Africa

  • Rest of Africa

Latin America

  • Brazil

  • Argentina

  • Colombia

  • Rest of Latin America

Request for Country Level Research Report: Country Level Customization Request

Available Customization

With the given market data, SNS Insider offers customization as per the company’s specific needs. The following customization options are available for the report:

  • Product Analysis

  • Criss-Cross segment analysis (e.g. Product X Application)

  • Product Matrix which gives a detailed comparison of the product portfolio of each company

  • Geographic Analysis

  • Additional countries in any of the regions

  • Company Information

  • Detailed analysis and profiling of additional market players (Up to five)


  •            5000 (33% Discount)


  •            8950 (40% Discount)


  •            3050 (23% Discount)

Start a Conversation

Hi! Click one of our member below to chat on Phone