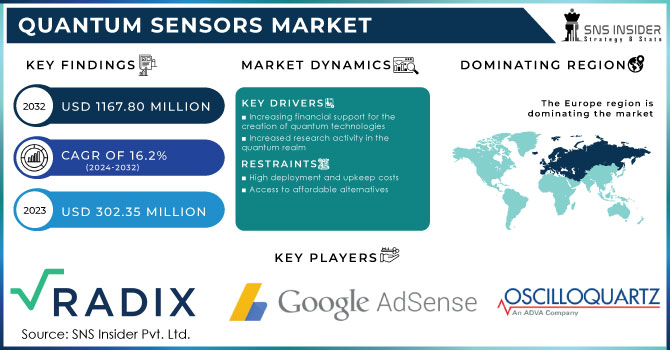
The Quantum Sensors Market was valued at USD 567.48 million in 2023 and is expected to reach USD 1592.42 million by 2032, growing at a CAGR of 12.18% over the forecast period 2024-2032. Quantum sensors market is registering fast-paced growth owing to the rapid adoption of premium technology across end-user verticals. As a function of quantum sensor applications in healthcare, defense, and environmental monitoring, adoption and integration metrics indicate a growing count of users. Improvement and innovation in quantum sensor technologies target increased precision, heightened sensitivity, and miniaturization to facilitate new applications. Manufacturing and production metrics focus on the problem of production scaling with a focus on producing more, cheaper, and more reliable. The fusion of AI and quantum computing in sensor applications is also rapidly adapting, which will create systems that are both more intelligent and energy-efficient while having the ability for enhanced data processing and analytics.
Get More Information on Quantum Sensors Market - Request Sample Report
Key Drivers:
Driving Forces Behind Quantum Sensors Market Growth in Automotive Aerospace Healthcare Sectors
High demand for high-precision sensing technologies in automotive, aerospace & defense, and healthcare industries is one of the major factors driving the market growth. Quantum sensors have a significant role in the automotive sector, especially when it comes to autonomous driving systems, which require highly accurate positioning and navigation information. Apart from these, in aerospace & defense, these sensors are extensively used in gravitational anomaly detection & submarine detection, and GPS-denied navigation. Increased investment levels by governments and private players in quantum R&D also contribute to the improvement of the increasing commercialization of quantum sensing technology. Another major driver of quantum sensing equipment demand is the growing requirement in the healthcare industry for ultra-sensitive medical imaging and diagnostics since quantum sensors can provide higher-resolution pictures supported by improved MRI technology and early disease detection.
Restrain:
Challenges Hindering Widespread Adoption of Quantum Sensors Despite Market Growth Potential
While the market for quantum sensors is thriving, several drivers may pose a restraint preventing them from achieving widespread adoption. The first and foremost challenge is the high cost and complexity associated with quantum sensor development and manufacturing. A lot of these sensors need very controlled environments, expensive materials, and very precise calibration, which makes them expensive and makes them difficult to commercialize at scale. Also, the teething phase of quantum technologies, with no standard protocols and demonstrations, is a major obstacle to uptake. While conventional sensing technologies remain a staple in many industries, requiring significant investments in research, training, and integration to transition to quantum-based alternatives slows market growth.
Opportunity:
Growth Opportunities in Quantum Sensors for Environmental Monitoring and Consumer Electronics Expansion
Growth opportunities also lie in the growing use of quantum technology for environmental monitoring like climate change studies and precision agriculture. Quantum sensors and technology offer success that corresponds with favorable developments in miniaturization, integration, and the production of small-sized, portable devices that can be easily transferred into consumer electronics and other mobile technology markets, including wearables. In addition, collaborative efforts among research institutions, technology companies, and start-ups pave the way for next-generation quantum sensors, offering enhanced precision and cost-effectiveness. As quantum computing and quantum communication are maturing along parallel paths, their convergence can unlock new use cases in the fields of quantum secure communication and quantum communication systems, which will increase the market size.
Challenges:
Overcoming Stability Challenges and Workforce Gaps for Widespread Quantum Sensor Integration
One of the key obstacles relates to the stability and reliability of the sensors (technological challenges). Now this sensor are very sensitive to environmental factors like temperature changes, EMI, Mechanical vibrations, etc. which can lead to inaccuracy and performance. Addressing these stability challenges will need continued improvements in quantum error correction and sensor scaling. In addition, the lack of quantum-trained physicists and engineers is still tripping innovation and commercialization up. These hurdles will need to be overcome with sustained investment in quantum research, interdisciplinary collaboration, and government support to create a favorable ecosystem to enable widespread integration of quantum sensors in the industries.
By Product
The quantum sensors market was dominated by Atomic Clocks in 2023 accounting for 39.3% of the market due to their extensive use in precise timekeeping, navigation, and defense applications. Their predominant use within GPS devices, telecommunications, and scientific research has established them as the market leader.
Photosynthetically Active Radiation (PAR) Sensors are expected to grow fastest between 2024 and 2032 and are driven by growing demand for these sensors in agriculture, environmental monitoring, and climate research. Increasing emphasis on sustainable agriculture and improving ambient conditions for plant growth using quantum-enabled light detection technologies is anticipated to lead to considerable demand for PAR sensors shortly.
By Application
The automotive application accounted for the largest market share of 32.7% in the quantum sensors market in 2023 due to the increasing integration of quantum sensors in advanced driver-assistance systems (ADAS), autonomous vehicles, and navigation. As the future of mobility relies more heavily on these adoption technologies, Quantum sensors will facilitate vehicle safety, positioning, and performance, making them a vital aspect of next-generation mobility solutions.
The healthcare segment is expected to register the fastest CAGR between 2024 and 2032 owing to rising demand for ultra-sensitive medical imaging, and interdisciplinary medical research for early detection of diseases and diagnostics. High sensitivity detection capabilities due to the quantum sensors lead to advanced technologies such as MRI, brain imaging, and bio-sensing applications.
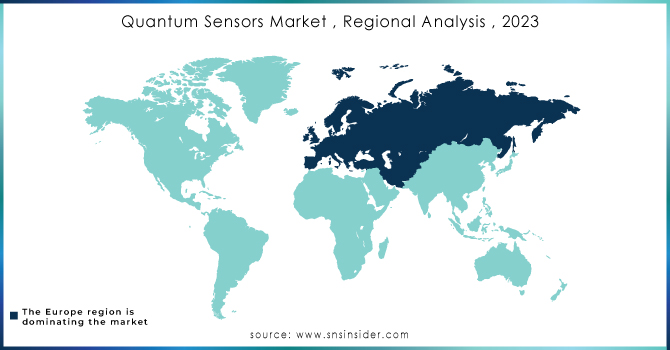
Europe led quantum sensors with a 33.7% share of the market in 2023 thanks to government funding, competitive research institutions, and partnerships between industry players. As a pioneer hub for the development of quantum technology, this includes the EURO 1 billion EU Quantum Flagship Program, dedicated to fostering quantum research in the region. European companies Muquans (France) and Qnami (Switzerland) are influence makers in quantum sensing solutions development for aerospace, defense, and medical imaging. Moreover, the UK National Quantum Technologies Programmed has also contributed advances in atomic clocks, and quantum magnetometers, further adding to the strength of Europe's business advantage in this space.
The Asia-Pacific market is expected to grow at the fastest CAGR from 2024-2032, due to Rising Quantum Technology Investments by China, Japan & South Korea Notably, China has made rapid advances like launching the Hefei National Laboratory for Physical Sciences concentrating on quantum precision measurement. Companies such as CASIQLY (China) are developing high-performance quantum sensors for a range of navigational and defense purposes. Meanwhile, Japan's home region of Ibaraki is emerging as the next potential powerhouse of quantum-enhanced healthcare solutions, with the RIKEN Center for Quantum Computing also on the hunt for top-tier quantum sensor commercialization within its borders.
Get Customized Report as per your Business Requirement - Request For Customized Report
Some of the major players in the Quantum Sensors Market are:
Andor Technology (Marana 4.2B-11, Balor sCMOS camera)
D-Wave Systems (D-Wave 2000Q, D-Wave Advantage)
Quantinuum (System Model H1-1, System Model H2)
Kistler Group (PiezoStar KI100 sensors, Type 6215 Quartz High-Pressure Sensor)
QuantX Labs (Cryoclock, advanced magnetic field sensors)
Xanadu Quantum Technologies (Programmable Gaussian Boson Sampler, Photonic Quantum Computer)
Uster Technologies (Quantum Expert System, Quantum 3 Yarn Clearer)
ID Quantique (ID281 Superconducting Nanowire System, Clavis3 Quantum Key Distribution)
Qnami (ProteusQ, Quantilever MX)
Muquans (Absolute Quantum Gravimeter, MuClock)
ColdQuanta (Quantum Core, Albert)
AOSense (Quantum Gravimeter, Atomic Gyroscope)
Bosch (MEMS Quantum Sensors, BMA400 Accelerometer)
Honeywell Quantum Solutions (H1 Quantum Computer, Trapped-Ion Quantum Sensors)
Microsoft Quantum (Quantum Development Kit, Topological Qubits)
In November 2024, Andor Technology launched the ZL41 Cell and ZL41 Wave sCMOS cameras, enhancing sensor technology for life and physical sciences.
In January 2025, D-Wave and Carahsoft partnered to expand quantum computing solutions in the U.S. public sector, providing access via government contract vehicles.
| Report Attributes | Details |
|---|---|
| Market Size in 2023 | USD 567.48 Million |
| Market Size by 2032 | USD 1592.42 Million |
| CAGR | CAGR of 12.18% From 2024 to 2032 |
| Base Year | 2023 |
| Forecast Period | 2024-2032 |
| Historical Data | 2020-2022 |
| Report Scope & Coverage | Market Size, Segments Analysis, Competitive Landscape, Regional Analysis, DROC & SWOT Analysis, Forecast Outlook |
| Key Segments | • By Product (Atomic Clocks, Gravitational Sensors, Photosynthetically Active Radiation (PAR), Quantum Magnetic Sensors, Others) • By Application (Aerospace & Defense, Automotive, Oil & Gas, Healthcare, Other) |
| Regional Analysis/Coverage | North America (US, Canada, Mexico), Europe (Eastern Europe [Poland, Romania, Hungary, Turkey, Rest of Eastern Europe] Western Europe] Germany, France, UK, Italy, Spain, Netherlands, Switzerland, Austria, Rest of Western Europe]), Asia Pacific (China, India, Japan, South Korea, Vietnam, Singapore, Australia, Rest of Asia Pacific), Middle East & Africa (Middle East [UAE, Egypt, Saudi Arabia, Qatar, Rest of Middle East], Africa [Nigeria, South Africa, Rest of Africa], Latin America (Brazil, Argentina, Colombia, Rest of Latin America) |
| Company Profiles | Andor Technology, D-Wave Systems, Quantinuum, Kistler Group, QuantX Labs, Xanadu Quantum Technologies, Uster Technologies, ID Quantique, Qnami, Muquans, ColdQuanta, AOSense, Bosch, Honeywell Quantum Solutions, Microsoft Quantum. |
Ans: The Quantum Sensors Market is expected to grow at a CAGR of 12.18% during 2024-2032.
Ans: Quantum Sensors Market size was USD 567.48 Million in 2023 and is expected to Reach USD 1592.42 Million by 2032.
Ans: The major growth factor of the Quantum Sensors Market is the increasing demand for high-precision sensing technologies in industries like automotive, aerospace & defense.
Ans: The Atomic Clocks segment dominated the Industrial battery market in 2023.
Ans: Europe dominated the Quantum Sensors Market in 2023.
Table of Content
1. Introduction
1.1 Market Definition
1.2 Scope (Inclusion and Exclusions)
1.3 Research Assumptions
2. Executive Summary
2.1 Market Overview
2.2 Regional Synopsis
2.3 Competitive Summary
3. Research Methodology
3.1 Top-Down Approach
3.2 Bottom-up Approach
3.3. Data Validation
3.4 Primary Interviews
4. Market Dynamics Impact Analysis
4.1 Market Driving Factors Analysis
4.1.1 Drivers
4.1.2 Restraints
4.1.3 Opportunities
4.1.4 Challenges
4.2 PESTLE Analysis
4.3 Porter’s Five Forces Model
5. Statistical Insights and Trends Reporting
5.1 Adoption & Integration Metrics
5.2 Quantum Sensor Development & Innovation Metrics
5.3 Manufacturing & Production Metrics
5.4 AI & Quantum Computing Integration Metrics
6. Competitive Landscape
6.1 List of Major Companies, By Region
6.2 Market Share Analysis, By Region
6.3 Product Benchmarking
6.3.1 Product specifications and features
6.3.2 Pricing
6.4 Strategic Initiatives
6.4.1 Marketing and promotional activities
6.4.2 Distribution and Supply Chain Strategies
6.4.3 Expansion plans and new product launches
6.4.4 Strategic partnerships and collaborations
6.5 Technological Advancements
6.6 Market Positioning and Branding
7. Quantum Sensors Market Segmentation, By Product
7.1 Chapter Overview
7.2 Atomic Clocks
7.2.1 Atomic Clocks Market Trends Analysis (2020-2032)
7.2.2 Atomic Clocks Market Size Estimates and Forecasts to 2032 (USD MILLION)
7.3 Gravitational Sensors
7.3.1 Gravitational Sensors Market Trends Analysis (2020-2032)
7.3.2 Gravitational Sensors Market Size Estimates and Forecasts to 2032 (USD MILLION)
7.4 Photosynthetically Active Radiation (PAR)
7.4.1 Photosynthetically Active Radiation (PAR) Market Trends Analysis (2020-2032)
7.4.2 Photosynthetically Active Radiation (PAR) Market Size Estimates and Forecasts to 2032 (USD MILLION)
7.5 Quantum Magnetic Sensors
7.5.1 Quantum Magnetic Sensors Market Trends Analysis (2020-2032)
7.5.2 Quantum Magnetic Sensors Market Size Estimates and Forecasts to 2032 (USD MILLION)
7.6 Others
7.6.1 Others Market Trends Analysis (2020-2032)
7.6.2 Others Market Size Estimates and Forecasts to 2032 (USD MILLION)
8. Quantum Sensors Market Segmentation, By Application
8.1 Chapter Overview
8.2 Aerospace & Defense
8.2.1 Aerospace & Defense Market Trends Analysis (2020-2032)
8.2.2 Aerospace & Defense Market Size Estimates and Forecasts to 2032 (USD MILLION)
8.3 Automotive
8.3.1 Automotive Market Trends Analysis (2020-2032)
8.3.2 Automotive Market Size Estimates and Forecasts to 2032 (USD MILLION)
8.4 Oil & Gas
8.4.1 Oil & Gas Market Trends Analysis (2020-2032)
8.4.2 Oil & Gas Market Size Estimates and Forecasts to 2032 (USD MILLION)
8.5 Healthcare
8.5.1 Healthcare Market Trends Analysis (2020-2032)
8.5.2 Healthcare Market Size Estimates and Forecasts to 2032 (USD MILLION)
8.6 Other
8.6.1 Other Market Trends Analysis (2020-2032)
8.6.2 Other Market Size Estimates and Forecasts to 2032 (USD MILLION)
9. Regional Analysis
9.1 Chapter Overview
9.2 North America
9.2.1 Trends Analysis
9.2.2 North America Quantum Sensors Market Estimates and Forecasts, by Country (2020-2032) (USD MILLION)
9.2.3 North America Quantum Sensors Market Estimates and Forecasts, By Product (2020-2032) (USD MILLION)
9.2.4 North America Quantum Sensors Market Estimates and Forecasts, By Application (2020-2032) (USD MILLION)
9.2.5 USA
9.2.5.1 USA Quantum Sensors Market Estimates and Forecasts, By Product (2020-2032) (USD MILLION)
9.2.5.2 USA Quantum Sensors Market Estimates and Forecasts, By Application (2020-2032) (USD MILLION)
9.2.6 Canada
9.2.6.1 Canada Quantum Sensors Market Estimates and Forecasts, By Product (2020-2032) (USD MILLION)
9.2.6.2 Canada Quantum Sensors Market Estimates and Forecasts, By Application (2020-2032) (USD MILLION)
9.2.7 Mexico
9.2.7.1 Mexico Quantum Sensors Market Estimates and Forecasts, By Product (2020-2032) (USD MILLION)
9.2.7.2 Mexico Quantum Sensors Market Estimates and Forecasts, By Application (2020-2032) (USD MILLION)
9.3 Europe
9.3.1 Eastern Europe
9.3.1.1 Trends Analysis
9.3.1.2 Eastern Europe Quantum Sensors Market Estimates and Forecasts, by Country (2020-2032) (USD MILLION)
9.3.1.3 Eastern Europe Quantum Sensors Market Estimates and Forecasts, By Product (2020-2032) (USD MILLION)
9.3.1.4 Eastern Europe Quantum Sensors Market Estimates and Forecasts, By Application (2020-2032) (USD MILLION)
9.3.1.5 Poland
9.3.1.5.1 Poland Quantum Sensors Market Estimates and Forecasts, By Product (2020-2032) (USD MILLION)
9.3.1.5.2 Poland Quantum Sensors Market Estimates and Forecasts, By Application (2020-2032) (USD MILLION)
9.3.1.6 Romania
9.3.1.6.1 Romania Quantum Sensors Market Estimates and Forecasts, By Product (2020-2032) (USD MILLION)
9.3.1.6.2 Romania Quantum Sensors Market Estimates and Forecasts, By Application (2020-2032) (USD MILLION)
9.3.1.7 Hungary
9.3.1.7.1 Hungary Quantum Sensors Market Estimates and Forecasts, By Product (2020-2032) (USD MILLION)
9.3.1.7.2 Hungary Quantum Sensors Market Estimates and Forecasts, By Application (2020-2032) (USD MILLION)
9.3.1.8 turkey
9.3.1.8.1 Turkey Quantum Sensors Market Estimates and Forecasts, By Product (2020-2032) (USD MILLION)
9.3.1.8.2 Turkey Quantum Sensors Market Estimates and Forecasts, By Application (2020-2032) (USD MILLION)
9.3.1.9 Rest of Eastern Europe
9.3.1.9.1 Rest of Eastern Europe Quantum Sensors Market Estimates and Forecasts, By Product (2020-2032) (USD MILLION)
9.3.1.9.2 Rest of Eastern Europe Quantum Sensors Market Estimates and Forecasts, By Application (2020-2032) (USD MILLION)
9.3.2 Western Europe
9.3.2.1 Trends Analysis
9.3.2.2 Western Europe Quantum Sensors Market Estimates and Forecasts, by Country (2020-2032) (USD MILLION)
9.3.2.3 Western Europe Quantum Sensors Market Estimates and Forecasts, By Product (2020-2032) (USD MILLION)
9.3.2.4 Western Europe Quantum Sensors Market Estimates and Forecasts, By Application (2020-2032) (USD MILLION)
9.3.2.5 Germany
9.3.2.5.1 Germany Quantum Sensors Market Estimates and Forecasts, By Product (2020-2032) (USD MILLION)
9.3.2.5.2 Germany Quantum Sensors Market Estimates and Forecasts, By Application (2020-2032) (USD MILLION)
9.3.2.6 France
9.3.2.6.1 France Quantum Sensors Market Estimates and Forecasts, By Product (2020-2032) (USD MILLION)
9.3.2.6.2 France Quantum Sensors Market Estimates and Forecasts, By Application (2020-2032) (USD MILLION)
9.3.2.7 UK
9.3.2.7.1 UK Quantum Sensors Market Estimates and Forecasts, By Product (2020-2032) (USD MILLION)
9.3.2.7.2 UK Quantum Sensors Market Estimates and Forecasts, By Application (2020-2032) (USD MILLION)
9.3.2.8 Italy
9.3.2.8.1 Italy Quantum Sensors Market Estimates and Forecasts, By Product (2020-2032) (USD MILLION)
9.3.2.8.2 Italy Quantum Sensors Market Estimates and Forecasts, By Application (2020-2032) (USD MILLION)
9.3.2.9 Spain
9.3.2.9.1 Spain Quantum Sensors Market Estimates and Forecasts, By Product (2020-2032) (USD MILLION)
9.3.2.9.2 Spain Quantum Sensors Market Estimates and Forecasts, By Application (2020-2032) (USD MILLION)
9.3.2.10 Netherlands
9.3.2.10.1 Netherlands Quantum Sensors Market Estimates and Forecasts, By Product (2020-2032) (USD MILLION)
9.3.2.10.2 Netherlands Quantum Sensors Market Estimates and Forecasts, By Application (2020-2032) (USD MILLION)
9.3.2.11 Switzerland
9.3.2.11.1 Switzerland Quantum Sensors Market Estimates and Forecasts, By Product (2020-2032) (USD MILLION)
9.3.2.11.2 Switzerland Quantum Sensors Market Estimates and Forecasts, By Application (2020-2032) (USD MILLION)
9.3.2.12 Austria
9.3.2.12.1 Austria Quantum Sensors Market Estimates and Forecasts, By Product (2020-2032) (USD MILLION)
9.3.2.12.2 Austria Quantum Sensors Market Estimates and Forecasts, By Application (2020-2032) (USD MILLION)
9.3.2.13 Rest of Western Europe
9.3.2.13.1 Rest of Western Europe Quantum Sensors Market Estimates and Forecasts, By Product (2020-2032) (USD MILLION)
9.3.2.13.2 Rest of Western Europe Quantum Sensors Market Estimates and Forecasts, By Application (2020-2032) (USD MILLION)
9.4 Asia Pacific
9.4.1 Trends Analysis
9.4.2 Asia Pacific Quantum Sensors Market Estimates and Forecasts, by Country (2020-2032) (USD MILLION)
9.4.3 Asia Pacific Quantum Sensors Market Estimates and Forecasts, By Product (2020-2032) (USD MILLION)
9.4.4 Asia Pacific Quantum Sensors Market Estimates and Forecasts, By Application (2020-2032) (USD MILLION)
9.4.5 China
9.4.5.1 China Quantum Sensors Market Estimates and Forecasts, By Product (2020-2032) (USD MILLION)
9.4.5.2 China Quantum Sensors Market Estimates and Forecasts, By Application (2020-2032) (USD MILLION)
9.4.6 India
9.4.5.1 India Quantum Sensors Market Estimates and Forecasts, By Product (2020-2032) (USD MILLION)
9.4.5.2 India Quantum Sensors Market Estimates and Forecasts, By Application (2020-2032) (USD MILLION)
9.4.5 Japan
9.4.5.1 Japan Quantum Sensors Market Estimates and Forecasts, By Product (2020-2032) (USD MILLION)
9.4.5.2 Japan Quantum Sensors Market Estimates and Forecasts, By Application (2020-2032) (USD MILLION)
9.4.6 South Korea
9.4.6.1 South Korea Quantum Sensors Market Estimates and Forecasts, By Product (2020-2032) (USD MILLION)
9.4.6.2 South Korea Quantum Sensors Market Estimates and Forecasts, By Application (2020-2032) (USD MILLION)
9.4.7 Vietnam
9.4.7.1 Vietnam Quantum Sensors Market Estimates and Forecasts, By Product (2020-2032) (USD MILLION)
9.2.7.2 Vietnam Quantum Sensors Market Estimates and Forecasts, By Application (2020-2032) (USD MILLION)
9.4.8 Singapore
9.4.8.1 Singapore Quantum Sensors Market Estimates and Forecasts, By Product (2020-2032) (USD MILLION)
9.4.8.2 Singapore Quantum Sensors Market Estimates and Forecasts, By Application (2020-2032) (USD MILLION)
9.4.9 Australia
9.4.9.1 Australia Quantum Sensors Market Estimates and Forecasts, By Product (2020-2032) (USD MILLION)
9.4.9.2 Australia Quantum Sensors Market Estimates and Forecasts, By Application (2020-2032) (USD MILLION)
9.4.10 Rest of Asia Pacific
9.4.10.1 Rest of Asia Pacific Quantum Sensors Market Estimates and Forecasts, By Product (2020-2032) (USD MILLION)
9.4.10.2 Rest of Asia Pacific Quantum Sensors Market Estimates and Forecasts, By Application (2020-2032) (USD MILLION)
9.5 Middle East and Africa
9.5.1 Middle East
9.5.1.1 Trends Analysis
9.5.1.2 Middle East Quantum Sensors Market Estimates and Forecasts, by Country (2020-2032) (USD MILLION)
9.5.1.3 Middle East Quantum Sensors Market Estimates and Forecasts, By Product (2020-2032) (USD MILLION)
9.5.1.4 Middle East Quantum Sensors Market Estimates and Forecasts, By Application (2020-2032) (USD MILLION)
9.5.1.5 UAE
9.5.1.5.1 UAE Quantum Sensors Market Estimates and Forecasts, By Product (2020-2032) (USD MILLION)
9.5.1.5.2 UAE Quantum Sensors Market Estimates and Forecasts, By Application (2020-2032) (USD MILLION)
9.5.1.6 Egypt
9.5.1.6.1 Egypt Quantum Sensors Market Estimates and Forecasts, By Product (2020-2032) (USD MILLION)
9.5.1.6.2 Egypt Quantum Sensors Market Estimates and Forecasts, By Application (2020-2032) (USD MILLION)
9.5.1.7 Saudi Arabia
9.5.1.7.1 Saudi Arabia Quantum Sensors Market Estimates and Forecasts, By Product (2020-2032) (USD MILLION)
9.5.1.7.2 Saudi Arabia Quantum Sensors Market Estimates and Forecasts, By Application (2020-2032) (USD MILLION)
9.5.1.8 Qatar
9.5.1.8.1 Qatar Quantum Sensors Market Estimates and Forecasts, By Product (2020-2032) (USD MILLION)
9.5.1.8.2 Qatar Quantum Sensors Market Estimates and Forecasts, By Application (2020-2032) (USD MILLION)
9.5.1.9 Rest of Middle East
9.5.1.9.1 Rest of Middle East Quantum Sensors Market Estimates and Forecasts, By Product (2020-2032) (USD MILLION)
9.5.1.9.2 Rest of Middle East Quantum Sensors Market Estimates and Forecasts, By Application (2020-2032) (USD MILLION)
9.5.2 Africa
9.5.2.1 Trends Analysis
9.5.2.2 Africa Quantum Sensors Market Estimates and Forecasts, by Country (2020-2032) (USD MILLION)
9.5.2.3 Africa Quantum Sensors Market Estimates and Forecasts, By Product (2020-2032) (USD MILLION)
9.5.2.4 Africa Quantum Sensors Market Estimates and Forecasts, By Application (2020-2032) (USD MILLION)
9.5.2.5 South Africa
9.5.2.5.1 South Africa Quantum Sensors Market Estimates and Forecasts, By Product (2020-2032) (USD MILLION)
9.5.2.5.2 South Africa Quantum Sensors Market Estimates and Forecasts, By Application (2020-2032) (USD MILLION)
9.5.2.6 Nigeria
9.5.2.6.1 Nigeria Quantum Sensors Market Estimates and Forecasts, By Product (2020-2032) (USD MILLION)
9.5.2.6.2 Nigeria Quantum Sensors Market Estimates and Forecasts, By Application (2020-2032) (USD MILLION)
9.5.2.7 Rest of Africa
9.5.2.7.1 Rest of Africa Quantum Sensors Market Estimates and Forecasts, By Product (2020-2032) (USD MILLION)
9.5.2.7.2 Rest of Africa Quantum Sensors Market Estimates and Forecasts, By Application (2020-2032) (USD MILLION)
9.6 Latin America
9.6.1 Trends Analysis
9.6.2 Latin America Quantum Sensors Market Estimates and Forecasts, by Country (2020-2032) (USD MILLION)
9.6.3 Latin America Quantum Sensors Market Estimates and Forecasts, By Product (2020-2032) (USD MILLION)
9.6.4 Latin America Quantum Sensors Market Estimates and Forecasts, By Application (2020-2032) (USD MILLION)
9.6.5 Brazil
9.6.5.1 Brazil Quantum Sensors Market Estimates and Forecasts, By Product (2020-2032) (USD MILLION)
9.6.5.2 Brazil Quantum Sensors Market Estimates and Forecasts, By Application (2020-2032) (USD MILLION)
9.6.6 Argentina
9.6.6.1 Argentina Quantum Sensors Market Estimates and Forecasts, By Product (2020-2032) (USD MILLION)
9.6.6.2 Argentina Quantum Sensors Market Estimates and Forecasts, By Application (2020-2032) (USD MILLION)
9.6.7 Colombia
9.6.7.1 Colombia Quantum Sensors Market Estimates and Forecasts, By Product (2020-2032) (USD MILLION)
9.6.7.2 Colombia Quantum Sensors Market Estimates and Forecasts, By Application (2020-2032) (USD MILLION)
9.6.8 Rest of Latin America
9.6.8.1 Rest of Latin America Quantum Sensors Market Estimates and Forecasts, By Product (2020-2032) (USD MILLION)
9.6.8.2 Rest of Latin America Quantum Sensors Market Estimates and Forecasts, By Application (2020-2032) (USD MILLION)
10. Company Profiles
10.1 Andor Technology.
10.1.1 Company Overview
10.1.2 Financial
10.1.3 Products/ Services Offered
110.1.4 SWOT Analysis
10.2 D-Wave Systems
10.2.1 Company Overview
10.2.2 Financial
10.2.3 Products/ Services Offered
10.2.4 SWOT Analysis
10.3 Quantinuum
10.3.1 Company Overview
10.3.2 Financial
10.3.3 Products/ Services Offered
10.3.4 SWOT Analysis
10.4 Kistler Group
10.4.1 Company Overview
10.4.2 Financial
10.4.3 Products/ Services Offered
10.4.4 SWOT Analysis
10.5 QuantX Labs
10.5.1 Company Overview
10.5.2 Financial
10.5.3 Products/ Services Offered
10.5.4 SWOT Analysis
10.6 Xanadu Quantum Technologies.
10.6.1 Company Overview
10.6.2 Financial
10.6.3 Products/ Services Offered
10.6.4 SWOT Analysis
10.7 Uster Technologies.
10.7.1 Company Overview
10.7.2 Financial
10.7.3 Products/ Services Offered
10.7.4 SWOT Analysis
10.8 ID Quantique
10.8.1 Company Overview
10.8.2 Financial
10.8.3 Products/ Services Offered
10.8.4 SWOT Analysis
10.9 Qnami
10.9.1 Company Overview
10.9.2 Financial
10.9.3 Products/ Services Offered
10.9.4 SWOT Analysis
10.10 Muquans.
10.9.1 Company Overview
10.9.2 Financial
10.9.3 Products/ Services Offered
10.9.4 SWOT Analysis
11. Use Cases and Best Practices
12. Conclusion
An accurate research report requires proper strategizing as well as implementation. There are multiple factors involved in the completion of good and accurate research report and selecting the best methodology to compete the research is the toughest part. Since the research reports we provide play a crucial role in any company’s decision-making process, therefore we at SNS Insider always believe that we should choose the best method which gives us results closer to reality. This allows us to reach at a stage wherein we can provide our clients best and accurate investment to output ratio.
Each report that we prepare takes a timeframe of 350-400 business hours for production. Starting from the selection of titles through a couple of in-depth brain storming session to the final QC process before uploading our titles on our website we dedicate around 350 working hours. The titles are selected based on their current market cap and the foreseen CAGR and growth.
The 5 steps process:
Step 1: Secondary Research:
Secondary Research or Desk Research is as the name suggests is a research process wherein, we collect data through the readily available information. In this process we use various paid and unpaid databases which our team has access to and gather data through the same. This includes examining of listed companies’ annual reports, Journals, SEC filling etc. Apart from this our team has access to various associations across the globe across different industries. Lastly, we have exchange relationships with various university as well as individual libraries.

Step 2: Primary Research
When we talk about primary research, it is a type of study in which the researchers collect relevant data samples directly, rather than relying on previously collected data. This type of research is focused on gaining content specific facts that can be sued to solve specific problems. Since the collected data is fresh and first hand therefore it makes the study more accurate and genuine.
We at SNS Insider have divided Primary Research into 2 parts.
Part 1 wherein we interview the KOLs of major players as well as the upcoming ones across various geographic regions. This allows us to have their view over the market scenario and acts as an important tool to come closer to the accurate market numbers. As many as 45 paid and unpaid primary interviews are taken from both the demand and supply side of the industry to make sure we land at an accurate judgement and analysis of the market.
This step involves the triangulation of data wherein our team analyses the interview transcripts, online survey responses and observation of on filed participants. The below mentioned chart should give a better understanding of the part 1 of the primary interview.

Part 2: In this part of primary research the data collected via secondary research and the part 1 of the primary research is validated with the interviews from individual consultants and subject matter experts.
Consultants are those set of people who have at least 12 years of experience and expertise within the industry whereas Subject Matter Experts are those with at least 15 years of experience behind their back within the same space. The data with the help of two main processes i.e., FGDs (Focused Group Discussions) and IDs (Individual Discussions). This gives us a 3rd party nonbiased primary view of the market scenario making it a more dependable one while collation of the data pointers.
Step 3: Data Bank Validation
Once all the information is collected via primary and secondary sources, we run that information for data validation. At our intelligence centre our research heads track a lot of information related to the market which includes the quarterly reports, the daily stock prices, and other relevant information. Our data bank server gets updated every fortnight and that is how the information which we collected using our primary and secondary information is revalidated in real time.

Step 4: QA/QC Process
After all the data collection and validation our team does a final level of quality check and quality assurance to get rid of any unwanted or undesired mistakes. This might include but not limited to getting rid of the any typos, duplication of numbers or missing of any important information. The people involved in this process include technical content writers, research heads and graphics people. Once this process is completed the title gets uploader on our platform for our clients to read it.
Step 5: Final QC/QA Process:
This is the last process and comes when the client has ordered the study. In this process a final QA/QC is done before the study is emailed to the client. Since we believe in giving our clients a good experience of our research studies, therefore, to make sure that we do not lack at our end in any way humanly possible we do a final round of quality check and then dispatch the study to the client.
Key Segments:
By Product
Atomic Clocks
Gravitational Sensors
Photosynthetically Active Radiation (PAR)
Quantum Magnetic Sensors
Others
By Application
Aerospace & Defense
Automotive
Oil & Gas
Healthcare
Other
Request for Segment Customization as per your Business Requirement: Segment Customization Request
Regional Coverage:
North America
US
Canada
Mexico
Europe
Eastern Europe
Poland
Romania
Hungary
Turkey
Rest of Eastern Europe
Western Europe
Germany
France
UK
Italy
Spain
Netherlands
Switzerland
Austria
Rest of Western Europe
Asia Pacific
China
India
Japan
South Korea
Vietnam
Singapore
Australia
Rest of Asia Pacific
Middle East & Africa
Middle East
UAE
Egypt
Saudi Arabia
Qatar
Rest of Middle East
Africa
Nigeria
South Africa
Rest of Africa
Latin America
Brazil
Argentina
Colombia
Rest of Latin America
Request for Country Level Research Report: Country Level Customization Request
Available Customization
With the given market data, SNS Insider offers customization as per the company’s specific needs. The following customization options are available for the report:
Detailed Volume Analysis
Criss-Cross segment analysis (e.g. Product X Application)
Competitive Product Benchmarking
Geographic Analysis
Additional countries in any of the regions
Customized Data Representation
Detailed analysis and profiling of additional market players
The Low Voltage Switchgear Market Size was valued at USD 41.83 billion in 2023 and is expected to grow at 8.15% CAGR to reach USD 84.29 billion by 2032.
The Semiconductor Lead Frame Market Size was valued at USD 3.80 Billion in 2023 and is expected to grow at 6.12% CAGR to reach USD 6.47 Billion by 2032.
The mmWave Sensors and Modules Market Size was valued at USD 0.25 Billion in 2023 and is expected to reach USD 2.40 Billion, at a CAGR of 28.59% by 2024-2032
The Oil & Gas Variable Frequency Drives Market was valued at USD 3.57 billion in 2023 and is expected to reach USD 4.94 billion by 2032, growing at a CAGR of 3.71% over the forecast period 2024-2032.
The Interactive Voice Response Market was valued at USD 5.23 billion in 2023 and is projected to reach USD 8.99 billion by 2032, growing at a CAGR of 6.20% from 2024 to 2032.
The LED Chip Market size was valued at USD 28.81 billion in 2023. It is expected to grow to USD 78.01 billion by 2032 and grow at a CAGR of 11.7% over the forecast period of 2024-2032.

Hi! Click one of our member below to chat on Phone
© 2025 All Rights Reserved by SNS Insider Pvt Ltd


