To Get More Information on Protein A Resin Market - Request Sample Report
The Protein A Resin Market Size was valued at USD 1.34 billion in 2023, and is expected to reach USD 3.08 billion by 2032, and grow at a CAGR of 9.7% over the forecast period 2024-2032.
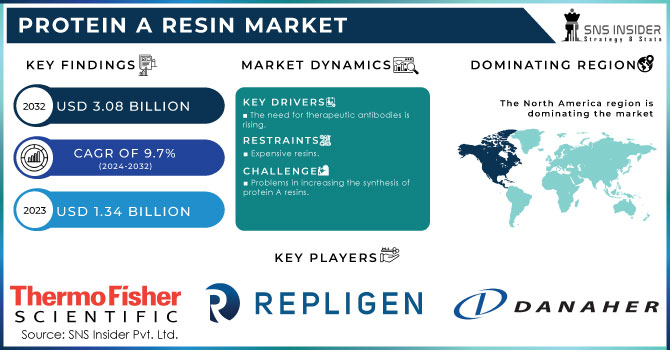
The latest research study includes market buying patterns, price analysis, patent analysis, conference and webinar materials, and industry trends. The market is expected to rise as a result of rising demand for protein-engineered products used in the creation of vaccines and treatments, as well as increased pharmaceutical industry R&D spending.
A low-cost thermophoretic aptasensor (TAS) is used to profile cancer-associated protein profiles of plasma EVs without the influence of soluble proteins, according to an NCBI article published in May 2021. This showed that protein analysis can distinguish between metastatic breast cancer, non-metastatic breast cancer, and healthy donors (HD) with a high accuracy of 91.2%. Therefore, research demonstrating the effectiveness of protein A resin in cancer diagnostics is anticipated to support market expansion.
Furthermore, the market is anticipated to expand as a result of the increased burden of chronic illnesses. In the United States, an estimated 2.1 million new instances of cancer were discovered. The research also noted that 400,000 kids worldwide are diagnosed with cancer each year. The most common form of prevalent in 23 nations, including South Africa, India, Eswatini, and others. Breast, lung, colon, rectum, and prostate cancers are the most prevalent types of cancer.
DRIVERS
The need for therapeutic antibodies is rising.
The monoclonal antibody (mAb) purification process must include chromatography. The need for monoclonal antibodies in cancer and various other therapeutic fields, such as neurological, autoimmune, and inflammatory illnesses, has significantly increased during the past ten years. The R&D of therapeutic antibodies is now a primary priority for practically all major pharmaceutical firms.
Chromatography is used to remove anionic contaminants, including nucleic acids and endotoxins, during the purification of monoclonal antibodies. This procedure uses a lot of resins in drug discovery applications since it is used not just for purification but also to examine how compounds interact with ions. Size-exclusion chromatography (SEC) is used to exclude impurities like albumin and transferrin. High amounts Protein-A affinity resins can be used to achieve various levels of purification. This occurs because antibodies and resins specifically bind protein A ligands. This should increase demand for protein.
RESTRAIN
Expensive resins.
About 5–10 times more expensive than other forms of resin are protein A resins. Despite the fact that protein A resins are the only approach that can reach the same level of purification, their expensive cost prompts end users to explore alternatives. Both chromatography and non-chromatography procedures are a few of the purification methods that offer respectable degrees of purity. As alternatives to protein A chromatography, mAb crystallisation and polyethylene glycol (PEG) precipitation are being investigated. In rising areas like Latin America and the Asia Pacific, this restraint is increasingly noticeable. However, the price of protein A resins is anticipated to drop dramatically with the introduction of new market participants. The pressure on key market participants is rising because
OPPORTUNITY
The number of CMOs and CROs is rising.
CHALLENGES
Problems in increasing the synthesis of protein A resins.
Trade restrictions, sanctions, and geopolitical conflicts may all affect trade patterns and cause them to shift. Companies who purchased protein A resin from producers in the impacted area could need to locate other sources, which might lead to changes in the market and volatility. Cost variations geopolitical conflicts can produce unpredictability and interruptions, which might result in price changes in the market for protein A resin globally. Prices may rise as a result of increased demand from businesses looking for different suppliers, particularly if there are few choices. Impact of Investment and Research Geopolitical conflicts may result in an unstable economic climate, which may deter investment and research in the area. This could have an impact on the creation of novel protein A resin-related goods and technology.
IMPACT OF ONGOING RECESSION
Reduced or Delayed Studying and Developing During a recession, biotechnology businesses may experience financial difficulties that cause them to cut back on their R&D investments. This might cause delays or reductions in the development of new biopharmaceutical drugs whose manufacturing methods rely on protein A resin. Price Disturbance The biopharmaceutical business may experience greater price sensitivity as a result of decreased demand and budgetary constraints. Customers may bargain for cheaper protein A resin costs, placing pressure on producers to change their pricing policies. Inventory Control In order to efficiently control expenses during a recession, businesses frequently concentrate on optimising their inventory levels. In order to prevent having too much stock and probable financial losses, this can cause protein A resin inventory purchases to decline.
consolidation of suppliers, a few smaller protein producers During a recession, a business can experience financial difficulties, which might cause market consolidation. Larger, more financially secure businesses could buy out failing rivals or suppliers, possibly changing the dynamics of the market.
By Product
Agarose based protein A resin
Glass/Silica based protein A resin
Organic Polymer based protein A resin
By Type
Recombinant protein A resin
Natural protein A resin
By Application
Antibody Purification
Immunoprecipitation
By End User
Pharmaceutical and biopharmaceutical companies
Academic Research institutes
Other end users
North America
US
Canada
Mexico
Europe
Eastern Europe
Poland
Romania
Hungary
Turkey
Rest of Eastern Europe
Western Europe
Germany
France
UK
Italy
Spain
Netherlands
Switzerland
Austria
Rest of Western Europe
Asia Pacific
China
India
Japan
South Korea
Vietnam
Singapore
Australia
Rest of Asia Pacific
Middle East & Africa
Middle East
UAE
Egypt
Saudi Arabia
Qatar
Rest of Middle East
Africa
Nigeria
South Africa
Rest of Africa
Latin America
Brazil
Argentina
Colombia
Rest of Latin America
REGIONAL ANALYSES
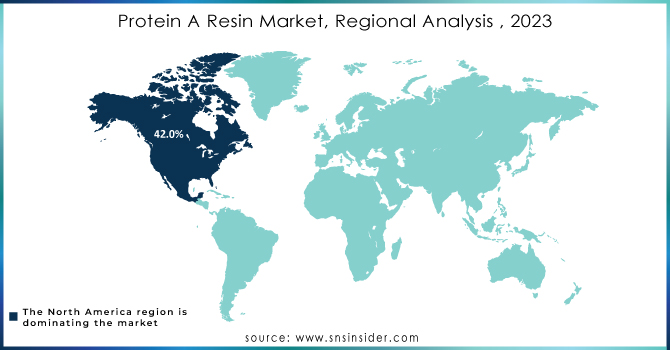
In 2023, North America led the sector and generated 42.0% of the total industry revenue. This is because there is an increasing need for protein-based medicines to treat infectious illnesses and because there are more pharmaceutical and biotechnology firms in this area that have received FDA approval. A rise in partnerships, mergers, and acquisitions among the major competitors is another factor driving the industry's expansion. In addition, both public and commercial organisations are working to advance healthcare research and development.
Asia-Pacific Protein The resin market is anticipated to see the highest rate of growth globally during the anticipated timeframe. Factors such as the biopharmaceutical industry's fast expansion, the rise in the number of businesses producing and developing biologics such as monoclonal antibodies, the size of the population, and rising Healthcare costs help the APAC market expand even more. Developing nations like China and India are becoming prominent biopharmaceutical industry key players who are luring investments, pushing up demand for Protein A resins, and stoking market expansion in APAC. The expanding number of legislative changes, improvements to healthcare infrastructure, and the expansion of the protein the resin market in the Asia-Pacific region is supported by rising research and development efforts.
Do You Need any Customization Research on Protein A Resin Market - Enquire Now
The major players are Danaher Corporation, Merck KGAa, Repligen Corporation, Thermo Fisher Scientific, Agilent Technologies, GenScript, PerkinEimer Inc., Bio-Rad Laboratories, Inc., Orochem Technologies Inc., Kaneka Corporation, Abcam Plc., Agarose Bead Technologies, Avantor, Inc., and others.
Purolite: In November 2022, With Repligen, a business that provided the bulk of Protein A ligands, Purolite stated that it has increased and extended its ligand supply relationship with them. Praesto Jetted A50 HipH, a new protein A resin that combines Purolite's base beads with Repligen's ligand technology, was created and commercialised as a result of the pre-existing cooperation.
Navigo Proteins GmbH: In June 2022, Affinity resin for the capture of the glycoprotein gp64, an unwanted contaminant from the baculovirus insect cell expression system, has been successfully developed, according to Navigo Proteins GmbH, a leading provider of affinity ligands for custom chromatography solutions.
Report Attributes | Details |
Market Size in 2023 | US$ 1.34 Bn |
Market Size by 2032 | US$ 3.08 Bn |
CAGR | CAGR of 9.7% From 2024 to 2032 |
Base Year | 2023 |
Forecast Period | 2024-2032 |
Historical Data | 2020-2022 |
Report Scope & Coverage | Market Size, Segments Analysis, Competitive Landscape, Regional Analysis, DROC & SWOT Analysis, Forecast Outlook |
Key Segments | • By product (Agarose based protein A resin, Glass/Silica based protein A resin, Organic Polymer based protein A resin) • By Type (Recombinant protein A resin, Natural protein A resin) • By Application (Antibody Purification, Immunoprecipitation) • By end user (Pharmaceutical and biopharmaceutical companies, Academic Research institutes, Other end users) |
Regional Analysis/Coverage | North America (US, Canada, Mexico), Europe (Eastern Europe [Poland, Romania, Hungary, Turkey, Rest of Eastern Europe] Western Europe] Germany, France, UK, Italy, Spain, Netherlands, Switzerland, Austria, Rest of Western Europe]). Asia Pacific (China, India, Japan, South Korea, Vietnam, Singapore, Australia, Rest of Asia Pacific), Middle East & Africa (Middle East [UAE, Egypt, Saudi Arabia, Qatar, Rest of Middle East], Africa [Nigeria, South Africa, Rest of Africa], Latin America (Brazil, Argentina, Colombia Rest of Latin America) |
Company Profiles | Danaher Corporation, Merck KGAa, Repligen Corporation, Thermo Fisher Scientific, Agilent Technologies, GenScript, PerkinEimer Inc., Bio-Rad Laboratories, Inc., Orochem Technologies Inc., Kaneka Corporation, Abcam Plc., Agarose Bead Technologies, Avantor, Inc. |
Key Drivers | • The need for therapeutic antibodies is rising. |
Market Restraints | • Expensive resins. |
Ans: Protein A Resin Market is anticipated to expand by 9.7% from 2024 to 2032.
Ans: USD 3.08 billion is expected to grow by 2032.
Ans: The top companies in the market for Protein A Resin Market are Danaher Corporation, Merck KGAa, Repligen Corporation, Thermo Fisher Scientific, Agilent Technologies.
Ans: Protein A Resin Market size was valued at USD 1.34 billion in 2023.
Ans: The primary determinant of the protein the need for disposable packed columns is rising, and other factors driving the resin market expansion include rising R&D costs, medicine research, drug discovery, and others.
TABLE OF CONTENTS
1. Introduction
1.1 Market Definition
1.2 Scope
1.3 Research Assumptions
2. Research Methodology
3. Market Dynamics
3.1 Drivers
3.2 Restraints
3.3 Opportunities
3.4 Challenges
4. Impact Analysis
4.1 Impact of the Ukraine- Russia War
4.2 Impact of Ongoing Recession
4.2.1 Introduction
4.2.2 Impact on major economies
4.2.2.1 US
4.2.2.2 Canada
4.2.2.3 Germany
4.2.2.4 France
4.2.2.5 United Kingdom
4.2.2.6 China
4.2.2.7 Japan
4.2.2.8 South Korea
4.2.2.9 Rest of the World
5. Value Chain Analysis
6. Porter’s 5 forces model
7. PEST Analysis
8. Protein A Resin Market Segmentation, By product
8.1 Agarose based protein A resin
8.2 Glass/Silica based protein A resin
8.3 Organic Polymer based protein A resin
9. Protein A Resin Market Segmentation, By Type
9.1 Recombinant protein A resin
9.2 Natural protein A resin
10. Protein A Resin Market Segmentation, By Application
10.1 Antibody Purification
10.2 Immunoprecipitation
11. Protein A Resin Market Segmentation, By end user
11.1 Pharmaceutical and biopharmaceutical companies
11.2 Academic Research Institutes
11.3 Other end users
12. Regional Analysis
12.1 Introduction
12.2 North America
12.2.1 North America Protein A Resin Market by Country
12.2.2North America Protein A Resin Market By Product
12.2.3 North America Protein A Resin Market By Type
12.2.4 North America Protein A Resin Market By Application
12.2.5 North America Protein A Resin Market By end user
12.2.6 USA
12.2.6.1 USA Protein A Resin Market By Product
12.2.6.2 USA Protein A Resin Market By Type
12.2.6.3 USA Protein A Resin Market By Application
12.2.6.4 USA Protein A Resin Market By end user
12.2.7 Canada
12.2.7.1 Canada Protein A Resin Market By Product
12.2.7.2 Canada Protein A Resin Market By Type
12.2.7.3 Canada Protein A Resin Market By Application
12.2.7.4 Canada Protein A Resin Market By end user
12.2.8 Mexico
12.2.8.1 Mexico Protein A Resin Market By Product
12.2.8.2 Mexico Protein A Resin Market By Type
12.2.8.3 Mexico Protein A Resin Market By Application
12.2.8.4 Mexico Protein A Resin Market by End user
12.3 Europe
12.3.1 Eastern Europe
12.3.1.1 Eastern Europe Protein A Resin Market by Country
12.3.1.2 Eastern Europe Protein A Resin Market By Product
12.3.1.3 Eastern Europe Protein A Resin Market By Type
12.3.1.4 Eastern Europe Protein A Resin Market By Application
12.3.1.5 Eastern Europe Protein A Resin Market By end user
12.3.1.6 Poland
12.3.1.6.1 Poland Protein A Resin Market By Product
12.3.1.6.2 Poland Protein A Resin Market By Type
12.3.1.6.3 Poland Protein A Resin Market By Application
12.3.1.6.4 Poland Protein A Resin Market By end user
12.3.1.7 Romania
12.3.1.7.1 Romania Protein A Resin Market By Product
12.3.1.7.2 Romania Protein A Resin Market By Type
12.3.1.7.3 Romania Protein A Resin Market By Application
12.3.1.7.4 Romania Protein A Resin Market By end user
12.3.1.8 Hungary
12.3.1.8.1 Hungary Protein A Resin Market By Product
12.3.1.8.2 Hungary Protein A Resin Market By Type
12.3.1.8.3 Hungary Protein A Resin Market By Application
12.3.1.8.4 Hungary Protein A Resin Market By end user
12.3.1.9 Turkey
12.3.1.9.1 Turkey Protein A Resin Market By Product
12.3.1.9.2 Turkey Protein A Resin Market By Type
12.3.1.9.3 Turkey Protein A Resin Market By Application
12.3.1.9.4 Turkey Protein A Resin Market By end user
12.3.1.10 Rest of Eastern Europe
12.3.1.10.1 Rest of Eastern Europe Protein A Resin Market By Product
12.3.1.10.2 Rest of Eastern Europe Protein A Resin Market By Type
12.3.1.10.3 Rest of Eastern Europe Protein A Resin Market By Application
12.3.1.10.4 Rest of Eastern Europe Protein A Resin Market By end user
12.3.2 Western Europe
12.3.2.1 Western Europe Protein A Resin Market by Country
12.3.2.2 Western Europe Protein A Resin Market By Product
12.3.2.3 Western Europe Protein A Resin Market By Type
12.3.2.4 Western Europe Protein A Resin Market By Application
12.3.2.5 Western Europe Protein A Resin Market By end user
12.3.2.6 Germany
12.3.2.6.1 Germany Protein A Resin Market By Product
12.3.2.6.2 Germany Protein A Resin Market By Type
12.3.2.6.3 Germany Protein A Resin Market By Application
12.3.2.6.4 Germany Protein A Resin Market By end user
12.3.2.7 France
12.3.2.7.1 France Protein A Resin Market By Product
12.3.2.7.2 France Protein A Resin Market By Type
12.3.2.7.3 France Protein A Resin Market By Application
12.3.2.7.4 France Protein A Resin Market By end user
12.3.2.8 UK
12.3.2.8.1 UK Protein A Resin Market By Product
12.3.2.8.2 UK Protein A Resin Market By Type
12.3.2.8.3 UK Protein A Resin Market By Application
12.3.2.8.4 UK Protein A Resin Market By end user
12.3.2.9 Italy
12.3.2.9.1 Italy Protein A Resin Market By Product
12.3.2.9.2 Italy Protein A Resin Market By Type
12.3.2.9.3 Italy Protein A Resin Market By Application
12.3.2.9.4 Italy Protein A Resin Market By end user
12.3.2.10 Spain
12.3.2.10.1 Spain Protein A Resin Market By Product
12.3.2.10.2 Spain Protein A Resin Market By Type
12.3.2.10.3 Spain Protein A Resin Market By Application
12.3.2.10.4 Spain Protein A Resin Market By end user
12.3.2.11 Netherlands
12.3.2.11.1 Netherlands Protein A Resin Market By Product
12.3.2.11.2 Netherlands Protein A Resin Market By Type
12.3.2.11.3 Netherlands Protein A Resin Market By Application
12.3.2.11.4 Netherlands Protein A Resin Market By end user
12.3.2.12 Switzerland
12.3.2.12.1 Switzerland Protein A Resin Market By Product
12.3.2.12.2 Switzerland Protein A Resin Market By Type
12.3.2.12.3 Switzerland Protein A Resin Market By Application
12.3.2.12.4 Switzerland Protein A Resin Market By end user
12.3.2.13 Austria
12.3.2.13.1 Austria Protein A Resin Market By Product
12.3.2.13.2 Austria Protein A Resin Market By Type
12.3.2.13.3 Austria Protein A Resin Market By Application
12.3.2.13.4 Austria Protein A Resin Market By end user
12.3.2.14 Rest of Western Europe
12.3.2.14.1 Rest of Western Europe Protein A Resin Market By Product
12.3.2.14.2 Rest of Western Europe Protein A Resin Market By Type
12.3.2.14.3 Rest of Western Europe Protein A Resin Market By Application
12.3.2.14.4 Rest of Western Europe Protein A Resin Market By end user
12.4 Asia-Pacific
12.4.1 Asia Pacific Protein A Resin Market by Country
12.4.2 Asia Pacific Protein A Resin Market By Product
12.4.3 Asia Pacific Protein A Resin Market By Type
12.4.4 Asia Pacific Protein A Resin Market By Application
12.4.5 Asia Pacific Protein A Resin Market By end user
12.4.6 China
12.4.6.1 China Protein A Resin Market By Product
12.4.6.2 China Protein A Resin Market By Type
12.4.6.3 China Protein A Resin Market By Application
12.4.6.4 China Protein A Resin Market By end user
12.4.7 India
12.4.7.1 India Protein A Resin Market By Product
12.4.7.2 India Protein A Resin Market By Type
12.4.7.3 India Protein A Resin Market By Application
12.4.7.4 India Protein A Resin Market By end user
12.4.8 Japan
12.4.8.1 Japan Protein A Resin Market By Product
12.4.8.2 Japan Protein A Resin Market By Type
12.4.8.3 Japan Protein A Resin Market By Application
12.4.8.4 Japan Protein A Resin Market By end user
12.4.9 South Korea
12.4.9.1 South Korea Protein A Resin Market By Product
12.4.9.2 South Korea Protein A Resin Market By Type
12.4.9.3 South Korea Protein A Resin Market By Application
12.4.9.4 South Korea Protein A Resin Market By end user
12.4.10 Vietnam
12.4.10.1 Vietnam Protein A Resin Market By Product
12.4.10.2 Vietnam Protein A Resin Market By Type
12.4.10.3 Vietnam Protein A Resin Market By Application
12.4.10.4 Vietnam Protein A Resin Market By end user
12.4.11 Singapore
12.4.11.1 Singapore Protein A Resin Market By Product
12.4.11.2 Singapore Protein A Resin Market By Type
12.4.11.3 Singapore Protein A Resin Market By Application
12.4.11.4 Singapore Protein A Resin Market By end user
12.4.12 Australia
12.4.12.1 Australia Protein A Resin Market By Product
12.4.12.2 Australia Protein A Resin Market By Type
12.4.12.3 Australia Protein A Resin Market By Application
12.4.12.4 Australia Protein A Resin Market By end user
12.4.13 Rest of Asia-Pacific
12.4.13.1 Rest of Asia-Pacific Protein A Resin Market By Product
12.4.13.2 Rest of Asia-Pacific Protein A Resin Market By Type
12.4.13.3 Rest of Asia-Pacific Protein A Resin Market By Application
12.4.13.4 Rest of Asia-Pacific Protein A Resin Market By end user
12.5 Middle East & Africa
12.5.1 Middle East
12.5.1.1 Middle East Protein A Resin Market by country
12.5.1.2 Middle East Protein A Resin Market By Product
12.5.1.3 Middle East Protein A Resin Market By Type
12.5.1.4 Middle East Protein A Resin Market By Application
12.5.1.5 Middle East Protein A Resin Market By end user
12.5.1.6 UAE
12.5.1.6.1 UAE Protein A Resin Market By Product
12.5.1.6.2 UAE Protein A Resin Market By Type
12.5.1.6.3 UAE Protein A Resin Market By Application
12.5.1.6.4 UAE Protein A Resin Market By end user
12.5.1.7 Egypt
12.5.1.7.1 Egypt Protein A Resin Market By Product
12.5.1.7.2 Egypt Protein A Resin Market By Type
12.5.1.7.3 Egypt Protein A Resin Market By Application
12.5.1.7.4 Egypt Protein A Resin Market By end user
12.5.1.8 Saudi Arabia
12.5.1.8.1 Saudi Arabia Protein A Resin Market By Product
12.5.1.8.2 Saudi Arabia Protein A Resin Market By Type
12.5.1.8.3 Saudi Arabia Protein A Resin Market By Application
12.5.1.8.4 Saudi Arabia Protein A Resin Market By end user
12.5.1.9 Qatar
12.5.1.9.1 Qatar Protein A Resin Market By Product
12.5.1.9.2 Qatar Protein A Resin Market By Type
12.5.1.9.3 Qatar Protein A Resin Market By Application
12.5.1.9.4 Qatar Protein A Resin Market By end user
12.5.1.10 Rest of Middle East
12.5.1.10.1 Rest of Middle East Protein A Resin Market By Product
12.5.1.10.2 Rest of Middle East Protein A Resin Market By Type
12.5.1.10.3 Rest of Middle East Protein A Resin Market By Application
12.5.1.10.4 Rest of Middle East Protein A Resin Market By end user
12.5.2. Africa
12.5.2.1 Africa Protein A Resin Market by country
12.5.2.2 Africa Protein A Resin Market By Product
12.5.2.3 Africa Protein A Resin Market By Type
12.5.2.4 Africa Protein A Resin Market By Application
12.5.2.5 Africa Protein A Resin Market By end user
12.5.2.6 Nigeria
12.5.2.6.1 Nigeria Protein A Resin Market By Product
12.5.2.6.2 Nigeria Protein A Resin Market By Type
12.5.2.6.3 Nigeria Protein A Resin Market By Application
12.5.2.6.4 Nigeria Protein A Resin Market By end user
12.5.2.7 South Africa
12.5.2.7.1 South Africa Protein A Resin Market By Product
12.5.2.7.2 South Africa Protein A Resin Market By Type
12.5.2.7.3 South Africa Protein A Resin Market By Application
12.5.2.7.4 South Africa Protein A Resin Market By end user
12.5.2.8 Rest of Africa
12.5.2.8.1 Rest of Africa Protein A Resin Market By Product
12.5.2.8.2 Rest of Africa Protein A Resin Market By Type
12.5.2.8.3 Rest of Africa Protein A Resin Market By Application
12.5.2.8.4 Rest of Africa Protein A Resin Market By end user
12.6. Latin America
12.6.1 Latin America Protein A Resin Market by country
12.6.2 Latin America Protein A Resin Market By Product
12.6.3 Latin America Protein A Resin Market By Type
12.6.4 Latin America Protein A Resin Market By Application
12.6.5 Latin America Protein A Resin Market By end user
12.6.6 Brazil
12.6.6.1 Brazil Protein A Resin Market By Product
12.6.6.2 Brazil Protein A Resin Market By Type
12.6.6.3 Brazil Protein A Resin Market By Application
12.6.6.4 Brazil Protein A Resin Market By end user
12.6.7 Argentina
12.6.7.1 Argentina Protein A Resin Market By Product
12.6.7.2 Argentina Protein A Resin Market By Type
12.6.7.3 Argentina Protein A Resin Market By Application
12.6.7.4 Argentina Protein A Resin Market By end user
12.6.8 Colombia
12.6.8.1 Colombia Protein A Resin Market By Product
12.6.8.2 Colombia Protein A Resin Market By Type
12.6.8.3 Colombia Protein A Resin Market By Application
12.6.8.4 Colombia Protein A Resin Market By end user
12.6.9 Rest of Latin America
12.6.9.1 Rest of Latin America Protein A Resin Market By Product
12.6.9.2 Rest of Latin America Protein A Resin Market By Type
12.6.9.3 Rest of Latin America Protein A Resin Market By Application
12.6.9.4 Rest of Latin America Protein A Resin Market By end user
13 Company Profile
13.1 Danaher Corporation.
13.1.1 Company Overview
13.1.2 Financials
13.1.3 Products/ Services Offered
13.1.4 SWOT Analysis
13.1.5 The SNS View
13.2 Merck KGAa.
13.2.1 Company Overview
13.2.2 Financials
13.2.3 Products/ Services Offered
13.2.4 SWOT Analysis
13.2.5 The SNS View
13.3 Repligen Corporation.
13.3.1 Company Overview
13.3.2 Financials
13.3.3 Products/ Services Offered
13.3.4 SWOT Analysis
13.3.5 The SNS View
13.4 Thermo Fisher Scientific.
13.4 Company Overview
13.4.2 Financials
13.4.3 Products/ Services Offered
13.4.4 SWOT Analysis
13.4.5 The SNS View
13.5 Agilent Technologies.
13.5.1 Company Overview
13.5.2 Financials
13.5.3 Products/ Services Offered
13.5.4 SWOT Analysis
13.5.5 The SNS View
13.6 GenScript.
13.6.1 Company Overview
13.6.2 Financials
13.6.3 Products/ Services Offered
13.6.4 SWOT Analysis
13.6.5 The SNS View
13.7 PerkinEimer Inc.
13.7.1 Company Overview
13.7.2 Financials
13.7.3 Products/ Services Offered
13.7.4 SWOT Analysis
13.7.5 The SNS View
13.8 Bio-Rad Laboratories, Inc.
13.8.1 Company Overview
13.8.2 Financials
13.8.3 Products/ Services Offered
13.8.4 SWOT Analysis
13.8.5 The SNS View
13.9 Orochem Technologies Inc.
13.9.1 Company Overview
13.9.2 Financials
13.9.3 Products/ Services Offered
13.9.4 SWOT Analysis
13.9.5 The SNS View
13.10 Kaneka Corporation.
13.10.1 Company Overview
13.10.2 Financials
13.10.3 Products/ Services Offered
13.10.4 SWOT Analysis
13.10.5 The SNS View
14. Competitive Landscape
14.1 Competitive Benchmarking
14.2 Market Share Analysis
14.3 Recent Developments
14.3.1 Industry News
14.3.2 Company News
14.3.3 Mergers & Acquisitions
15. USE Cases and Best Practices
16. Conclusion
An accurate research report requires proper strategizing as well as implementation. There are multiple factors involved in the completion of good and accurate research report and selecting the best methodology to compete the research is the toughest part. Since the research reports we provide play a crucial role in any company’s decision-making process, therefore we at SNS Insider always believe that we should choose the best method which gives us results closer to reality. This allows us to reach at a stage wherein we can provide our clients best and accurate investment to output ratio.
Each report that we prepare takes a timeframe of 350-400 business hours for production. Starting from the selection of titles through a couple of in-depth brain storming session to the final QC process before uploading our titles on our website we dedicate around 350 working hours. The titles are selected based on their current market cap and the foreseen CAGR and growth.
The 5 steps process:
Step 1: Secondary Research:
Secondary Research or Desk Research is as the name suggests is a research process wherein, we collect data through the readily available information. In this process we use various paid and unpaid databases which our team has access to and gather data through the same. This includes examining of listed companies’ annual reports, Journals, SEC filling etc. Apart from this our team has access to various associations across the globe across different industries. Lastly, we have exchange relationships with various university as well as individual libraries.
Step 2: Primary Research
When we talk about primary research, it is a type of study in which the researchers collect relevant data samples directly, rather than relying on previously collected data. This type of research is focused on gaining content specific facts that can be sued to solve specific problems. Since the collected data is fresh and first hand therefore it makes the study more accurate and genuine.
We at SNS Insider have divided Primary Research into 2 parts.
Part 1 wherein we interview the KOLs of major players as well as the upcoming ones across various geographic regions. This allows us to have their view over the market scenario and acts as an important tool to come closer to the accurate market numbers. As many as 45 paid and unpaid primary interviews are taken from both the demand and supply side of the industry to make sure we land at an accurate judgement and analysis of the market.
This step involves the triangulation of data wherein our team analyses the interview transcripts, online survey responses and observation of on filed participants. The below mentioned chart should give a better understanding of the part 1 of the primary interview.
Part 2: In this part of primary research the data collected via secondary research and the part 1 of the primary research is validated with the interviews from individual consultants and subject matter experts.
Consultants are those set of people who have at least 12 years of experience and expertise within the industry whereas Subject Matter Experts are those with at least 15 years of experience behind their back within the same space. The data with the help of two main processes i.e., FGDs (Focused Group Discussions) and IDs (Individual Discussions). This gives us a 3rd party nonbiased primary view of the market scenario making it a more dependable one while collation of the data pointers.
Step 3: Data Bank Validation
Once all the information is collected via primary and secondary sources, we run that information for data validation. At our intelligence centre our research heads track a lot of information related to the market which includes the quarterly reports, the daily stock prices, and other relevant information. Our data bank server gets updated every fortnight and that is how the information which we collected using our primary and secondary information is revalidated in real time.
Step 4: QA/QC Process
After all the data collection and validation our team does a final level of quality check and quality assurance to get rid of any unwanted or undesired mistakes. This might include but not limited to getting rid of the any typos, duplication of numbers or missing of any important information. The people involved in this process include technical content writers, research heads and graphics people. Once this process is completed the title gets uploader on our platform for our clients to read it.
Step 5: Final QC/QA Process:
This is the last process and comes when the client has ordered the study. In this process a final QA/QC is done before the study is emailed to the client. Since we believe in giving our clients a good experience of our research studies, therefore, to make sure that we do not lack at our end in any way humanly possible we do a final round of quality check and then dispatch the study to the client.
The U.S. Healthcare Payer Services Market Size was valued at USD 34.29 Billion in 2023 and is witness to reach USD 65.31 Billion by 2032 and grow at a CAGR of 7.74% over the forecast period 2024-2032.
The Oligonucleotide Synthesis Market size was estimated at USD 3.67 billion in 2023 and is expected to reach USD 11.21 billion by 2032 at a CAGR of 13.22% during the forecast period of 2024-2032.
The Proteomics Market Size was valued at USD 30.61 billion in 2023 and is expected to reach USD 96.35 Billion by 2032, growing at a CAGR of 13.61% from 2024-2032.
The 3D printed wearables market is valued at USD 3.96 billion in 2022, and it is estimated to increase at a CAGR of 9.7% from 2022 to 2028, reaching USD 8.30 billion by 2030.
Pharmaceutical Gelatin Market was valued at USD 1.69 billion in 2023 & is expected to reach USD 2.79 billion by 2032, growing at a CAGR of 5.77% from 2024-2032.
The Automated Liquid Handling Technologies Market Size was valued at USD 2.11 Billion in 2023 and is expected to reach USD 5.24 Billion by 2032 and grow at a CAGR of 11.18% over the forecast period 2024-2032.
Hi! Click one of our member below to chat on Phone