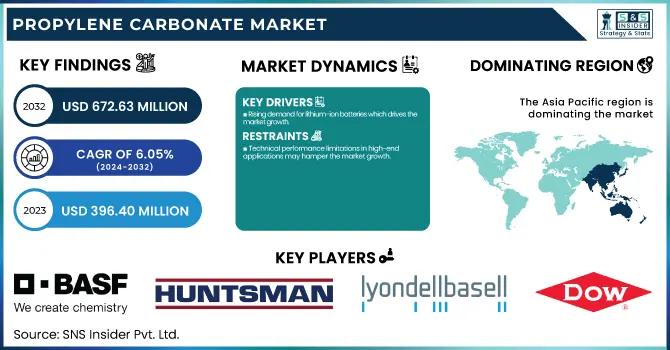
The Propylene Carbonate Market size was USD 396.40 Million in 2023 and is expected to reach USD 672.63 Million by 2032 and grow at a CAGR of 6.05 % over the forecast period of 2024-2032. The propylene carbonate market report provides a comprehensive analysis of production capacity and utilization rates across key countries, highlighting China and the U.S. as dominant producers. It examines feedstock price trends, particularly fluctuations in propylene oxide costs due to supply chain and energy market dynamics. The report also explores the regulatory landscape, including EU REACH compliance and U.S. EPA VOC restrictions, shaping market demand. Sustainability metrics, such as emission control and waste management initiatives, are assessed, with a focus on bio-based innovations in Asia-Pacific and Europe. Additionally, the report covers R&D advancements, emphasizing high-purity propylene carbonate for lithium-ion batteries and digital adoption trends in supply chain optimization.
To Get more information on Propylene Carbonate Market - Request Free Sample Report
Drivers
Rising demand for lithium-ion batteries which drives the market growth.
An increase in Lithium-ion battery adoption is one of the key drivers for the propylene carbonate market since it is an essential electrolyte solvent in battery formulations. The swift growth of electric vehicles (EVs), portable electronics, and renewable energy storage systems has created an urgent need for fast and stable electrolyte solutions. Propylene carbonate is an ideal material for advanced lithium-ion batteries due to its unique properties that can promote battery performance, and improve thermal stability and ion conductivity. Also, support for clean energy and electric mobility through government incentives and regulations, especially in China, the US, and Europe, is having a positive impact on market growth. Taking into account the rising need for higher usage of propylene carbonate-based electrolytes for battery performance and lifespan improvements, major battery makers including LG Energy Solution and CATL are rapidly investing in high-purity propylene carbonate-based electrolytes, thus bolstering demand in the market.
Restraint
Technical performance limitations in high-end applications may hamper the market growth.
The high-end applications that propylene carbonate is equipped for tend to be limited by its technical performance, especially in lithium-ion batteries, high-performance coatings, and certain industrial processes. Although propylene carbonate is appreciated for low volatility, high solvency power, and environmentally friendly nature, it suffers from poor thermal stability and conductivity which are important in application areas such as energy storage and advanced coatings. Ignoring the common use of these electrolytes might lead to limited battery life, as we already know that lithium-ion batteries, for example, propylene carbonate can decompose at high voltages, destabilizing the electrodes and shortening the life of the battery. As stated, its evaporation rate is lower than ethylene carbonate, which can affect drying times and film uniformity in high-performance coatings and electronics.
Opportunity
Growing adoption of carbon capture technologies creates an opportunity in the market.
Increasing use of carbon capture technologies provides a huge opportunity for the propylene carbonate industry as the global industrial & government sector is currently focused on cutting greenhouse gas emissions. As a highly efficient solvent for CO₂ absorption and capture during the industrial process, propylene carbonate is a classic example of a solvent for carbon capture and utilization (CCU). As more and more carbon capture projects get implemented across sectors like power, cement, and chemicals, the need to have CO₂-absorbing solvents that are both efficient and stable will increase. Furthermore, government incentives and carbon tax regulations in Europe and North America are also stimulating investment in sustainable carbon sequestration methods that help bolster the growth of this market. Formulations based on propylene carbonate, the focus of much R&D, exhibit improved CO₂ absorption capacity as well, and might prove a contender for one of the latter generations that will work towards alleviating climate change.
Challenges
Scaling up bio-based production may create a challenge for the market.
The difficulties in scaling up bio-based production with high production costs, limited raw material availability, and technical hurdles, are major restraints for its propylene carbonate market. Though the trend towards sustainable and bio-based chemicals has rapidly developed in recent years, bio-based propylene carbonate is still early in its commercial production. Catalytic processes with expensive and lower yield than petrochemical catalysts have been developed to convert biomass-derived glycerol or CO₂ to propylene carbonate. Besides, the variations in the availability of raw materials, especially in biodiesel-derived glycerol, influence the stability of the bio-based industry. The investment in research, infrastructure, and process improvement needed to scale these out to an industrial capability can be difficult for many small and mid-sized players to absorb. The transition to bio-based propylene carbonate will not make its commercial shift to high-volume markets without the influence of strong regulatory incentives, subsidies, or technological breakthroughs to drive it in the short term, but remains possible in the long term.
By Application
The solvent held the largest market share around 32% in 2023. It is due to its high utilization in paints & coatings, lithium-ion batteries, pharmaceuticals, and personal care products. Propylene carbonates a green solvent with low toxicity, high solvency power, and high compatibility with many formulations, is a high-performance solvent. It is used in the paints & coatings industry and is favored for dissolving resins and pigments and low emissions of volatile organic compound (VOC) into the atmosphere, making it suitable for strict environmental regulations. Furthermore, propylene carbonate is known as a key electrolytic solvent used in lithium-ion batteries, and demand for this type is expected to increase with the expansion of electric vehicles (EVs) and renewable energy storage systems.
By End User
Paints & Coatings held the largest market share around 25% in 2023. As a high-demand solvent for industrial, automotive & architectural coatings, propylene carbonate is a green and high-performance solvent, this makes the segment a major contributor to the propylene carbonate market in terms of volume. Propylene carbonate has a well-established reputation for its low volatility, and extremely high solvency power to dissolve resins, pigments, and additives for both smooth application and enhanced overall coating performance. As regulations tighten on volatile organic compounds (VOCs) and environmental regulations become increasingly stringent, industries are opting for low-VOC and green solvents, which is driving the growth of propylene carbonate. Moreover, increasing infrastructural activities, urbanization, and industrialization in major economies, especially in the Asia-Pacific and North America, are driving the growth of demand for high-performance coatings in construction, automotive refinishing, and protective coatings.
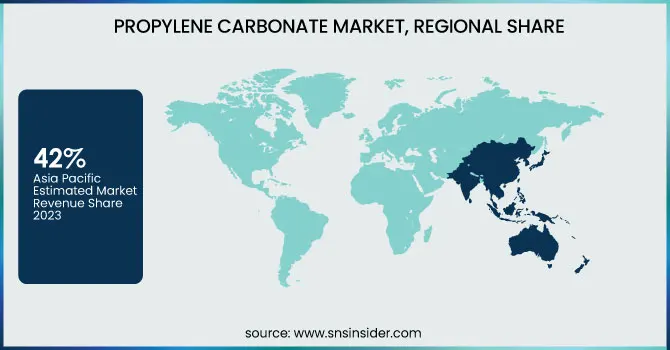
Asia Pacific held the largest market share around 42% in 2023. It is owing to the strong industry base and high urbanization and development of end-use industries such as paints & coatings, lithium-ion batteries, and personal care. This region contributes majorly to the global output of chemical manufacture with chemical manufacturing hubs established in the countries of China, India, Japan, and South Korea where propylene carbonate is a key solvent, electrolyte, and intermediate; hence, boosting the propylene carbonate market forward in the Asia Pacific region. Propylene carbonate is one of the most crucial solvents for electrolytes in Lithium-ion batteries, and thus the increasing demand from the flourishing electric vehicle (EV) sector, especially in China, has been a primary factor for propylene carbonate market growth. In addition, the booming construction and automotive sector in Asia pacific is generating a high demand for high-performance coatings and adhesives which propylene carbonate significantly fulfil. Coupled with moderate government policies as well as investors seeking low-cost production, it strengthens market growth in the region for profitable sustainable chemical solutions. Asia Pacific remains the top region in the global propylene carbonate market, driven by high consumption levels, rising industrial activities and technology innovations.
North America held a significant market share in 2023. It is due to the presence of an established chemical industry in the region, coupled with the increasing demand for lithium-ion batteries and high environmental regulations for low-VOC solvents. Due to fast-growing demands in the electric vehicle (EV) market and energy storage systems in particular in the U.S. and Canada, the production of propylene carbonate, an important electrolyte solvent, is expected to increase in North America. On the other hand, the ongoing construction activities on top the regional paints & coatings industry which Islamic Provides good stimuli from construction, automotive refinishing and industrial also help to push up the consumption. Due to strict environmental policies in North America like that of the Environmental Protection Agency (EPA), a shift towards green and bio-degradable solvents is imminent which will favor propylene carbonate as a solvent of choice.
Get Customized Report as per Your Business Requirement - Enquiry Now
Key Players
BASF SE (PC Pure, Solvenon PC)
Huntsman Corporation (Jeffsol PC, Ultrapure PC)
LyondellBasell Industries (Propylene Carbonate Industrial, PC Ultra)
Dow Inc. (PC-100, UCON Solvent PC)
Lotte Chemical Corporation (Lotte PC, High-Purity PC)
Shandong Shida Shenghua Chemical Group Co., Ltd. (Shenghua PC, Shida Solvent PC)
Shandong Depu Chemical Industry Science & Technology Co., Ltd. (Depu PC-99, Industrial PC)
Hi-Tech Chemicals Co., Ltd. (Hi-Tech PC, Battery-Grade PC)
Shandong Haike Chemical Group (Haike PC, Ultra-Pure PC)
Lixing Chemical (Lixing PC, High-Purity PC Solvent)
Nippon Chemical Industrial Co., Ltd. (NCIC PC, Nippon Pure PC)
Eastman Chemical Company (Eastman PC, Technical Grade PC)
Mitsubishi Chemical Corporation (MCC PC, Battery-Grade Solvent PC)
Jiangsu Aoke Chemical Co., Ltd. (Aoke PC, Electronic Grade PC)
Repsol S.A. (Repsol PC, High-Performance PC)
Merck KGaA (Merck Solvent PC, Ultra-Pure Battery PC)
Shandong Wells Chemicals Co., Ltd. (Wells PC, High-Purity PC)
Hangzhou Dayangchem Co., Ltd. (Dayangchem PC, Chemical-Grade PC)
Iolitec Ionic Liquids Technologies GmbH (Iolitec PC, Ionic Solvent PC)
Haihang Industry Co., Ltd. (Haihang PC, Technical Solvent PC)
Recent Development:
In 2023, Tesla partnered with Eastman Chemical to enhance sustainable material adoption in its supply chain, focusing on low-carbon and recycled chemicals like propylene carbonate for battery applications. This collaboration aligns with Tesla’s goal of reducing its carbon footprint in EV production.
In 2022, Rare Beauty launched a new liquid blush collection, incorporating propylene carbonate as a key ingredient for its smooth texture and enhanced solubility. This ingredient helps improve product consistency and application, making the blush more blendable and long-lasting.
| Report Attributes | Details |
|---|---|
| Market Size in 2023 | USD 396.40 Million |
| Market Size by 2032 | USD 672.63 Million |
| CAGR | CAGR of6.05% From 2024 to 2032 |
| Base Year | 2023 |
| Forecast Period | 2024-2032 |
| Historical Data | 2020-2022 |
| Report Scope & Coverage | Market Size, Segments Analysis, Competitive Landscape, Regional Analysis, DROC & SWOT Analysis, Forecast Outlook |
| Key Segments | • By Application (Solvent, Electrolyte, Catalyst, Additives, Cleaners, Others) • By End-User (Paints & Coatings, Pharmaceuticals, Cosmetics & Personal Care, Textile, Energy & Power, Mining, Others) |
| Regional Analysis/Coverage | North America (US, Canada, Mexico), Europe (Eastern Europe [Poland, Romania, Hungary, Turkey, Rest of Eastern Europe] Western Europe] Germany, France, UK, Italy, Spain, Netherlands, Switzerland, Austria, Rest of Western Europe]), Asia Pacific (China, India, Japan, South Korea, Vietnam, Singapore, Australia, Rest of Asia Pacific), Middle East & Africa (Middle East [UAE, Egypt, Saudi Arabia, Qatar, Rest of Middle East], Africa [Nigeria, South Africa, Rest of Africa], Latin America (Brazil, Argentina, Colombia, Rest of Latin America) |
| Company Profiles | BASF SE, Huntsman Corporation, LyondellBasell Industries, Dow Inc., Lotte Chemical Corporation, Shandong Shida Shenghua Chemical Group Co., Ltd., Shandong Depu Chemical Industry Science & Technology Co., Ltd., Hi-Tech Chemicals Co., Ltd., Shandong Haike Chemical Group, Lixing Chemical, Nippon Chemical Industrial Co., Ltd., Eastman Chemical Company, Mitsubishi Chemical Corporation, Jiangsu Aoke Chemical Co., Ltd., Repsol S.A., Merck KGaA, Shandong Wells Chemicals Co., Ltd., Hangzhou Dayangchem Co., Ltd., Iolitec Ionic Liquids Technologies GmbH, Haihang Industry Co., Ltd. |
Ans: The Propylene Carbonate Market was valued at USD 396.40 Million in 2023.
Ans: The expected CAGR of the global Propylene Carbonate Market during the forecast period is 6.05%
Ans: The Solvent will grow rapidly in the Propylene Carbonate Market from 2024-2032.
Ans: Rising demand for lithium-ion batteries which drives the market growth.
Ans: Asia Pacific led the Propylene Carbonate Market in the region with the highest revenue share in 2023.
Table of Contents:
1. Introduction
1.1 Market Definition
1.2 Scope (Inclusion and Exclusions)
1.3 Research Assumptions
2. Executive Summary
2.1 Market Overview
2.2 Regional Synopsis
2.3 Competitive Summary
3. Research Methodology
3.1 Top-Down Approach
3.2 Bottom-up Approach
3.3. Data Validation
3.4 Primary Interviews
4. Market Dynamics Impact Analysis
4.1 Market Driving Factors Analysis
4.1.2 Drivers
4.1.2 Restraints
4.1.3 Opportunities
4.1.4 Challenges
4.2 PESTLE Analysis
4.3 Porter’s Five Forces Model
5. Statistical Insights and Trends Reporting
5.1 Production Capacity and Utilization, by Country, By Type, 2023
5.2 Feedstock Prices, by Country, By Type, 2023
5.3 Regulatory Impact, by Country, By Type 2023.
5.4 Environmental Metrics: Emissions Data, Waste Management Practices, and Sustainability Initiatives, by Region
5.5 Innovation and R&D, Type, 2023
6. Competitive Landscape
6.1 List of Major Companies, By Region
6.2 Market Share Analysis, By Region
6.3 Product Benchmarking
6.3.1 Product specifications and features
6.3.2 Pricing
6.4 Strategic Initiatives
6.4.1 Marketing and promotional activities
6.4.2 Distribution and Supply Chain Strategies
6.4.3 Expansion Plans and New Product Launches
6.4.4 Strategic partnerships and collaborations
6.5 Technological Advancements
6.6 Market Positioning and Branding
7. Propylene Carbonate Market Segmentation, By Application
7.1 Chapter Overview
7.2 Solvent
7.2.1 Solvent Trends Analysis (2020-2032)
7.2.2 Solvent Market Size Estimates and Forecasts to 2032 (USD Million)
7.3 Electrolyte
7.3.1 Electrolyte Market Trends Analysis (2020-2032)
7.3.2 Electrolyte Market Size Estimates and Forecasts to 2032 (USD Million)
7.4 Catalyst
7.4.1 Catalyst Trends Analysis (2020-2032)
7.4.2 Catalyst Market Size Estimates and Forecasts to 2032 (USD Million)
7.5 Additives
7.5.1 Additives Market Trends Analysis (2020-2032)
7.5.2 Additives Market Size Estimates and Forecasts to 2032 (USD Million)
7.6 Cleaners
7.6.1 Cleaners Trends Analysis (2020-2032)
7.6.2 Cleaners Market Size Estimates and Forecasts to 2032 (USD Million)
7.7 Others
7.7.1 Others Trends Analysis (2020-2032)
7.7.2 Others Market Size Estimates and Forecasts to 2032 (USD Million)
8. Propylene Carbonate Market Segmentation, by End-Use Industry
8.1 Chapter Overview
8.2 Paints & Coatings
8.2.1 Paints & Coatings Market Trends Analysis (2020-2032)
8.2.2 Paints & Coatings Market Size Estimates and Forecasts to 2032 (USD Million)
8.3 Pharmaceuticals
8.3.1 Pharmaceuticals Market Trends Analysis (2020-2032)
8.3.2 Pharmaceuticals Market Size Estimates and Forecasts to 2032 (USD Million)
8.4 Cosmetics & Personal Care
8.4.1 Cosmetics & Personal Care Market Trends Analysis (2020-2032)
8.4.2 Cosmetics & Personal Care Market Size Estimates and Forecasts to 2032 (USD Million)
8.5 Textile
8.5.1 Textile Market Trends Analysis (2020-2032)
8.5.2 Textile Market Size Estimates and Forecasts to 2032 (USD Million)
8.6 Energy & Power
8.6.1 Energy & Power Market Trends Analysis (2020-2032)
8.6.2 Energy & Power Market Size Estimates and Forecasts to 2032 (USD Million)
8.7 Mining
8.7.1 Mining Market Trends Analysis (2020-2032)
8.7.2 Mining Market Size Estimates and Forecasts to 2032 (USD Million)
8.8 Others
8.8.1 Others Market Trends Analysis (2020-2032)
8.8.2 Others Market Size Estimates and Forecasts to 2032 (USD Million)
9. Regional Analysis
9.1 Chapter Overview
9.2 North America
9.2.1 Trends Analysis
9.2.2 North America Propylene Carbonate Market Estimates and Forecasts, by Country (2020-2032) (USD Million)
9.2.3 North America Propylene Carbonate Market Estimates and Forecasts, By Application (2020-2032) (USD Million)
9.2.4 North America Propylene Carbonate Market Estimates and Forecasts, by End-Use Industry (2020-2032) (USD Million)
9.2.5 USA
9.2.5.1 USA Propylene Carbonate Market Estimates and Forecasts, By Application (2020-2032) (USD Million)
9.2.5.2 USA Propylene Carbonate Market Estimates and Forecasts, by End-Use Industry (2020-2032) (USD Million)
9.2.6 Canada
9.2.6.1 Canada Propylene Carbonate Market Estimates and Forecasts, By Application (2020-2032) (USD Million)
9.2.6.2 Canada Propylene Carbonate Market Estimates and Forecasts, by End-Use Industry (2020-2032) (USD Million)
9.2.7 Mexico
9.2.7.1 Mexico Propylene Carbonate Market Estimates and Forecasts, By Application (2020-2032) (USD Million)
9.2.7.2 Mexico Propylene Carbonate Market Estimates and Forecasts, by End-Use Industry (2020-2032) (USD Million)
9.3 Europe
9.3.1 Eastern Europe
9.3.1.1 Trends Analysis
9.3.1.2 Eastern Europe Propylene Carbonate Market Estimates and Forecasts, by Country (2020-2032) (USD Million)
9.3.1.3 Eastern Europe Propylene Carbonate Market Estimates and Forecasts, By Application (2020-2032) (USD Million)
9.3.1.4 Eastern Europe Propylene Carbonate Market Estimates and Forecasts, by End-Use Industry (2020-2032) (USD Million)
9.3.1.5 Poland
9.3.1.5.1 Poland Propylene Carbonate Market Estimates and Forecasts, By Application (2020-2032) (USD Million)
9.3.1.5.2 Poland Propylene Carbonate Market Estimates and Forecasts, by End-Use Industry (2020-2032) (USD Million)
9.3.1.6 Romania
9.3.1.6.1 Romania Propylene Carbonate Market Estimates and Forecasts, By Application (2020-2032) (USD Million)
9.3.1.6.2 Romania Propylene Carbonate Market Estimates and Forecasts, by End-Use Industry (2020-2032) (USD Million)
9.3.1.7 Hungary
9.3.1.7.1 Hungary Propylene Carbonate Market Estimates and Forecasts, By Application (2020-2032) (USD Million)
9.3.1.7.2 Hungary Propylene Carbonate Market Estimates and Forecasts, by End-Use Industry (2020-2032) (USD Million)
9.3.1.8 Turkey
9.3.1.8.1 Turkey Propylene Carbonate Market Estimates and Forecasts, By Application (2020-2032) (USD Million)
9.3.1.8.2 Turkey Propylene Carbonate Market Estimates and Forecasts, by End-Use Industry (2020-2032) (USD Million)
9.3.1.9 Rest of Eastern Europe
9.3.1.9.1 Rest of Eastern Europe Propylene Carbonate Market Estimates and Forecasts, By Application (2020-2032) (USD Million)
9.3.1.9.2 Rest of Eastern Europe Propylene Carbonate Market Estimates and Forecasts, by End-Use Industry (2020-2032) (USD Million)
9.3.2 Western Europe
9.3.2.1 Trends Analysis
9.3.2.2 Western Europe Propylene Carbonate Market Estimates and Forecasts, by Country (2020-2032) (USD Million)
9.3.2.3 Western Europe Propylene Carbonate Market Estimates and Forecasts, By Application (2020-2032) (USD Million)
9.3.2.4 Western Europe Propylene Carbonate Market Estimates and Forecasts, by End-Use Industry (2020-2032) (USD Million)
9.3.2.5 Germany
9.3.2.5.1 Germany Propylene Carbonate Market Estimates and Forecasts, By Application (2020-2032) (USD Million)
9.3.2.5.2 Germany Propylene Carbonate Market Estimates and Forecasts, by End-Use Industry (2020-2032) (USD Million)
9.3.2.6 France
9.3.2.6.1 France Propylene Carbonate Market Estimates and Forecasts, By Application (2020-2032) (USD Million)
9.3.2.6.2 France Propylene Carbonate Market Estimates and Forecasts, by End-Use Industry (2020-2032) (USD Million)
9.3.2.7 UK
9.3.2.7.1 UK Propylene Carbonate Market Estimates and Forecasts, By Application (2020-2032) (USD Million)
9.3.2.7.2 UK Propylene Carbonate Market Estimates and Forecasts, by End-Use Industry (2020-2032) (USD Million)
9.3.2.8 Italy
9.3.2.8.1 Italy Propylene Carbonate Market Estimates and Forecasts, By Application (2020-2032) (USD Million)
9.3.2.8.2 Italy Propylene Carbonate Market Estimates and Forecasts, by End-Use Industry (2020-2032) (USD Million)
9.3.2.9 Spain
9.3.2.9.1 Spain Propylene Carbonate Market Estimates and Forecasts, By Application (2020-2032) (USD Million)
9.3.2.9.2 Spain Propylene Carbonate Market Estimates and Forecasts, by End-Use Industry (2020-2032) (USD Million)
9.3.2.10 Netherlands
9.3.2.10.1 Netherlands Propylene Carbonate Market Estimates and Forecasts, By Application (2020-2032) (USD Million)
9.3.2.10.2 Netherlands Propylene Carbonate Market Estimates and Forecasts, by End-Use Industry (2020-2032) (USD Million)
9.3.2.11 Switzerland
9.3.2.11.1 Switzerland Propylene Carbonate Market Estimates and Forecasts, By Application (2020-2032) (USD Million)
9.3.2.11.2 Switzerland Propylene Carbonate Market Estimates and Forecasts, by End-Use Industry (2020-2032) (USD Million)
9.3.2.12 Austria
9.3.2.12.1 Austria Propylene Carbonate Market Estimates and Forecasts, By Application (2020-2032) (USD Million)
9.3.2.12.2 Austria Propylene Carbonate Market Estimates and Forecasts, by End-Use Industry (2020-2032) (USD Million)
9.3.2.13 Rest of Western Europe
9.3.2.13.1 Rest of Western Europe Propylene Carbonate Market Estimates and Forecasts, By Application (2020-2032) (USD Million)
9.3.2.13.2 Rest of Western Europe Propylene Carbonate Market Estimates and Forecasts, by End-Use Industry (2020-2032) (USD Million)
9.4 Asia Pacific
9.4.1 Trends Analysis
9.4.2 Asia Pacific Propylene Carbonate Market Estimates and Forecasts, by Country (2020-2032) (USD Million)
9.4.3 Asia Pacific Propylene Carbonate Market Estimates and Forecasts, By Application (2020-2032) (USD Million)
9.4.4 Asia Pacific Propylene Carbonate Market Estimates and Forecasts, by End-Use Industry (2020-2032) (USD Million)
9.4.5 China
9.4.5.1 China Propylene Carbonate Market Estimates and Forecasts, By Application (2020-2032) (USD Million)
9.4.5.2 China Propylene Carbonate Market Estimates and Forecasts, by End-Use Industry (2020-2032) (USD Million)
9.4.6 India
9.4.5.1 India Propylene Carbonate Market Estimates and Forecasts, By Application (2020-2032) (USD Million)
9.4.5.2 India Propylene Carbonate Market Estimates and Forecasts, by End-Use Industry (2020-2032) (USD Million)
9.4.5 Japan
9.4.5.1 Japan Propylene Carbonate Market Estimates and Forecasts, By Application (2020-2032) (USD Million)
9.4.5.2 Japan Propylene Carbonate Market Estimates and Forecasts, by End-Use Industry (2020-2032) (USD Million)
9.4.6 South Korea
9.4.6.1 South Korea Propylene Carbonate Market Estimates and Forecasts, By Application (2020-2032) (USD Million)
9.4.6.2 South Korea Propylene Carbonate Market Estimates and Forecasts, by End-Use Industry (2020-2032) (USD Million)
9.4.7 Vietnam
9.4.7.1 Vietnam Propylene Carbonate Market Estimates and Forecasts, By Application (2020-2032) (USD Million)
9.2.7.2 Vietnam Propylene Carbonate Market Estimates and Forecasts, by End-Use Industry (2020-2032) (USD Million)
9.4.8 Singapore
9.4.8.1 Singapore Propylene Carbonate Market Estimates and Forecasts, By Application (2020-2032) (USD Million)
9.4.8.2 Singapore Propylene Carbonate Market Estimates and Forecasts, by End-Use Industry (2020-2032) (USD Million)
9.4.9 Australia
9.4.9.1 Australia Propylene Carbonate Market Estimates and Forecasts, By Application (2020-2032) (USD Million)
9.4.9.2 Australia Propylene Carbonate Market Estimates and Forecasts, by End-Use Industry (2020-2032) (USD Million)
9.4.10 Rest of Asia Pacific
9.4.10.1 Rest of Asia Pacific Propylene Carbonate Market Estimates and Forecasts, By Application (2020-2032) (USD Million)
9.4.10.2 Rest of Asia Pacific Propylene Carbonate Market Estimates and Forecasts, by End-Use Industry (2020-2032) (USD Million)
9.5 Middle East and Africa
9.5.1 Middle East
9.5.1.1 Trends Analysis
9.5.1.2 Middle East Propylene Carbonate Market Estimates and Forecasts, by Country (2020-2032) (USD Million)
9.5.1.3 Middle East Propylene Carbonate Market Estimates and Forecasts, By Application (2020-2032) (USD Million)
9.5.1.4 Middle East Propylene Carbonate Market Estimates and Forecasts, by End-Use Industry (2020-2032) (USD Million)
9.5.1.5 UAE
9.5.1.5.1 UAE Propylene Carbonate Market Estimates and Forecasts, By Application (2020-2032) (USD Million)
9.5.1.5.2 UAE Propylene Carbonate Market Estimates and Forecasts, by End-Use Industry (2020-2032) (USD Million)
9.5.1.6 Egypt
9.5.1.6.1 Egypt Propylene Carbonate Market Estimates and Forecasts, By Application (2020-2032) (USD Million)
9.5.1.6.2 Egypt Propylene Carbonate Market Estimates and Forecasts, by End-Use Industry (2020-2032) (USD Million)
9.5.1.7 Saudi Arabia
9.5.1.7.1 Saudi Arabia Propylene Carbonate Market Estimates and Forecasts, By Application (2020-2032) (USD Million)
9.5.1.7.2 Saudi Arabia Propylene Carbonate Market Estimates and Forecasts, by End-Use Industry (2020-2032) (USD Million)
9.5.1.8 Qatar
9.5.1.8.1 Qatar Propylene Carbonate Market Estimates and Forecasts, By Application (2020-2032) (USD Million)
9.5.1.8.2 Qatar Propylene Carbonate Market Estimates and Forecasts, by End-Use Industry (2020-2032) (USD Million)
9.5.1.9 Rest of Middle East
9.5.1.9.1 Rest of Middle East Propylene Carbonate Market Estimates and Forecasts, By Application (2020-2032) (USD Million)
9.5.1.9.2 Rest of Middle East Propylene Carbonate Market Estimates and Forecasts, by End-Use Industry (2020-2032) (USD Million)
9.5.2 Africa
9.5.2.1 Trends Analysis
9.5.2.2 Africa Propylene Carbonate Market Estimates and Forecasts, by Country (2020-2032) (USD Million)
9.5.2.3 Africa Propylene Carbonate Market Estimates and Forecasts, By Application (2020-2032) (USD Million)
9.5.2.4 Africa Propylene Carbonate Market Estimates and Forecasts, by End-Use Industry (2020-2032) (USD Million)
9.5.2.5 South Africa
9.5.2.5.1 South Africa Propylene Carbonate Market Estimates and Forecasts, By Application (2020-2032) (USD Million)
9.5.2.5.2 South Africa Propylene Carbonate Market Estimates and Forecasts, by End-Use Industry (2020-2032) (USD Million)
9.5.2.6 Nigeria
9.5.2.6.1 Nigeria Propylene Carbonate Market Estimates and Forecasts, By Application (2020-2032) (USD Million)
9.5.2.6.2 Nigeria Propylene Carbonate Market Estimates and Forecasts, by End-Use Industry (2020-2032) (USD Million)
9.6 Latin America
9.6.1 Trends Analysis
9.6.2 Latin America Propylene Carbonate Market Estimates and Forecasts, by Country (2020-2032) (USD Million)
9.6.3 Latin America Propylene Carbonate Market Estimates and Forecasts, By Application (2020-2032) (USD Million)
9.6.4 Latin America Propylene Carbonate Market Estimates and Forecasts, by End-Use Industry (2020-2032) (USD Million)
9.6.5 Brazil
9.6.5.1 Brazil Propylene Carbonate Market Estimates and Forecasts, By Application (2020-2032) (USD Million)
9.6.5.2 Brazil Propylene Carbonate Market Estimates and Forecasts, by End-Use Industry (2020-2032) (USD Million)
9.6.6 Argentina
9.6.6.1 Argentina Propylene Carbonate Market Estimates and Forecasts, By Application (2020-2032) (USD Million)
9.6.6.2 Argentina Propylene Carbonate Market Estimates and Forecasts, by End-Use Industry (2020-2032) (USD Million)
9.6.7 Colombia
9.6.7.1 Colombia Propylene Carbonate Market Estimates and Forecasts, By Application (2020-2032) (USD Million)
9.6.7.2 Colombia Propylene Carbonate Market Estimates and Forecasts, by End-Use Industry (2020-2032) (USD Million)
9.6.8 Rest of Latin America
9.6.8.1 Rest of Latin America Propylene Carbonate Market Estimates and Forecasts, By Application (2020-2032) (USD Million)
9.6.8.2 Rest of Latin America Propylene Carbonate Market Estimates and Forecasts, by End-Use Industry (2020-2032) (USD Million)
10. Company Profiles
10.1 BASF SE
10.1.1 Company Overview
10.1.2 Financial
10.1.3 Product / Services Offered
10.1.4 SWOT Analysis
10.2 Huntsman Corporation
10.2.1 Company Overview
10.2.2 Financial
10.2.3 Product/ Services Offered
10.2.4 SWOT Analysis
10.3 LyondellBasell Industries
10.3.1 Company Overview
10.3.2 Financial
10.3.3 Product/ Services Offered
10.3.4 SWOT Analysis
10.4 Dow Inc.
10.4.1 Company Overview
10.4.2 Financial
10.4.3 Product/ Services Offered
10.4.4 SWOT Analysis
10.5 Lotte Chemical Corporation
10.5.1 Company Overview
10.5.2 Financial
10.5.3 Product/ Services Offered
10.5.4 SWOT Analysis
10.6 Hi-Tech Chemicals Co., Ltd.
10.6.1 Company Overview
10.6.2 Financial
10.6.3 Product/ Services Offered
10.6.4 SWOT Analysis
10.7 Nippon Chemical Industrial Co., Ltd.
10.7.1 Company Overview
10.7.2 Financial
10.7.3 Product/ Services Offered
10.7.4 SWOT Analysis
10.8 Eastman Chemical Company
10.8.1 Company Overview
10.8.2 Financial
10.8.3 Product/ Services Offered
10.8.4 SWOT Analysis
10.9 Mitsubishi Chemical Corporation
10.9.1 Company Overview
10.9.2 Financial
10.9.3 Product/ Services Offered
10.9.4 SWOT Analysis
10.10 Jiangsu Aoke Chemical Co., Ltd.
10.10.1 Company Overview
10.10.2 Financial
10.10.3 Product/ Services Offered
10.10.4 SWOT Analysis
11. Use Cases and Best Practices
12. Conclusion
An accurate research report requires proper strategizing as well as implementation. There are multiple factors involved in the completion of good and accurate research report and selecting the best methodology to compete the research is the toughest part. Since the research reports we provide play a crucial role in any company’s decision-making process, therefore we at SNS Insider always believe that we should choose the best method which gives us results closer to reality. This allows us to reach at a stage wherein we can provide our clients best and accurate investment to output ratio.
Each report that we prepare takes a timeframe of 350-400 business hours for production. Starting from the selection of titles through a couple of in-depth brain storming session to the final QC process before uploading our titles on our website we dedicate around 350 working hours. The titles are selected based on their current market cap and the foreseen CAGR and growth.
The 5 steps process:
Step 1: Secondary Research:
Secondary Research or Desk Research is as the name suggests is a research process wherein, we collect data through the readily available information. In this process we use various paid and unpaid databases which our team has access to and gather data through the same. This includes examining of listed companies’ annual reports, Journals, SEC filling etc. Apart from this our team has access to various associations across the globe across different industries. Lastly, we have exchange relationships with various university as well as individual libraries.

Step 2: Primary Research
When we talk about primary research, it is a type of study in which the researchers collect relevant data samples directly, rather than relying on previously collected data. This type of research is focused on gaining content specific facts that can be sued to solve specific problems. Since the collected data is fresh and first hand therefore it makes the study more accurate and genuine.
We at SNS Insider have divided Primary Research into 2 parts.
Part 1 wherein we interview the KOLs of major players as well as the upcoming ones across various geographic regions. This allows us to have their view over the market scenario and acts as an important tool to come closer to the accurate market numbers. As many as 45 paid and unpaid primary interviews are taken from both the demand and supply side of the industry to make sure we land at an accurate judgement and analysis of the market.
This step involves the triangulation of data wherein our team analyses the interview transcripts, online survey responses and observation of on filed participants. The below mentioned chart should give a better understanding of the part 1 of the primary interview.

Part 2: In this part of primary research the data collected via secondary research and the part 1 of the primary research is validated with the interviews from individual consultants and subject matter experts.
Consultants are those set of people who have at least 12 years of experience and expertise within the industry whereas Subject Matter Experts are those with at least 15 years of experience behind their back within the same space. The data with the help of two main processes i.e., FGDs (Focused Group Discussions) and IDs (Individual Discussions). This gives us a 3rd party nonbiased primary view of the market scenario making it a more dependable one while collation of the data pointers.
Step 3: Data Bank Validation
Once all the information is collected via primary and secondary sources, we run that information for data validation. At our intelligence centre our research heads track a lot of information related to the market which includes the quarterly reports, the daily stock prices, and other relevant information. Our data bank server gets updated every fortnight and that is how the information which we collected using our primary and secondary information is revalidated in real time.

Step 4: QA/QC Process
After all the data collection and validation our team does a final level of quality check and quality assurance to get rid of any unwanted or undesired mistakes. This might include but not limited to getting rid of the any typos, duplication of numbers or missing of any important information. The people involved in this process include technical content writers, research heads and graphics people. Once this process is completed the title gets uploader on our platform for our clients to read it.
Step 5: Final QC/QA Process:
This is the last process and comes when the client has ordered the study. In this process a final QA/QC is done before the study is emailed to the client. Since we believe in giving our clients a good experience of our research studies, therefore, to make sure that we do not lack at our end in any way humanly possible we do a final round of quality check and then dispatch the study to the client.
Key Segments:
By Application
Solvent
Electrolyte
Catalyst
Additives
Cleaners
Others
By End-Use Industry
Paints & Coatings
Pharmaceuticals
Cosmetics & Personal Care
Textile
Energy & Power
Mining
Others
Request for Segment Customization as per your Business Requirement: Segment Customization Request
Regional Coverage:
North America
US
Canada
Mexico
Europe
Eastern Europe
Poland
Romania
Hungary
Turkey
Rest of Eastern Europe
Western Europe
Germany
France
UK
Italy
Spain
Netherlands
Switzerland
Austria
Rest of Western Europe
Asia Pacific
China
India
Japan
South Korea
Vietnam
Singapore
Australia
Rest of Asia Pacific
Middle East & Africa
Middle East
UAE
Egypt
Saudi Arabia
Qatar
Rest of Middle East
Africa
Nigeria
South Africa
Rest of Africa
Latin America
Brazil
Argentina
Colombia
Rest of Latin America
Request for Country Level Research Report: Country Level Customization Request
Available Customization
With the given market data, SNS Insider offers customization as per the company’s specific needs. The following customization options are available for the report:
Detailed Volume Analysis
Criss-Cross segment analysis (e.g. Product X Application)
Competitive Product Benchmarking
Geographic Analysis
Additional countries in any of the regions
Customized Data Representation
Detailed analysis and profiling of additional market players
The Metal Finishing Chemicals Market Size was USD 12.1 billion in 2023, and will reach USD 18.8 billion by 2032, and grow at a CAGR of 5.1% by 2024-2032.
UV Curable Coatings Market size was USD 8.21 Billion in 2023 and is expected to reach USD 20.94 Billion by 2032, growing at a CAGR of 10.97% from 2024-2032.
The Butyl Rubber Market size was valued at USD 3.9 Billion in 2023. It is expected to grow to USD 6.9 Bn by 2032 and grow at a CAGR of 6.3% by 2024-2032.
Battery Metals Market size was USD 10.6 Billion in 2023 and is expected to reach USD 21.3 Billion by 2032 and grow at a CAGR of 8.1% from 2024-2032.
The Cyanoacrylate Adhesives market size was USD 2.35 Billion in 2023 and is expected to touch USD 3.88 Billion by 2032, at a CAGR of 5.73 % from 2024 to 2032.
The Maleic Anhydride Market size was USD 3.7 Billion in 2023 and is expected to reach USD 5.3 Billion by 2032 and grow at a CAGR of 4.1% by 2024-2032.

Hi! Click one of our member below to chat on Phone
© 2025 All Rights Reserved by SNS Insider Pvt Ltd


