Proppants Market Report Scope & Overview:
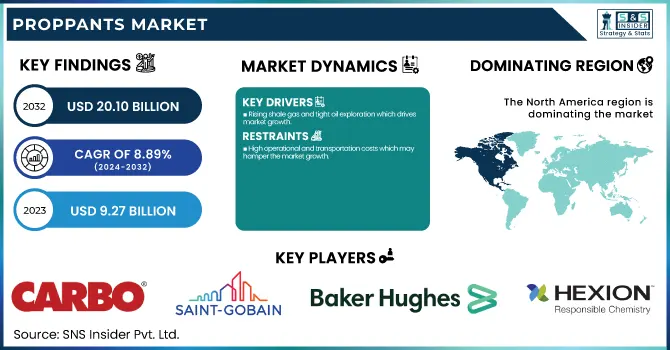
The Proppants Market size was USD 9.27 Billion in 2023 and is expected to reach USD 20.10 Billion by 2032 and grow at a CAGR of 8.89% over the forecast period of 2024-2032. The report provides an in-depth analysis of production capacity and utilization by country and proppant type, highlighting key regions such as North America, Asia-Pacific, and Europe. It examines raw material and feedstock price fluctuations, including silica sand, bauxite, and resin, impacting production costs. The report explores regulatory impacts on frac sand mining and proppant usage, focusing on environmental policies in major markets. Additionally, it assesses emissions, waste management, and sustainability initiatives in proppant manufacturing. Innovation trends in high-performance proppants, including advanced resin-coated and ceramic variants, are also covered. The report further analyzes demand and consumption trends across key oil & gas applications, such as shale exploration and deepwater drilling. This comprehensive analysis provides valuable insights for stakeholders navigating the evolving proppants market.
To Get more information on Proppants Market - Request Free Sample Report
The proppants market in the U.S. accounted for the largest share around 83% in 2023. It is owing to the presence of large shale gas and tight oil production in the country, especially in the Permian Basin, Marcellus, Eagle Ford, and Bakken formations. Fracking & Horizontal Drilling Creates Massive Demand for Frac Sand, Resin-Coated and Ceramic Proppants Nearby silica sand reserves, especially from Wisconsin and Texas, help reduce material costs and guarantee supply for the country. The market is further propelled by government policies promoting domestic energy production, and also by the development of new technologies to further develop enhanced oil recovery (EOR). Also, these major oilfield service providers such as Halliburton, Schlumberger, and Baker Hughes reinforce the proppants industry of the United States.
Proppants Market Dynamics
Drivers
-
Rising shale gas and tight oil exploration which drives market growth.
An increase in shale gas and tight oil exploration is one of the major factors driving the growth of the proppants market, due to the wider acceptance of hydraulic fracturing (fracking) technology mainly in some key oil-producing regions. U.S. shale production, especially in the Permian Basin, Eagle Ford, and Bakken formations, has grown immensely due to government backing and technological innovation. The same applies to Canada, with the development of unconventional oil and gas reserves focused on the Montney and Duvernay formations, and at Sichuan Basin in China. With demand for frac sand, resin-coated proppants & ceramic proppants climbing as fracking operations become more aggressive, oil and gas recoveries levels are boosted. Moreover, the worldwide energy transition and energy security issue, have converted the increase of home oil & gas manufacturing efforts and, in flip, the demand for proppants.
Restraint
-
High operational and transportation costs which may hamper the market growth.
Its high operational and transportation costs hamper the growth of such types of proppants, which in turn is expected to act as a restraint for the growth of the global proppants market. Frac sand is typically produced in key areas of the country, mainly the U.S. Midwest (Wisconsin and Minnesota) where these sands are mined, washed dried, and industrially processed and then transported long distances at higher logistic costs the main oil and gas basins, mainly Permian, Bakken and Eagle Ford. During the down markets for oil and gas, the expense of rail, trucking, and storage alone already inflated the cost of the rail services that apply to overall well which make it unappealing economically to the oilfield operators. Moreover, infrastructure constraints, including insufficient rail capacity and trucking shortages, intensify transportation costs. Much more expensive are resin-coated and ceramic proppants, which provide higher performance, but whose complicated and lengthy manufacturing processes and high raw material costs limit their broad use. This has sparked regional in-basin sand being seen as a cost-effective alternative by many oil and gas companies, stifling the growth trajectory of higher-grade proppants moving forward.
Opportunity
-
Rising investments in oilfield infrastructure and logistics create an opportunity in the market.
Oilfield infrastructure and logistics investments are on the rise and offer a massive opportunity in the proppants market as investing companies will pursue the least-cost option by ensuring secure supply chains and reduced operational costs. As hydraulic fracturing activities become more widespread, the need to transport proppant quickly, store it safely, and handle it seamlessly on-site has naturally increased. There are considerable investments in automated proppant delivery systems, in-basin sand mining plants, and better rail and trucking networks to reduce logistics costs and time and to facilitate well-site productivity. North American developers of unit-train terminals and last-mile trucking solutions are making sure domestic proppants stay cheap and plentiful for shale plays. Mobile proppant storage silos and systems that track inventory in real-time are also some of the innovations growing in popularity to improve efficiency and reduce wastage. Such development in infrastructure reduces transportation costs and helps to more sustainable lifecycle of the textile supply chain by avoiding cumbersome emissions from transporting goods over long distances. Oilfield service providers and proppant manufacturers are also likely to invest more in logistics solutions, which will create a stronger supply chain with improved cost-effectiveness and growth opportunities in the future.
Challenges
-
High transportation and logistics costs may challenge the market growth.
Proppants market by transportation and logistics costs high transportation and logistics costs a primary inhibitors to the growth in the proppants market, as these materials, particularly frac sand, have to be transported over long distances from mining sites to drilling locations. Because of this, proppants are normally excavated in certain areas only (for example, frac sand in Wisconsin and frac sand in Texas in the U.S.), and they must be shipped very long distances to very long distances to oil and gas basins, which raises costs as a whole. Railroads, trucking, last-mile delivery pretty much all the ways we ship things are getting more expensive, just try finding a place where there is no supply chain issues and rising fuel prices. Inconsistent rail accessibility, infrastructure bottlenecks, and congestion at drilling sites create inconsistencies in the ability to move sand, resulting in additional time and expense. Resin-coated and ceramic proppants, which necessitate extra processing and lengthy hours across the pond, drive up the logistics costs. High transportation costs are expected to impact the profit margins of oilfield service companies and drilling operators, which in turn limits the demand for proppants, particularly in cost-sensitive projects.
Proppants Market Segmentation Analysis
By Product Type
Frac Sand held the largest market share around 58% in 2023. It is relatively cost-effective, readily available, and performs well in hydraulic fracturing applications. Sand proppant is widely used, especially in shale gas and tight oil production, because it offers the best trade-off between permeability and conductivity at a lower price than resin-coated and ceramic ones. Operators in the oil and gas industry have opted for high-purity silica sand, following the large deposits within the Midwest U.S. (Wisconsin, Minnesota, and Illinois) and Canada’s Alberta Basin. Further, the improvements in multi-stage fracturing and horizontal drilling techniques led to the need for large volumes of frac sand to enhance well output. It remains the leading proppant due to its lower costs to transport versus alternative proppants and the enviable position in high proppant intensity plays, increased focus on domestic energy production, and other factors.
By Application
The shale gas segment has the largest share around 38% in 2023. It is due to the production was driven by key basins, including the Permian, Marcellus, Eagle Ford, and Sichuan Basin that propel the proppant demand. Shale gas extraction depends on high quantities of proppants, majorly frac sand filled in the fracture again, resin-coated proppants, and ceramic proppants, which are being utilized to keep the openings open and allow the hydrocarbon to flow. Shale gas exploration has also been encouraged by government support and energy security policy, especially in North America, where it has further decreased reliance on imports. The lower cost of extracting shale gas compared to conventional gas sources and an ever-growing global appetite for cleaner energy alternatives only confirm its place at the top. Shale gas continues to represent the largest proppants segment due to ongoing developments of enhanced oil recovery (EOR) methods and growing unconventional gas reserve investments.
Proppants Market Regional Outlook
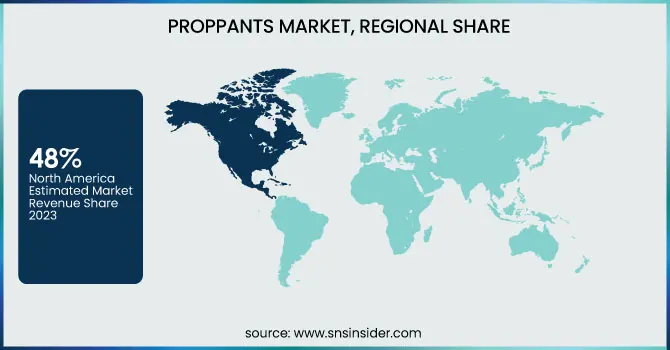
North America held the largest market share around 48% in 2023. It is such as that in the United States and Canada due to shale gas and tight oil production. With the hydraulic fracturing (fracking) and horizontal drilling process, the demand increased for frac sand, resin-coated proppants, and ceramic proppants to increase production from wells. Proppant consumption is also fueled by the presence of major shale formations like the Permian Basin, Marcellus, Eagle Ford, and Montney. Continued exploration and production activities have also been supported by favorable government policies, technology developments, and energy security initiatives. These include a mature supply chain, large deposits of silica sand, and strong investments from major oilfield service providers establishing the area as the primary player in the global proppants sector.
Asia Pacific held a significant market share in 2023. The domestic gas production demand also propels the market in Australia with the Cooper Basin and Canning Basin in the region over the coming period. In addition, infrastructure among oilfield service providers has encouraged technological advancements in fracking techniques which, combined with other improvements, has only increased proppant demand. Furthermore, Asia-Pacific, with its increasing regional industrialization and continuing regional energy security concerns, will remain the backbone of future growth in oil and gas exploration, reinforcing its position as a major proppants market.
Get Customized Report as per Your Business Requirement - Enquiry Now
Key Players
-
CARBO Ceramics Inc. (CARBOHSP Ceramic Proppant, CARBOLITE Lightweight Proppant)
-
U.S. Silica Holdings Inc. (Silica Sand Proppant, Resin-Coated Proppant)
-
Covia Holdings LLC (Unifrac Resin-Coated Sand, Unifrac Ceramic Proppant)
-
Hi-Crush Inc. (Northern White Sand, In-Basin Sand)
-
Hexion Inc. (XRT Resin-Coated Proppant, Prime Plus Proppant)
-
Saint-Gobain Proppants (Sintered Bauxite Proppant, Sintered Kaolin Proppant)
-
Badger Mining Corporation (BadgerFrac Industrial Sand, BadgerCoated Resin-Coated Sand)
-
Emerge Energy Services LP (Superior Silica Sands, White Frac Sand)
-
Preferred Sands (Preferred Resin-Coated Sand, Preferred White Sand)
-
Fairmount Santrol Holdings Inc. (Santrol Proppant, Propel SSP Proppant)
-
Atlas Sand Company, LLC (Atlas White Sand, Atlas In-Basin Sand)
-
Mineração Curimbaba (Ceramic Proppant, Lightweight Proppant)
-
Xinmi Wanli Industry Development Co., Ltd. (Wanli Ceramic Proppant, Ultra Lightweight Proppant)
-
China GengSheng Minerals, Inc. (Ceramic Proppant, High-Strength Proppant)
-
ChangQing Proppant (Ceramic Proppant, Intermediate-Strength Proppant)
-
CoorsTek Inc. (Ceramic Proppant, High-Density Proppant)
-
Eagle Materials Inc. (Frac Sand, Resin-Coated Proppant)
-
Fores LTD (Ceramic Proppant, Lightweight Proppant)
-
Halliburton (SandCastle PS-2500 Vertical Storage Silo, SandForce Advanced Proppant Delivery System)
-
Baker Hughes Company (Ceramic Proppant, Resin-Coated Sand)
Recent Development:
-
In February 2024, Atlas Energy Solutions Inc. finalized an agreement to acquire Hi-Crush Inc.'s North American proppant production assets and logistics operations.
| Report Attributes | Details |
|---|---|
| Market Size in 2023 | USD 9.27 Billion |
| Market Size by 2032 | USD 20.10 Billion |
| CAGR | CAGR of 8.89% From 2024 to 2032 |
| Base Year | 2023 |
| Forecast Period | 2024-2032 |
| Historical Data | 2020-2022 |
| Report Scope & Coverage | Market Size, Segments Analysis, Competitive Landscape, Regional Analysis, DROC & SWOT Analysis, Forecast Outlook |
| Key Segments | •By Type (Frac Sand, Resin-coated Proppant, Ceramic Proppant) •By Application (Shale Gas, Tight Gas, Coal Bed Methane, Others) |
| Regional Analysis/Coverage | North America (US, Canada, Mexico), Europe (Eastern Europe [Poland, Romania, Hungary, Turkey, Rest of Eastern Europe] Western Europe] Germany, France, UK, Italy, Spain, Netherlands, Switzerland, Austria, Rest of Western Europe]), Asia Pacific (China, India, Japan, South Korea, Vietnam, Singapore, Australia, Rest of Asia Pacific), Middle East & Africa (Middle East [UAE, Egypt, Saudi Arabia, Qatar, Rest of Middle East], Africa [Nigeria, South Africa, Rest of Africa], Latin America (Brazil, Argentina, Colombia, Rest of Latin America) |
| Company Profiles | CARBO Ceramics Inc., U.S. Silica Holdings Inc., Covia Holdings LLC, Hi-Crush Inc., Hexion Inc., Saint-Gobain Proppants, Badger Mining Corporation, Emerge Energy Services LP, Preferred Sands, Fairmount Santrol Holdings Inc., Atlas Sand Company LLC, Mineração Curimbaba, Xinmi Wanli Industry Development Co. Ltd., China GengSheng Minerals Inc., ChangQing Proppant, CoorsTek Inc., Eagle Materials Inc., Fores LTD, Halliburton, Baker Hughes Company |
