Get More Information on Process Oil Market - Request Sample Report
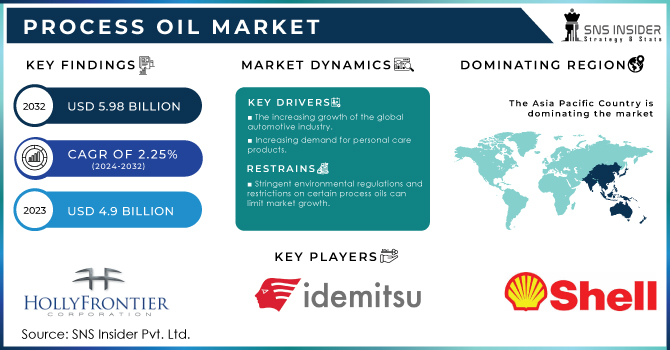
The Process Oil Market Size was valued at USD 4.9 billion in 2023 and is expected to reach USD 5.98 billion by 2032 and grow at a CAGR of 2.25% over the forecast period 2024-2032.
Supply chain dynamics and the regulatory landscape are important for the process oil market, as they define how materials move and establish production standards, respectively. They are now adopting sustainability initiatives to fulfill increasing environmental requirements. The economy is impacted significantly, by the market driving industrial growth, and investment trends fueling innovation. Policy developments are also important since government actions on trade and tariffs can influence the direction of the market. This report covers all the facets to consider, and we provide a detailed market analysis in this report.
Drivers
Rising Demand for Process Oils in Automotive and Manufacturing Sectors Fuels Market Growth
The process oil market is primarily driven by the automotive and manufacturing sectors. Process oils are becoming increasingly important to many industries including automotive, rubber, and plastics, due to the growing demand for high-performance lubricants, additives, and processing fluids. Growing demand from end-users for the effective properties of process oils drives market growth, along with the ongoing growth of industries that require process oils, such as tires, coatings, and plastics. Additionally, the automotive industry is crucial since there is a growing prime for lubricants and oils used in the production and maintenance of vehicles for operations as well as longer operating times. These industries are expected to fuel the growth of the process oil market, as the demand for high-grade functional process oil increases, subsequently driving the growth of the market.
Restraints
Fluctuating Raw Material Prices and Supply Chain Disruptions Hinder Process Oil Availability
Fluctuations in raw material prices and supply chain disruptions is one of the restraining factors in the process oil market. The prices of raw materials crucial for process oil production specifically crude oil and petrochemicals are exposed to volatility from numerous factors, including geopolitical tensions, natural calamities, and worldwide supply chain complications. These fluctuations in its availability can create instability for the market, with regards to the supply and also the price of process oils. Supply chain disruptions can also cause delays in production and distribution, resulting in shortages and rising costs. Such intangible factors would derail market confidence and this would delay the development of the process oil industry.
Opportunities
Growing Demand for Bio-Based and Renewable Process Oils Creates New Market Opportunities
Increasing consumer demand for the use of greener products may open up potential growth avenues in the process oil market, due to the possibility of developing both bio-based and renewable oils. Bio-based process oils can prove to be highly competitive with rising consumer preference towards environmentally friendly or renewable alternatives, as they derive from natural resource-based plant oils rather than petroleum-based material. Bio-based process oils have fewer adverse environmental effects and can, therefore, be used by industries to achieve sustainability. Growth by the advancement of green technologies serves as an opportunity for growth with innovations in renewable process oils to satisfy the aspirations of more sustainable industries.
Challenge
Ensuring Consistent Quality Standards Across Global Markets Presents Challenges in Process Oil Production
A challenge for manufacturers is to have the same quality standards for process oils in different parts of the world. Regional differences in production methods, availability of feedstocks, and environmental regulations can result in oil quality variability. Such inconsistencies can impact their performance and reliability, complicating efforts by companies to maintain uniformity over different ranges of products. Quality control becomes more challenging as companies expand into pertinent markets and different regions, and must be mindful of the international standards vs. regional differences. This challenge puts customer satisfaction at risk and poses an obstacle to the process oil market growth.
By Type
The naphthenic segment dominated the process oil market in 2023 and accounted for a market share of approximately 45%. Due to their high performance, naphthenic oils are widely used in lubricants and rubber processing; they are very thermally stable and have lower volatility compared to paraffinic oils, being available for extreme applications. As a case in point, the Rubber Manufacturers Association (RMA) focuses on the importance of utilizing high-quality naphthenic oils in tire manufacturing, as they improve the quality and efficacy of the tires. Moreover, since manufacturers are opting for naphthenic oils over alternatives (such as aromatic oils) which are vulnerable and facing criticism for their health hazards, the government regulations on the use of low-toxicity and environment-friendly products are driving the market.
By Function
In 2023, the Extender Oil segment dominated the process oil market and accounted for approximately 40% market share. Extender oils play an important role in several applications, including rubber and adhesive formulations, where they are used to enhance the properties of end products. Extender oils are essential for rubber compounding because they are used to improve the flexibility and performance of rubber compounds (American Chemical Society (ACS), 2023). Also, the adoption of extender oils is increasing across the globe because of high-performance and environmentally friendly formulations, as well as efforts from manufacturers to comply with regulatory restrictions and limit the incorporation of harmful substances in the products.
By Technology
The Conventional Route dominated the process oil market in 2023 with a market share of approximately 50%. This is because the conventional route uses a well-established infrastructure, production methods, and manufacturing that would minimize costs and maximize efficiency. According to the API, conventional refining processes produce oils that are very good quality and satisfactory to most industries such as the automotive and manufacturing ones. So far, alternate technologies such as gas-to-liquid and bio-based oils have received more interest, but conventional processes are still considered highly reliable and scalable.
By Application
The Rubber Processing segment dominated the process oil market in 2023 with a market share of approximately 35%. The growth in this segment is on account of the increased demand for rubber products in the automotive and construction sectors. According to the International Rubber Study Group, the automobile sector accounts for the most rubber consumed, with very large quantities used in tires as well as other car parts. The demand for premium process oils in rubber manufacturing is strong because it encourages high performance and long use of the final products, leaving the segment with a world-standard grip on the market. The application of rubber processing continues to grow as more industries look to make operations more efficient and sustainable.
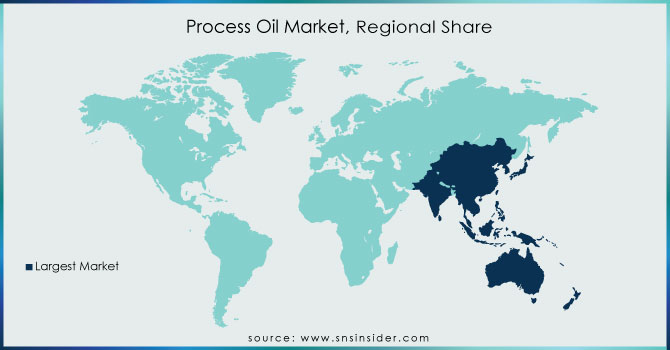
The Asia Pacific region dominated the process oil market and accounted for the largest market share as of 2023, approximately 48.6%. This dominance is due to the strong industrial growth and rise in demand for process oils in countries such as China and India. China holds the leading position in process oils consumption as the country has the biggest manufacturing industries, especially, rubber and automotive. In China, which produced over 500 million tires in 2022 according to the China Rubber Industry Association, naphthenic and paraffinic oils are critical for tire production. India has also experienced a second driver, that of demand, as India's nascent automotive sector continues to improve with the Society of Indian Automobile Manufacturers reporting a 15% rise in the total production of vehicles for 2022. Moreover, government initiatives such as "Make in India" aimed at promoting manufacturing are boosting the demand for process oils in versatile applications, further cementing its dominance in the region.
However, North America is expected to be the fastest-growing region in the process oil market, with a CAGR of 3.8% from 2024-2032. Key sectors such as automotive, rubber processing, and consumer goods are among the key drivers of this growth. American auto manufacturers like Ford and General Motors need premium process oils for tire manufacturing. The U.S. Environmental Protection Agency (EPA) even promoted sustainable oils and helped the rising market to grow. Growth has been further fuelled by Canada’s manufacturing sector, especially oil and gas. Growing demand for process oils in pharmaceuticals, adhesives, and coatings has been one of the trends driving market growth. Rising demand for eco-friendly and compliant production methods among manufacturers is propelling the use of more sustainable process oils and driving the market further in North America. North America is a fast-growing market due to industrial demand and sustainability initiatives.
Get Customized Report as per your Business Requirement - Request For Customized Report
February 2023: Trinidad and Tobago invited its energy-rich neighbors, urging them to process their oil and natural gas in the country, aiming to leverage spare capacity for LNG or petrochemical production.
Key Players
APAR Industries (PO 160, T 110, RPO 120)
Behran Oil Co. (Behran Process Oil 230, Behran Process Oil 380)
Cross Oil (Hydroclear Process Oil 200, Hydroclear Process Oil 500)
Exxon Mobil Corporation (Prorex 100, Exxsol D 80, Enerpar 10)
Gandhar Oil Refinery Limited (Divyol RPO 245, Divyol RPO 180, Divyol Bio RPO 120)
H&R Group (Tudalen 65, Circosol 4240, Plaxolene 50)
Hindustan Petroleum Corporation Limited (HP RPO 245, HP RPO 160, HP RPO 400)
HollyFrontier Refining & Marketing LLC (HollyFrontier) (Petrolatum Process Oil, Sundex 790, Sundex 870)
Idemitsu Kosan Co., Ltd. (Daphne Process Oil 150, Daphne Process Oil 200)
Indian Oil Corporation Ltd (Servo Rubber Process Oil, Servo Gem Process Oil, Servo Prime Process Oil)
Iranol Company (Iranol RPO 110, Iranol RPO 220, Iranol RPO 280)
LODHA Petro (Lodhapro 68, Lodhapro 150)
Nynas AB (Nytex 810, Nyflex 223, Nypar 220)
ORGKHIM Biochemical Holding (TDAE Process Oil, MES Process Oil)
ORLEN Unipetrol (Paramo Process Oil 160, Paramo Process Oil 350)
Petroliam Nasional Berhad (PETRONAS) (Petronas Process Oil 68, Petronas Process Oil 150, Petronas Process Oil 500)
Repsol (Repsol Process Oil 68, Repsol Process Oil 150)
Shell plc (Shell Flavex 595, Shell Gravex 925, Shell Flavex 390)
TotalEnergies (Rubber Process Oil 255, Cirkan Process Oil 100, Cirkan Process Oil 150)
WBF Pte Ltd (WBF Process Oil 100, WBF Process Oil 220)
| Report Attributes | Details |
|---|---|
| Market Size in 2023 | USD 4.9 Billion |
| Market Size by 2032 | USD 5.98 Billion |
| CAGR | CAGR of 2.25% From 2024 to 2032 |
| Base Year | 2023 |
| Forecast Period | 2024-2032 |
| Historical Data | 2020-2022 |
| Report Scope & Coverage | Market Size, Segments Analysis, Competitive Landscape, Regional Analysis, DROC & SWOT Analysis, Forecast Outlook |
| Key Segments | •By Type (Naphthenic, Paraffinic, Non-carcinogenic, Aromatic) •By Function (Extender Oil, Plasticizer, Solvent, Defoamer, Others) •By Technology (Convention Route, Gas to Liquid, Bio-base) •By Application (Rubber Processing, Adhesives & Sealants, Consumer Products, Paints & Coatings, Pharmaceuticals, Polymers, Others) |
| Regional Analysis/Coverage | North America (US, Canada, Mexico), Europe (Eastern Europe [Poland, Romania, Hungary, Turkey, Rest of Eastern Europe] Western Europe] Germany, France, UK, Italy, Spain, Netherlands, Switzerland, Austria, Rest of Western Europe]), Asia Pacific (China, India, Japan, South Korea, Vietnam, Singapore, Australia, Rest of Asia Pacific), Middle East & Africa (Middle East [UAE, Egypt, Saudi Arabia, Qatar, Rest of Middle East], Africa [Nigeria, South Africa, Rest of Africa], Latin America (Brazil, Argentina, Colombia, Rest of Latin America) |
| Company Profiles | Shell plc, Exxon Mobil Corporation, TotalEnergies, Idemitsu Kosan Co., Ltd., Indian Oil Corporation Ltd, Petroliam Nasional Berhad (PETRONAS), HollyFrontier Refining & Marketing LLC (HollyFrontier), Nynas AB, H&R Group, Repsol and other key players |
Ans: North America was the fastest-growing region in the Process Oil Market in 2023, with a CAGR of 5.8%.
Ans: The growing demand for bio-based and renewable process oils creates new opportunities in the Process Oil Market.
Ans: The conventional route dominated the Process Oil Market in 2023 with a market share of approximately 50%.
Ans: The Process Oil Market is expected to grow at a CAGR of 2.25% over the forecast period from 2024 to 2032.
Ans: The Process Oil Market was valued at USD 4.9 billion in 2023.
Table of Contents
1. Introduction
1.1 Market Definition
1.2 Scope (Inclusion and Exclusions)
1.3 Research Assumptions
2. Executive Summary
2.1 Market Overview
2.2 Regional Synopsis
2.3 Competitive Summary
3. Research Methodology
3.1 Top-Down Approach
3.2 Bottom-up Approach
3.3. Data Validation
3.4 Primary Interviews
4. Market Dynamics Impact Analysis
4.1 Market Driving Factors Analysis
4.1.1 Drivers
4.1.2 Restraints
4.1.3 Opportunities
4.1.4 Challenges
4.2 PESTLE Analysis
4.3 Porter’s Five Forces Model
5. Statistical Insights and Trends Reporting
5.1 Supply Chain Dynamics
5.2 Regulatory Landscape
5.3 Sustainability Initiatives
5.4 Economic Impact
5.5 Investment Trends
5.6 Policy Developments
6. Competitive Landscape
6.1 List of Major Companies, By Region
6.2 Market Share Analysis, By Region
6.3 Product Benchmarking
6.3.1 Product specifications and features
6.3.2 Pricing
6.4 Strategic Initiatives
6.4.1 Marketing and promotional activities
6.4.2 Distribution and supply chain strategies
6.4.3 Expansion plans and new product launches
6.4.4 Strategic partnerships and collaborations
6.5 Technological Advancements
6.6 Market Positioning and Branding
7. Process Oil Market Segmentation, by Type
7.1 Chapter Overview
7.2 Naphthenic
7.2.1 Naphthenic Market Trends Analysis (2020-2032)
7.2.2 Naphthenic Market Size Estimates and Forecasts to 2032 (USD Billion)
7.3 Paraffinic
7.3.1 Paraffinic Market Trends Analysis (2020-2032)
7.3.2 Paraffinic Market Size Estimates and Forecasts to 2032 (USD Billion)
7.4 Non-carcinogenic
7.4.1 Non-carcinogenic Market Trends Analysis (2020-2032)
7.4.2 Non-carcinogenic Market Size Estimates and Forecasts to 2032 (USD Billion)
7.5 Aromatic
7.5.1 Aromatic Market Trends Analysis (2020-2032)
7.5.2 Aromatic Market Size Estimates and Forecasts to 2032 (USD Billion)
8. Process Oil Market Segmentation, by Function
8.1 Chapter Overview
8.2 Extender Oil
8.2.1 Extender Oil Market Trends Analysis (2020-2032)
8.2.2 Extender Oil Market Size Estimates and Forecasts to 2032 (USD Billion)
8.3 Plasticizer
8.3.1 Plasticizer Market Trends Analysis (2020-2032)
8.3.2 Plasticizer Market Size Estimates and Forecasts to 2032 (USD Billion)
8.4 Solvent
8.4.1 Solvent Market Trends Analysis (2020-2032)
8.4.2 Solvent Market Size Estimates and Forecasts to 2032 (USD Billion)
8.5 Defoamer
8.5.1 Defoamer Market Trends Analysis (2020-2032)
8.5.2 Defoamer Market Size Estimates and Forecasts to 2032 (USD Billion)
8.6 Others
8.6.1 Others Market Trends Analysis (2020-2032)
8.6.2 Others Market Size Estimates and Forecasts to 2032 (USD Billion)
9. Process Oil Market Segmentation, by Technology
9.1 Chapter Overview
9.2 Convention Route
9.2.1 Convention Route Market Trends Analysis (2020-2032)
9.2.2 Convention Route Market Size Estimates and Forecasts to 2032 (USD Billion)
9.3 Gas to Liquid
9.3.1 Gas to Liquid Market Trends Analysis (2020-2032)
9.3.2 Gas to Liquid Market Size Estimates and Forecasts to 2032 (USD Billion)
9.4 Bio-base
9.4.1 Bio-base Market Trends Analysis (2020-2032)
9.4.2 Bio-base Market Size Estimates and Forecasts to 2032 (USD Billion)
10. Process Oil Market Segmentation, by Application
10.1 Chapter Overview
10.2 Rubber Processing
10.2.1 Rubber Processing Market Trends Analysis (2020-2032)
10.2.2 Rubber Processing Market Size Estimates and Forecasts to 2032 (USD Billion)
10.3 Adhesives & Sealants
10.3.1 Adhesives & Sealants Market Trends Analysis (2020-2032)
10.3.2 Adhesives & Sealants Market Size Estimates and Forecasts to 2032 (USD Billion)
10.4 Consumer Products
10.4.1 Consumer Products Market Trends Analysis (2020-2032)
10.4.2 Consumer Products Market Size Estimates and Forecasts to 2032 (USD Billion)
10.5 Paints & Coatings
10.5.1 Paints & Coatings Market Trends Analysis (2020-2032)
10.5.2 Paints & Coatings Market Size Estimates and Forecasts to 2032 (USD Billion)
10.6 Pharmaceuticals
10.6.1 Pharmaceuticals Market Trends Analysis (2020-2032)
10.6.2 Pharmaceuticals Market Size Estimates and Forecasts to 2032 (USD Billion)
10.7 Polymers
10.7.1 Polymers Market Trends Analysis (2020-2032)
10.7.2 Polymers Market Size Estimates and Forecasts to 2032 (USD Billion)
10.8 Others
10.8.1 Others Market Trends Analysis (2020-2032)
10.8.2 Others Market Size Estimates and Forecasts to 2032 (USD Billion)
11. Regional Analysis
11.1 Chapter Overview
11.2 North America
11.2.1 Trends Analysis
11.2.2 North America Process Oil Market Estimates and Forecasts, by Country (2020-2032) (USD Billion)
11.2.3 North America Process Oil Market Estimates and Forecasts, by Type (2020-2032) (USD Billion)
11.2.4 North America Process Oil Market Estimates and Forecasts, by Function (2020-2032) (USD Billion)
11.2.5 North America Process Oil Market Estimates and Forecasts, by Technology (2020-2032) (USD Billion)
11.2.6 North America Process Oil Market Estimates and Forecasts, by Application (2020-2032) (USD Billion)
11.2.7 USA
11.2.7.1 USA Process Oil Market Estimates and Forecasts, by Type (2020-2032) (USD Billion)
11.2.7.2 USA Process Oil Market Estimates and Forecasts, by Function (2020-2032) (USD Billion)
11.2.7.3 USA Process Oil Market Estimates and Forecasts, by Technology (2020-2032) (USD Billion)
11.2.7.4 USA Process Oil Market Estimates and Forecasts, by Application (2020-2032) (USD Billion)
11.2.8 Canada
11.2.8.1 Canada Process Oil Market Estimates and Forecasts, by Type (2020-2032) (USD Billion)
11.2.8.2 Canada Process Oil Market Estimates and Forecasts, by Function (2020-2032) (USD Billion)
11.2.8.3 Canada Process Oil Market Estimates and Forecasts, by Technology (2020-2032) (USD Billion)
11.2.8.4 Canada Process Oil Market Estimates and Forecasts, by Application (2020-2032) (USD Billion)
11.2.9 Mexico
11.2.9.1 Mexico Process Oil Market Estimates and Forecasts, by Type (2020-2032) (USD Billion)
11.2.9.2 Mexico Process Oil Market Estimates and Forecasts, by Function (2020-2032) (USD Billion)
11.2.9.3 Mexico Process Oil Market Estimates and Forecasts, by Technology (2020-2032) (USD Billion)
11.2.9.4 Mexico Process Oil Market Estimates and Forecasts, by Application (2020-2032) (USD Billion)
11.3 Europe
11.3.1 Eastern Europe
11.3.1.1 Trends Analysis
11.3.1.2 Eastern Europe Process Oil Market Estimates and Forecasts, by Country (2020-2032) (USD Billion)
11.3.1.3 Eastern Europe Process Oil Market Estimates and Forecasts, by Type (2020-2032) (USD Billion)
11.3.1.4 Eastern Europe Process Oil Market Estimates and Forecasts, by Function (2020-2032) (USD Billion)
11.3.1.5 Eastern Europe Process Oil Market Estimates and Forecasts, by Technology (2020-2032) (USD Billion)
11.3.1.6 Eastern Europe Process Oil Market Estimates and Forecasts, by Application (2020-2032) (USD Billion)
11.3.1.7 Poland
11.3.1.7.1 Poland Process Oil Market Estimates and Forecasts, by Type (2020-2032) (USD Billion)
11.3.1.7.2 Poland Process Oil Market Estimates and Forecasts, by Function (2020-2032) (USD Billion)
11.3.1.7.3 Poland Process Oil Market Estimates and Forecasts, by Technology (2020-2032) (USD Billion)
11.3.1.7.4 Poland Process Oil Market Estimates and Forecasts, by Application (2020-2032) (USD Billion)
11.3.1.8 Romania
11.3.1.8.1 Romania Process Oil Market Estimates and Forecasts, by Type (2020-2032) (USD Billion)
11.3.1.8.2 Romania Process Oil Market Estimates and Forecasts, by Function (2020-2032) (USD Billion)
11.3.1.8.3 Romania Process Oil Market Estimates and Forecasts, by Technology (2020-2032) (USD Billion)
11.3.1.8.4 Romania Process Oil Market Estimates and Forecasts, by Application (2020-2032) (USD Billion)
11.3.1.9 Hungary
11.3.1.9.1 Hungary Process Oil Market Estimates and Forecasts, by Type (2020-2032) (USD Billion)
11.3.1.9.2 Hungary Process Oil Market Estimates and Forecasts, by Function (2020-2032) (USD Billion)
11.3.1.9.3 Hungary Process Oil Market Estimates and Forecasts, by Technology (2020-2032) (USD Billion)
11.3.1.9.4 Hungary Process Oil Market Estimates and Forecasts, by Application (2020-2032) (USD Billion)
11.3.1.10 Turkey
11.3.1.10.1 Turkey Process Oil Market Estimates and Forecasts, by Type (2020-2032) (USD Billion)
11.3.1.10.2 Turkey Process Oil Market Estimates and Forecasts, by Function (2020-2032) (USD Billion)
11.3.1.10.3 Turkey Process Oil Market Estimates and Forecasts, by Technology (2020-2032) (USD Billion)
11.3.1.10.4 Turkey Process Oil Market Estimates and Forecasts, by Application (2020-2032) (USD Billion)
11.3.1.11 Rest of Eastern Europe
11.3.1.11.1 Rest of Eastern Europe Process Oil Market Estimates and Forecasts, by Type (2020-2032) (USD Billion)
11.3.1.11.2 Rest of Eastern Europe Process Oil Market Estimates and Forecasts, by Function (2020-2032) (USD Billion)
11.3.1.11.3 Rest of Eastern Europe Process Oil Market Estimates and Forecasts, by Technology (2020-2032) (USD Billion)
11.3.1.11.4 Rest of Eastern Europe Process Oil Market Estimates and Forecasts, by Application (2020-2032) (USD Billion)
11.3.2 Western Europe
11.3.2.1 Trends Analysis
11.3.2.2 Western Europe Process Oil Market Estimates and Forecasts, by Country (2020-2032) (USD Billion)
11.3.2.3 Western Europe Process Oil Market Estimates and Forecasts, by Type (2020-2032) (USD Billion)
11.3.2.4 Western Europe Process Oil Market Estimates and Forecasts, by Function (2020-2032) (USD Billion)
11.3.2.5 Western Europe Process Oil Market Estimates and Forecasts, by Technology (2020-2032) (USD Billion)
11.3.2.6 Western Europe Process Oil Market Estimates and Forecasts, by Application (2020-2032) (USD Billion)
11.3.2.7 Germany
11.3.2.7.1 Germany Process Oil Market Estimates and Forecasts, by Type (2020-2032) (USD Billion)
11.3.2.7.2 Germany Process Oil Market Estimates and Forecasts, by Function (2020-2032) (USD Billion)
11.3.2.7.3 Germany Process Oil Market Estimates and Forecasts, by Technology (2020-2032) (USD Billion)
11.3.2.7.4 Germany Process Oil Market Estimates and Forecasts, by Application (2020-2032) (USD Billion)
11.3.2.8 France
11.3.2.8.1 France Process Oil Market Estimates and Forecasts, by Type (2020-2032) (USD Billion)
11.3.2.8.2 France Process Oil Market Estimates and Forecasts, by Function (2020-2032) (USD Billion)
11.3.2.8.3 France Process Oil Market Estimates and Forecasts, by Technology (2020-2032) (USD Billion)
11.3.2.8.4 France Process Oil Market Estimates and Forecasts, by Application (2020-2032) (USD Billion)
11.3.2.9 UK
11.3.2.9.1 UK Process Oil Market Estimates and Forecasts, by Type (2020-2032) (USD Billion)
11.3.2.9.2 UK Process Oil Market Estimates and Forecasts, by Function (2020-2032) (USD Billion)
11.3.2.9.3 UK Process Oil Market Estimates and Forecasts, by Technology (2020-2032) (USD Billion)
11.3.2.9.4 UK Process Oil Market Estimates and Forecasts, by Application (2020-2032) (USD Billion)
11.3.2.10 Italy
11.3.2.10.1 Italy Process Oil Market Estimates and Forecasts, by Type (2020-2032) (USD Billion)
11.3.2.10.2 Italy Process Oil Market Estimates and Forecasts, by Function (2020-2032) (USD Billion)
11.3.2.10.3 Italy Process Oil Market Estimates and Forecasts, by Technology (2020-2032) (USD Billion)
11.3.2.10.4 Italy Process Oil Market Estimates and Forecasts, by Application (2020-2032) (USD Billion)
11.3.2.11 Spain
11.3.2.11.1 Spain Process Oil Market Estimates and Forecasts, by Type (2020-2032) (USD Billion)
11.3.2.11.2 Spain Process Oil Market Estimates and Forecasts, by Function (2020-2032) (USD Billion)
11.3.2.11.3 Spain Process Oil Market Estimates and Forecasts, by Technology (2020-2032) (USD Billion)
11.3.2.11.4 Spain Process Oil Market Estimates and Forecasts, by Application (2020-2032) (USD Billion)
11.3.2.12 Netherlands
11.3.2.12.1 Netherlands Process Oil Market Estimates and Forecasts, by Type (2020-2032) (USD Billion)
11.3.2.12.2 Netherlands Process Oil Market Estimates and Forecasts, by Function (2020-2032) (USD Billion)
11.3.2.12.3 Netherlands Process Oil Market Estimates and Forecasts, by Technology (2020-2032) (USD Billion)
11.3.2.12.4 Netherlands Process Oil Market Estimates and Forecasts, by Application (2020-2032) (USD Billion)
11.3.2.13 Switzerland
11.3.2.13.1 Switzerland Process Oil Market Estimates and Forecasts, by Type (2020-2032) (USD Billion)
11.3.2.13.2 Switzerland Process Oil Market Estimates and Forecasts, by Function (2020-2032) (USD Billion)
11.3.2.13.3 Switzerland Process Oil Market Estimates and Forecasts, by Technology (2020-2032) (USD Billion)
11.3.2.13.4 Switzerland Process Oil Market Estimates and Forecasts, by Application (2020-2032) (USD Billion)
11.3.2.14 Austria
11.3.2.14.1 Austria Process Oil Market Estimates and Forecasts, by Type (2020-2032) (USD Billion)
11.3.2.14.2 Austria Process Oil Market Estimates and Forecasts, by Function (2020-2032) (USD Billion)
11.3.2.14.3 Austria Process Oil Market Estimates and Forecasts, by Technology (2020-2032) (USD Billion)
11.3.2.14.4 Austria Process Oil Market Estimates and Forecasts, by Application (2020-2032) (USD Billion)
11.3.2.15 Rest of Western Europe
11.3.2.15.1 Rest of Western Europe Process Oil Market Estimates and Forecasts, by Type (2020-2032) (USD Billion)
11.3.2.15.2 Rest of Western Europe Process Oil Market Estimates and Forecasts, by Function (2020-2032) (USD Billion)
11.3.2.15.3 Rest of Western Europe Process Oil Market Estimates and Forecasts, by Technology (2020-2032) (USD Billion)
11.3.2.15.4 Rest of Western Europe Process Oil Market Estimates and Forecasts, by Application (2020-2032) (USD Billion)
11.4 Asia Pacific
11.4.1 Trends Analysis
11.4.2 Asia Pacific Process Oil Market Estimates and Forecasts, by Country (2020-2032) (USD Billion)
11.4.3 Asia Pacific Process Oil Market Estimates and Forecasts, by Type (2020-2032) (USD Billion)
11.4.4 Asia Pacific Process Oil Market Estimates and Forecasts, by Function (2020-2032) (USD Billion)
11.4.5 Asia Pacific Process Oil Market Estimates and Forecasts, by Technology (2020-2032) (USD Billion)
11.4.6 Asia Pacific Process Oil Market Estimates and Forecasts, by Application (2020-2032) (USD Billion)
11.4.7 China
11.4.7.1 China Process Oil Market Estimates and Forecasts, by Type (2020-2032) (USD Billion)
11.4.7.2 China Process Oil Market Estimates and Forecasts, by Function (2020-2032) (USD Billion)
11.4.7.3 China Process Oil Market Estimates and Forecasts, by Technology (2020-2032) (USD Billion)
11.4.7.4 China Process Oil Market Estimates and Forecasts, by Application (2020-2032) (USD Billion)
11.4.8 India
11.4.8.1 India Process Oil Market Estimates and Forecasts, by Type (2020-2032) (USD Billion)
11.4.8.2 India Process Oil Market Estimates and Forecasts, by Function (2020-2032) (USD Billion)
11.4.8.3 India Process Oil Market Estimates and Forecasts, by Technology (2020-2032) (USD Billion)
11.4.8.4 India Process Oil Market Estimates and Forecasts, by Application (2020-2032) (USD Billion)
11.4.9 Japan
11.4.9.1 Japan Process Oil Market Estimates and Forecasts, by Type (2020-2032) (USD Billion)
11.4.9.2 Japan Process Oil Market Estimates and Forecasts, by Function (2020-2032) (USD Billion)
11.4.9.3 Japan Process Oil Market Estimates and Forecasts, by Technology (2020-2032) (USD Billion)
11.4.9.4 Japan Process Oil Market Estimates and Forecasts, by Application (2020-2032) (USD Billion)
11.4.10 South Korea
11.4.10.1 South Korea Process Oil Market Estimates and Forecasts, by Type (2020-2032) (USD Billion)
11.4.10.2 South Korea Process Oil Market Estimates and Forecasts, by Function (2020-2032) (USD Billion)
11.4.10.3 South Korea Process Oil Market Estimates and Forecasts, by Technology (2020-2032) (USD Billion)
11.4.10.4 South Korea Process Oil Market Estimates and Forecasts, by Application (2020-2032) (USD Billion)
11.4.11 Vietnam
11.4.11.1 Vietnam Process Oil Market Estimates and Forecasts, by Type (2020-2032) (USD Billion)
11.4.11.2 Vietnam Process Oil Market Estimates and Forecasts, by Function (2020-2032) (USD Billion)
11.4.11.3 Vietnam Process Oil Market Estimates and Forecasts, by Technology (2020-2032) (USD Billion)
11.4.11.4 Vietnam Process Oil Market Estimates and Forecasts, by Application (2020-2032) (USD Billion)
11.4.12 Singapore
11.4.12.1 Singapore Process Oil Market Estimates and Forecasts, by Type (2020-2032) (USD Billion)
11.4.12.2 Singapore Process Oil Market Estimates and Forecasts, by Function (2020-2032) (USD Billion)
11.4.12.3 Singapore Process Oil Market Estimates and Forecasts, by Technology (2020-2032) (USD Billion)
11.4.12.4 Singapore Process Oil Market Estimates and Forecasts, by Application (2020-2032) (USD Billion)
11.4.13 Australia
11.4.13.1 Australia Process Oil Market Estimates and Forecasts, by Type (2020-2032) (USD Billion)
11.4.13.2 Australia Process Oil Market Estimates and Forecasts, by Function (2020-2032) (USD Billion)
11.4.13.3 Australia Process Oil Market Estimates and Forecasts, by Technology (2020-2032) (USD Billion)
11.4.13.4 Australia Process Oil Market Estimates and Forecasts, by Application (2020-2032) (USD Billion)
11.4.14 Rest of Asia Pacific
11.4.14.1 Rest of Asia Pacific Process Oil Market Estimates and Forecasts, by Type (2020-2032) (USD Billion)
11.4.14.2 Rest of Asia Pacific Process Oil Market Estimates and Forecasts, by Function (2020-2032) (USD Billion)
11.4.14.3 Rest of Asia Pacific Process Oil Market Estimates and Forecasts, by Technology (2020-2032) (USD Billion)
11.4.14.4 Rest of Asia Pacific Process Oil Market Estimates and Forecasts, by Application (2020-2032) (USD Billion)
11.5 Middle East and Africa
11.5.1 Middle East
11.5.1.1 Trends Analysis
11.5.1.2 Middle East Process Oil Market Estimates and Forecasts, by Country (2020-2032) (USD Billion)
11.5.1.3 Middle East Process Oil Market Estimates and Forecasts, by Type (2020-2032) (USD Billion)
11.5.1.4 Middle East Process Oil Market Estimates and Forecasts, by Function (2020-2032) (USD Billion)
11.5.1.5 Middle East Process Oil Market Estimates and Forecasts, by Technology (2020-2032) (USD Billion)
11.5.1.6 Middle East Process Oil Market Estimates and Forecasts, by Application (2020-2032) (USD Billion)
11.5.1.7 UAE
11.5.1.7.1 UAE Process Oil Market Estimates and Forecasts, by Type (2020-2032) (USD Billion)
11.5.1.7.2 UAE Process Oil Market Estimates and Forecasts, by Function (2020-2032) (USD Billion)
11.5.1.7.3 UAE Process Oil Market Estimates and Forecasts, by Technology (2020-2032) (USD Billion)
11.5.1.7.4 UAE Process Oil Market Estimates and Forecasts, by Application (2020-2032) (USD Billion)
11.5.1.8 Egypt
11.5.1.8.1 Egypt Process Oil Market Estimates and Forecasts, by Type (2020-2032) (USD Billion)
11.5.1.8.2 Egypt Process Oil Market Estimates and Forecasts, by Function (2020-2032) (USD Billion)
11.5.1.8.3 Egypt Process Oil Market Estimates and Forecasts, by Technology (2020-2032) (USD Billion)
11.5.1.8.4 Egypt Process Oil Market Estimates and Forecasts, by Application (2020-2032) (USD Billion)
11.5.1.9 Saudi Arabia
11.5.1.9.1 Saudi Arabia Process Oil Market Estimates and Forecasts, by Type (2020-2032) (USD Billion)
11.5.1.9.2 Saudi Arabia Process Oil Market Estimates and Forecasts, by Function (2020-2032) (USD Billion)
11.5.1.9.3 Saudi Arabia Process Oil Market Estimates and Forecasts, by Technology (2020-2032) (USD Billion)
11.5.1.9.4 Saudi Arabia Process Oil Market Estimates and Forecasts, by Application (2020-2032) (USD Billion)
11.5.1.10 Qatar
11.5.1.10.1 Qatar Process Oil Market Estimates and Forecasts, by Type (2020-2032) (USD Billion)
11.5.1.10.2 Qatar Process Oil Market Estimates and Forecasts, by Function (2020-2032) (USD Billion)
11.5.1.10.3 Qatar Process Oil Market Estimates and Forecasts, by Technology (2020-2032) (USD Billion)
11.5.1.10.4 Qatar Process Oil Market Estimates and Forecasts, by Application (2020-2032) (USD Billion)
11.5.1.11 Rest of Middle East
11.5.1.11.1 Rest of Middle East Process Oil Market Estimates and Forecasts, by Type (2020-2032) (USD Billion)
11.5.1.11.2 Rest of Middle East Process Oil Market Estimates and Forecasts, by Function (2020-2032) (USD Billion)
11.5.1.11.3 Rest of Middle East Process Oil Market Estimates and Forecasts, by Technology (2020-2032) (USD Billion)
11.5.1.11.4 Rest of Middle East Process Oil Market Estimates and Forecasts, by Application (2020-2032) (USD Billion)
11.5.2 Africa
11.5.2.1 Trends Analysis
11.5.2.2 Africa Process Oil Market Estimates and Forecasts, by Country (2020-2032) (USD Billion)
11.5.2.3 Africa Process Oil Market Estimates and Forecasts, by Type (2020-2032) (USD Billion)
11.5.2.4 Africa Process Oil Market Estimates and Forecasts, by Function (2020-2032) (USD Billion)
11.5.2.5 Africa Process Oil Market Estimates and Forecasts, by Technology (2020-2032) (USD Billion)
11.5.2.6 Africa Process Oil Market Estimates and Forecasts, by Application (2020-2032) (USD Billion)
11.5.2.7 South Africa
11.5.2.7.1 South Africa Process Oil Market Estimates and Forecasts, by Type (2020-2032) (USD Billion)
11.5.2.7.2 South Africa Process Oil Market Estimates and Forecasts, by Function (2020-2032) (USD Billion)
11.5.2.7.3 South Africa Process Oil Market Estimates and Forecasts, by Technology (2020-2032) (USD Billion)
11.5.2.7.4 South Africa Process Oil Market Estimates and Forecasts, by Application (2020-2032) (USD Billion)
11.5.2.8 Nigeria
11.5.2.8.1 Nigeria Process Oil Market Estimates and Forecasts, by Type (2020-2032) (USD Billion)
11.5.2.8.2 Nigeria Process Oil Market Estimates and Forecasts, by Function (2020-2032) (USD Billion)
11.5.2.8.3 Nigeria Process Oil Market Estimates and Forecasts, by Technology (2020-2032) (USD Billion)
11.5.2.8.4 Nigeria Process Oil Market Estimates and Forecasts, by Application (2020-2032) (USD Billion)
11.5.2.9 Rest of Africa
11.5.2.9.1 Rest of Africa Process Oil Market Estimates and Forecasts, by Type (2020-2032) (USD Billion)
11.5.2.9.2 Rest of Africa Process Oil Market Estimates and Forecasts, by Function (2020-2032) (USD Billion)
11.5.2.9.3 Rest of Africa Process Oil Market Estimates and Forecasts, by Technology (2020-2032) (USD Billion)
11.5.2.9.4 Rest of Africa Process Oil Market Estimates and Forecasts, by Application (2020-2032) (USD Billion)
11.6 Latin America
11.6.1 Trends Analysis
11.6.2 Latin America Process Oil Market Estimates and Forecasts, by Country (2020-2032) (USD Billion)
11.6.3 Latin America Process Oil Market Estimates and Forecasts, by Type (2020-2032) (USD Billion)
11.6.4 Latin America Process Oil Market Estimates and Forecasts, by Function (2020-2032) (USD Billion)
11.6.5 Latin America Process Oil Market Estimates and Forecasts, by Technology (2020-2032) (USD Billion)
11.6.6 Latin America Process Oil Market Estimates and Forecasts, by Application (2020-2032) (USD Billion)
11.6.7 Brazil
11.6.7.1 Brazil Process Oil Market Estimates and Forecasts, by Type (2020-2032) (USD Billion)
11.6.7.2 Brazil Process Oil Market Estimates and Forecasts, by Function (2020-2032) (USD Billion)
11.6.7.3 Brazil Process Oil Market Estimates and Forecasts, by Technology (2020-2032) (USD Billion)
11.6.7.4 Brazil Process Oil Market Estimates and Forecasts, by Application (2020-2032) (USD Billion)
11.6.8 Argentina
11.6.8.1 Argentina Process Oil Market Estimates and Forecasts, by Type (2020-2032) (USD Billion)
11.6.8.2 Argentina Process Oil Market Estimates and Forecasts, by Function (2020-2032) (USD Billion)
11.6.8.3 Argentina Process Oil Market Estimates and Forecasts, by Technology (2020-2032) (USD Billion)
11.6.8.4 Argentina Process Oil Market Estimates and Forecasts, by Application (2020-2032) (USD Billion)
11.6.9 Colombia
11.6.9.1 Colombia Process Oil Market Estimates and Forecasts, by Type (2020-2032) (USD Billion)
11.6.9.2 Colombia Process Oil Market Estimates and Forecasts, by Function (2020-2032) (USD Billion)
11.6.9.3 Colombia Process Oil Market Estimates and Forecasts, by Technology (2020-2032) (USD Billion)
11.6.9.4 Colombia Process Oil Market Estimates and Forecasts, by Application (2020-2032) (USD Billion)
11.6.10 Rest of Latin America
11.6.10.1 Rest of Latin America Process Oil Market Estimates and Forecasts, by Type (2020-2032) (USD Billion)
11.6.10.2 Rest of Latin America Process Oil Market Estimates and Forecasts, by Function (2020-2032) (USD Billion)
11.6.10.3 Rest of Latin America Process Oil Market Estimates and Forecasts, by Technology (2020-2032) (USD Billion)
11.6.10.4 Rest of Latin America Process Oil Market Estimates and Forecasts, by Application (2020-2032) (USD Billion)
12. Company Profiles
12.1 Shell plc
12.1.1 Company Overview
12.1.2 Financial
12.1.3 Products/ Services Offered
12.1.4 SWOT Analysis
12.2 Exxon Mobil Corporation
12.2.1 Company Overview
12.2.2 Financial
12.2.3 Products/ Services Offered
12.2.4 SWOT Analysis
12.3 TotalEnergies
12.3.1 Company Overview
12.3.2 Financial
12.3.3 Products/ Services Offered
12.3.4 SWOT Analysis
12.4 Idemitsu Kosan Co., Ltd.
12.4.1 Company Overview
12.4.2 Financial
12.4.3 Products/ Services Offered
12.4.4 SWOT Analysis
12.5 Indian Oil Corporation Ltd
12.5.1 Company Overview
12.5.2 Financial
12.5.3 Products/ Services Offered
12.5.4 SWOT Analysis
12.6 Petroliam Nasional Berhad (PETRONAS)
12.6.1 Company Overview
12.6.2 Financial
12.6.3 Products/ Services Offered
12.6.4 SWOT Analysis
12.7 HollyFrontier Refining & Marketing LLC (HollyFrontier)
12.7.1 Company Overview
12.7.2 Financial
12.7.3 Products/ Services Offered
12.7.4 SWOT Analysis
12.8 Nynas AB
12.8.1 Company Overview
12.8.2 Financial
12.8.3 Products/ Services Offered
12.8.4 SWOT Analysis
12.9 H&R Group
12.9.1 Company Overview
12.9.2 Financial
12.9.3 Products/ Services Offered
12.9.4 SWOT Analysis
12.10 Repsol
12.10.1 Company Overview
12.10.2 Financial
12.10.3 Products/ Services Offered
12.10.4 SWOT Analysis
13. Use Cases and Best Practices
14. Conclusion
An accurate research report requires proper strategizing as well as implementation. There are multiple factors involved in the completion of good and accurate research report and selecting the best methodology to compete the research is the toughest part. Since the research reports we provide play a crucial role in any company’s decision-making process, therefore we at SNS Insider always believe that we should choose the best method which gives us results closer to reality. This allows us to reach at a stage wherein we can provide our clients best and accurate investment to output ratio.
Each report that we prepare takes a timeframe of 350-400 business hours for production. Starting from the selection of titles through a couple of in-depth brain storming session to the final QC process before uploading our titles on our website we dedicate around 350 working hours. The titles are selected based on their current market cap and the foreseen CAGR and growth.
The 5 steps process:
Step 1: Secondary Research:
Secondary Research or Desk Research is as the name suggests is a research process wherein, we collect data through the readily available information. In this process we use various paid and unpaid databases which our team has access to and gather data through the same. This includes examining of listed companies’ annual reports, Journals, SEC filling etc. Apart from this our team has access to various associations across the globe across different industries. Lastly, we have exchange relationships with various university as well as individual libraries.

Step 2: Primary Research
When we talk about primary research, it is a type of study in which the researchers collect relevant data samples directly, rather than relying on previously collected data. This type of research is focused on gaining content specific facts that can be sued to solve specific problems. Since the collected data is fresh and first hand therefore it makes the study more accurate and genuine.
We at SNS Insider have divided Primary Research into 2 parts.
Part 1 wherein we interview the KOLs of major players as well as the upcoming ones across various geographic regions. This allows us to have their view over the market scenario and acts as an important tool to come closer to the accurate market numbers. As many as 45 paid and unpaid primary interviews are taken from both the demand and supply side of the industry to make sure we land at an accurate judgement and analysis of the market.
This step involves the triangulation of data wherein our team analyses the interview transcripts, online survey responses and observation of on filed participants. The below mentioned chart should give a better understanding of the part 1 of the primary interview.

Part 2: In this part of primary research the data collected via secondary research and the part 1 of the primary research is validated with the interviews from individual consultants and subject matter experts.
Consultants are those set of people who have at least 12 years of experience and expertise within the industry whereas Subject Matter Experts are those with at least 15 years of experience behind their back within the same space. The data with the help of two main processes i.e., FGDs (Focused Group Discussions) and IDs (Individual Discussions). This gives us a 3rd party nonbiased primary view of the market scenario making it a more dependable one while collation of the data pointers.
Step 3: Data Bank Validation
Once all the information is collected via primary and secondary sources, we run that information for data validation. At our intelligence centre our research heads track a lot of information related to the market which includes the quarterly reports, the daily stock prices, and other relevant information. Our data bank server gets updated every fortnight and that is how the information which we collected using our primary and secondary information is revalidated in real time.

Step 4: QA/QC Process
After all the data collection and validation our team does a final level of quality check and quality assurance to get rid of any unwanted or undesired mistakes. This might include but not limited to getting rid of the any typos, duplication of numbers or missing of any important information. The people involved in this process include technical content writers, research heads and graphics people. Once this process is completed the title gets uploader on our platform for our clients to read it.
Step 5: Final QC/QA Process:
This is the last process and comes when the client has ordered the study. In this process a final QA/QC is done before the study is emailed to the client. Since we believe in giving our clients a good experience of our research studies, therefore, to make sure that we do not lack at our end in any way humanly possible we do a final round of quality check and then dispatch the study to the client.
Key Segments:
By Type
Naphthenic
Paraffinic
Non-carcinogenic
Aromatic
By Function
Extender Oil
Plasticizer
Solvent
Defoamer
Others
By Technology
Convention Route
Gas to Liquid
Bio-base
By Application
Rubber Processing
Adhesives & Sealants
Consumer Products
Paints & Coatings
Pharmaceuticals
Polymers
Others
Request for Segment Customization as per your Business Requirement: Segment Customization Request
Regional Coverage:
North America
US
Canada
Mexico
Europe
Eastern Europe
Poland
Romania
Hungary
Turkey
Rest of Eastern Europe
Western Europe
Germany
France
UK
Italy
Spain
Netherlands
Switzerland
Austria
Rest of Western Europe
Asia Pacific
China
India
Japan
South Korea
Vietnam
Singapore
Australia
Rest of Asia Pacific
Middle East & Africa
Middle East
UAE
Egypt
Saudi Arabia
Qatar
Rest of Middle East
Africa
Nigeria
South Africa
Rest of Africa
Latin America
Brazil
Argentina
Colombia
Rest of Latin America
Request for Country Level Research Report: Country Level Customization Request
Available Customization
With the given market data, SNS Insider offers customization as per the company’s specific needs. The following customization options are available for the report:
Detailed Volume Analysis
Criss-Cross segment analysis (e.g. Product X Application)
Competitive Product Benchmarking
Geographic Analysis
Additional countries in any of the regions
Customized Data Representation
Detailed analysis and profiling of additional market players
The Concrete Restoration Market size was valued at USD 17.1 Billion in 2023. It is expected to grow to USD 31.8 Billion by 2032 and grow at a CAGR of 6.4% over the forecast period of 2024-2032.
The Agrochemicals Market was USD 253.6 billion in 2023 and is expected to reach USD 354.8 billion by 2032, growing at a CAGR of 3.8% over the forecast period of 2024-2032.
The Lubricant Additives Market size was valued at USD 17.58 Billion in 2023 & will grow to USD 25.01 Billion by 2032 and grow at a CAGR of 4% by 2024-2032.
The Biostimulants Market Size was valued at USD 6.1 billion in 2023, and is expected to reach USD 11.9 billion by 2032, and grow at a CAGR of 7.7% over the forecast period 2024-2032.
The Sustainable Adhesives Market was USD 2.51 Billion in 2023 and is expected to reach USD 4.12 Billion by 2032, growing at a CAGR of 5.66 % from 2024 to 2032.
The Green and Bio Polyols market size was valued at USD 5.11 billion in 2023 and is expected to reach USD 10.87 billion by 2032 and grow at a CAGR of 8.75% over the forecast period 2024-2032.

Hi! Click one of our member below to chat on Phone
© 2025 All Rights Reserved by SNS Insider Pvt Ltd


