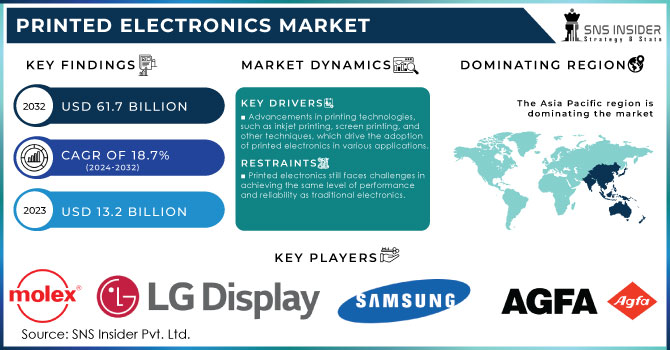
The Printed Electronics Market Size was valued at USD 12.94 billion in 2023, and is expected to reach USD 72.08 billion by 2032, and grow at a CAGR of 21.03 % over the forecast period 2024-2032. Key market drivers include increasing demand for lightweight and flexible electronic devices, advancements in printing technologies, and the rising adoption of printed electronics in various applications such as packaging, wearables, and sensors. Material utilization varies by region, with North America and Asia-Pacific leading due to strong manufacturing bases and innovation hubs. Additionally, consumer behavior trends indicate a growing acceptance of printed electronics, driven by sustainability concerns and demand for customized solutions. However, failure rates remain a challenge, emphasizing the need for improved reliability. Environmental metrics analysis highlights the lower carbon footprint of printed electronics compared to traditional manufacturing methods, enhancing their appeal in environmentally conscious markets.
Get more information on Printed Electronics Market - Request Sample Report
Drivers:
Rising demand for lightweight, flexible electronics in wearables and sensors is boosting printed electronics adoption and adaptability.
The growing demand for lightweight and flexible electronic devices is revolutionizing sectors such as wearables, sensors, and packaging. Printed electronics play a crucial role in this shift, providing unique benefits like adaptability, reduced weight, and enhanced functionality. Notably, flexible gold/polyurethane (Au/PU) electrodes significantly improve myoelectric signal testing, achieving an impressive signal-to-noise ratio of 21.29 dB and 92.4% accuracy, surpassing traditional metal electrodes' 12.06 dB and 83.1% accuracy. Their ability to conform to the human body’s changing morphology enhances their clinical relevance, with innovations such as a 3D-structured flexible device enabling continuous recording of neuro-organ physiological electrical signals for up to 120 days. However, ongoing challenges in fabrication technology must be addressed to fully realize the potential of these applications in the market.
Restraints:
High Production Costs Are Limiting the Widespread Adoption Of Printed Electronics Market
The adoption of printed electronics faces significant challenges due to high production costs, which particularly affect smaller manufacturers and limit widespread market penetration. These elevated costs are primarily attributed to the need for advanced materials, specialized printing techniques, and state-of-the-art equipment. For example, while specific pricing data for graphene is hard to obtain, recent estimates indicate that its commercial cost can range from USD100 to USD10,000 per kilogram. This price variability arises from several factors, including production method, form, quality, and quantity, making it a costly material to incorporate into printed electronic devices. Furthermore, the complexity of manufacturing processes for printed electronics adds to the financial burden, hindering innovation and slowing industry growth. As a result, many potential players find it difficult to compete with established companies that benefit from economies of scale and existing infrastructure. Addressing these production cost challenges is crucial for fostering a more competitive and accessible market for printed electronics, enabling broader adoption across various applications.
Opportunities:
Growth Potential for Printed Electronics in the Expanding Wearable Technology Market
The rising popularity of wearable technology, such as fitness trackers, smartwatches, and health monitors, presents a substantial opportunity for the printed electronics market. These devices require flexible, lightweight, and cost-effective components that traditional electronics often cannot provide. Printed electronics, utilizing innovative materials and manufacturing processes, can create thin, conformable sensors that seamlessly integrate into various wearable formats. This flexibility allows for improved user comfort and performance, enhancing functionality, such as real-time health monitoring and activity tracking. Moreover, as consumer demand for customization increases, printed electronics can be tailored to meet specific needs, further driving adoption in the rapidly growing wearable market. The synergy between printed electronics and wearables fosters innovation and expands market potential.
Challenges:
Challenges in finding high-performance materials compatible with printing processes limit the advancement of printed electronics.
The advancement of printed electronics is constrained by the limited availability of suitable materials that balance performance, flexibility, and manufacturability. Conductive inks, essential for printed circuits, often rely on silver or graphene, which can be expensive or challenging to process consistently. Organic and polymer-based materials offer flexibility but may lack the necessary conductivity and durability for long-term applications. Additionally, achieving strong adhesion between printed layers and various substrates remains problematic, affecting device reliability. Researchers are exploring alternative materials, such as carbon nanotubes and hybrid composites, but scalability and cost-efficiency remain barriers. Overcoming these material limitations is essential for expanding printed electronics into mainstream applications like flexible displays, smart packaging, and medical sensors.
By Material
The Ink segment held the largest revenue share of approximately 70% in the Printed Electronics Market in 2023, driven by its crucial role in enabling high-performance, flexible, and cost-effective electronic components. Conductive inks, including silver, copper, and carbon-based formulations, are widely used for their excellent electrical properties and compatibility with various substrates. Advancements in nanoparticle-based inks have further enhanced conductivity, flexibility, and durability, expanding their applications in printed circuits, sensors, and RFID tags. The growing demand for sustainable and low-cost manufacturing has also fueled innovation in eco-friendly and water-based inks. As the market evolves, continuous research into improving ink formulations will be key to enhancing the efficiency and scalability of printed electronics production.
The Substrate segment is the fastest-growing segment in the Printed Electronics Market during the forecast period of 2024-2032, Due to advancements in flexible and lightweight materials Duet also emphasizes the significance of substrates in printed electronics, impacting durability, conductivity, and functionality. Polyethylene terephthalate (PET) has become popular due to its inexpensive, flexible nature, as well as compatibility with high element printing which can procreate high information plates. Growth in this segment is further accelerated by the growing demand for flexible displays, wearables devices, and smart packaging. Further, the development of biodegradable and recyclable substrates is supporting sustainability efforts, making them an appealing option for eco-conscious manufacturers.
By Technology
The Screen Printing segment dominated the Printed Electronics Market with around 60% revenue share in 2023, driven by its versatility, cost-effectiveness, and ability to produce high-precision conductive patterns. Screen printing is widely used for manufacturing flexible circuits, sensors, RFID tags, and photovoltaic cells due to its scalability and compatibility with various substrates, including plastic, glass, and textiles. The process allows for the deposition of thick ink layers, enhancing conductivity and durability, making it ideal for applications requiring robust electrical performance. Additionally, continuous advancements in ink formulations, including nanoparticle-based conductive inks, are further improving efficiency and resolution. As industries such as consumer electronics, automotive, and healthcare expand their adoption of printed electronics, screen printing remains a preferred choice due to its reliability, adaptability to mass production, and lower production costs compared to other printing techniques.
The inkjet printing segment is the fastest-growing in the printed electronics market, expected to expand significantly over the forecast period 2024-2032. This growth is attributed to its capability to facilitate high-resolution, contactless, and material-efficient printing, thus it is considered suitable for applications where deposition of conductive inks needs to be highly precise. Inkjet printing has been widely applied in flexible circuits, OLED displays, biomedical sensors, and smart packaging because it can be rapidly prototyped and customized in a mask less/screen less manner. Furthermore, its capability to adhere to diverse substrates such as plastics, paper, and textiles also contributes to its industry-wide adoption. Its expansion is also further driven by a growing need for miniaturized and flexible electronic components in consumer electronics, healthcare, and automotive industries. Continuous developments in nanoparticle-based conductive inks and multi-material printing techniques are upgrading performance, turning inkjet printing into a compelling choice for manufacturers looking for cost-effective, scalable, and environmentally sustainable manufacturing methods.
By Device
The Displays segment accounted for the largest revenue share of approximately 57% in the printed electronics market in 2023, driven by the increasing demand for flexible, lightweight, and cost-effective display solutions. Printed electronics are widely used in OLED, LCD, and e-paper displays, offering advantages such as reduced production costs, improved energy efficiency, and enhanced design flexibility. The growing adoption of wearable devices, smartphones, digital signage, and automotive displays has further fueled this segment’s dominance. Additionally, advancements in organic and inorganic semiconductor materials have improved the performance and durability of printed displays, making them more competitive with traditional display technologies. The expansion of smart consumer electronics and IoT applications has also contributed to increased demand for printed displays, as they enable thinner and more customizable form factors. Moving forward, continuous innovations in printing techniques and material science will further enhance the adoption of printed displays in various industries, solidifying their market leadership over the forecast period.
The RFID segment is the fastest-growing in the printed electronics market over the forecast period 2024-2032, driven by increasing demand for cost-effective, flexible, and scalable tracking solutions across industries. Printed RFID tags offer advantages such as lower production costs, lightweight structures, and improved integration into various applications, including retail, logistics, healthcare, and smart packaging. The rise of e-commerce and supply chain automation has further fueled the adoption of RFID for real-time inventory tracking and asset management. Additionally, advancements in conductive inks and printing techniques have enhanced the durability and performance of printed RFID tags, making them more reliable for widespread use. As industries increasingly shift toward digitalization and IoT-based smart tracking systems, the adoption of printed RFID technology is expected to accelerate, providing seamless connectivity and operational efficiency.
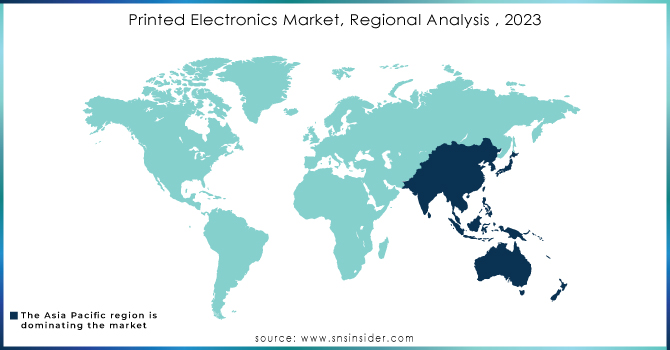
Asia-Pacific dominated the printed electronics market with a 41% revenue share in 2023 and is expected to grow at the highest CAGR over the forecast period 2024-2032. This growth is being driven by the region's robust consumer electronics manufacturing sector, swift industrialization, and the rising use of smart technologies in the automotive, healthcare, and packaging industries. Regions such as China, Japan and South Korea are continually providing investments for R&D that aids in breakthrough of flexible low-cost printed electronics. Government initiatives promoting smart manufacturing and IoT integration also rise demand. Similarly, Asia-Pacific’s large supply chain, supporting players in the market, and comparatively lower production costs garner a considerable amount of investments from around the globe. The region’s transition toward miniaturization and light-weight, flexible devices makes it more effective for applications in burgeoning fields, such as smart wearables and medical sensors. In addition, rising acceptance of RFID and OLED displays in retail and automotive sectors boost the market growth. Asia Pacific is leading the global printed electronics market with its relatively advanced technology and high-volume production capabilities.
Get Customized Report as per your Business Requirement - Request For Customized Report
Some of the Major Players in Printed Electronics Market along with their products:
BASF SE (Germany) - Conductive inks
DuPont (U.S.) - Inks and substrates
Molex, Inc. (U.S.) - Connectors and components
PARC, a Xerox company (U.S.) - Technologies for printed electronics
E-Ink Holdings, Inc. (Taiwan) - Electronic ink
Thin Film Electronics ASA (Norway) - NFC tags
Samsung Electronics Co., Ltd. (South Korea) - Display technologies
LG Display Co., Ltd. (South Korea) - OLED and LCD panels
Agfa-Gevaert Group (Belgium) - Inks for printed electronics
Nissha Co., Ltd. (Japan) - Printed electronics solutions
NovaCentrix (U.S.) - Conductive inks and materials
List of potential customers for printed electronics, along with specific companies in each category:
Consumer Electronics Manufacturers:
Apple Inc.
Samsung Electronics
Sony Corporation
Automotive Manufacturers:
Ford Motor Company
Tesla, Inc.
General Motors
Medical Device Companies:
Medtronic
Philips Healthcare
Abbott Laboratories
Packaging Companies:
Amcor
Smurfit Kappa Group
WestRock
Retail and Brand Owners:
Procter & Gamble
Unilever
Coca-Cola Company
Industrial Automation Firms:
Siemens
Rockwell Automation
Honeywell
IoT Device Developers:
Nest (Google)
Cisco Systems
Intel Corporation
Aerospace and Defense Contractors:
Boeing
Lockheed Martin
Northrop Grumman
Telecommunication Companies:
Verizon Communications
AT&T Inc.
Huawei Technologies
15 Aug 2024, BASF partners for the California Research collaborate (CARA) team with UC San Diego and developed a new 3D software system for desktop soft robotic devices using Ultrafuse TPU This method allows for the engineering of monolithic, sealed actuators and valves all in one print process, culminating in softer, biomimetic robots capable of autonomously grasping and releasing items without the need for manual assembly or post-processing.
On February 7, 2025, Samsung Electronics Co., Ltd. introduced its next generation of commercial displays featuring energy-efficient Samsung Color E-Paper and AI-powered solutions at Integrated Systems Europe (ISE) 2025. These, on display at booth 3F500, respond to market needs for greater energy efficiency and immersive experiences, while features such as SmartThings Pro and a 115” Smart Signage screen give companies the ability to improve usability and control of their business.
Report Attributes | Details |
Market Size in 2023 | USD 12.94 Billion |
Market Size by 2032 | USD 72.08 Billion |
CAGR | CAGR of 21.03% From 2024 to 2032 |
Base Year | 2023 |
Forecast Period | 2024-2032 |
Historical Data | 2020-2022 |
Report Scope & Coverage | Market Size, Segments Analysis, Competitive Landscape, Regional Analysis, DROC & SWOT Analysis, Forecast Outlook |
Key Segments | • By Material (Ink, Substrate) • By Technology (Inkjet, Screen, Gravure, Flexographic) • By Device (Displays, Photovoltaic, Lighting, RFID, Others) |
Regional Analysis/Coverage | North America (US, Canada, Mexico), Europe (Eastern Europe [Poland, Romania, Hungary, Turkey, Rest of Eastern Europe] Western Europe] Germany, France, UK, Italy, Spain, Netherlands, Switzerland, Austria, Rest of Western Europe]), Asia Pacific (China, India, Japan, South Korea, Vietnam, Singapore, Australia, Rest of Asia Pacific), Middle East & Africa (Middle East [UAE, Egypt, Saudi Arabia, Qatar, Rest of Middle East], Africa [Nigeria, South Africa, Rest of Africa], Latin America (Brazil, Argentina, Colombia, Rest of Latin America) |
Company Profiles | BASF SE (Germany), DuPont (U.S.), Molex, Inc. (U.S.), PARC, a Xerox company (U.S.), E-Ink Holdings, Inc. (Taiwan), Thin Film Electronics ASA (Norway), Samsung Electronics Co., Ltd. (South Korea), LG Display Co., Ltd. (South Korea), Agfa-Gevaert Group (Belgium), Nissha Co., Ltd. (Japan), NovaCentrix (U.S.). |
Ans: Asia-Pacific dominated the Printed Electronics Market in 2023
Ans: The “Ink” segment dominated the Printed Electronics Market.
Ans: Advancements in flexible electronics, growing demand for wearable devices, increasing adoption in automotive and healthcare, and cost-effective mass production are key drivers of the printed electronics market.
Ans: The Printed Electronics Market was USD 12.94 billion in 2023 and is expected to Reach USD 72.08 billion by 2032.
Ans: The Printed Electronics Market is expected to grow at a CAGR of 21.03% during 2024-2032.
Table of Content
1. Introduction
1.1 Market Definition
1.2 Scope (Inclusion and Exclusions)
1.3 Research Assumptions
2. Executive Summary
2.1 Market Overview
2.2 Regional Synopsis
2.3 Competitive Summary
3. Research Methodology
3.1 Top-Down Approach
3.2 Bottom-up Approach
3.3. Data Validation
3.4 Primary Interviews
4. Market Dynamics Impact Analysis
4.1 Market Driving Factors Analysis
4.1.1 Drivers
4.1.2 Restraints
4.1.3 Opportunities
4.1.4 Challenges
4.2 PESTLE Analysis
4.3 Porter’s Five Forces Model
5. Statistical Insights and Trends Reporting
5.1 Material Utilization by Region
5.2 Failure Rates
5.3 Consumer Behavior Trends
5.4 Environmental Metrics Analysis by Region
6. Competitive Landscape
6.1 List of Major Companies, By Region
6.2 Market Share Analysis, By Region
6.3 Product Benchmarking
6.3.1 Product specifications and features
6.3.2 Pricing
6.4 Strategic Initiatives
6.4.1 Marketing and promotional activities
6.4.2 Distribution and supply chain strategies
6.4.3 Expansion plans and new product launches
6.4.4 Strategic partnerships and collaborations
6.5 Technological Advancements
6.6 Market Positioning and Branding
7. Printed Electronics Market Segmentation, by Material
7.1 Chapter Overview
7.2 Ink
7.2.1 Ink Market Trends Analysis (2020-2032)
7.2.2 Ink Market Size Estimates and Forecasts to 2032 (USD Billion)
7.3 Substrate
7.3.1 Substrate Market Trends Analysis (2020-2032)
7.3.2 Substrate Market Size Estimates and Forecasts to 2032 (USD Billion)
8. Printed Electronics Market Segmentation, by Technology
8.1 Chapter Overview
8.2 Inkjet
8.2.1 Inkjet Market Trends Analysis (2020-2032)
8.2.2 Inkjet Market Size Estimates and Forecasts to 2032 (USD Billion)
8.3 Screen
8.3.1 Screen Market Trends Analysis (2020-2032)
8.3.2 Screen Market Size Estimates and Forecasts to 2032 (USD Billion)
8.4 Gravure
8.4.1 Gravure Market Trends Analysis (2020-2032)
8.4.2 Gravure Market Size Estimates and Forecasts to 2032 (USD Billion)
8.5 Flexographic
8.5.1 Flexographic Market Trends Analysis (2020-2032)
8.5.2 Flexographic Market Size Estimates and Forecasts to 2032 (USD Billion)
9. Printed Electronics Market Segmentation, by Device
9.1 Chapter Overview
9.2 Displays
9.2.1 Displays Market Trends Analysis (2020-2032)
9.2.2 Displays Market Size Estimates and Forecasts to 2032 (USD Billion)
9.3 Photovoltaic
9.3.1 Photovoltaic Market Trends Analysis (2020-2032)
9.3.2 Photovoltaic Market Size Estimates and Forecasts to 2032 (USD Billion)
9.4 Lighting
9.4.1 Lighting Market Trends Analysis (2020-2032)
9.4.2 Lighting Market Size Estimates and Forecasts to 2032 (USD Billion)
9.5 RFID
9.5.1 RFID Market Trends Analysis (2020-2032)
9.5.2 RFID Market Size Estimates and Forecasts to 2032 (USD Billion)
9.6 Others
9.6.1 Others Market Trends Analysis (2020-2032)
9.6.2 Others Market Size Estimates and Forecasts to 2032 (USD Billion)
10. Regional Analysis
10.1 Chapter Overview
10.2 North America
10.2.1 Trends Analysis
10.2.2 North America Printed Electronics Market Estimates and Forecasts, by Country (2020-2032) (USD Billion)
10.2.3 North America Printed Electronics Market Estimates and Forecasts, by Material (2020-2032) (USD Billion)
10.2.4 North America Printed Electronics Market Estimates and Forecasts, by Technology (2020-2032) (USD Billion)
10.2.5 North America Printed Electronics Market Estimates and Forecasts, by Device (2020-2032) (USD Billion)
10.2.6 USA
10.2.6.1 USA Printed Electronics Market Estimates and Forecasts, by Material (2020-2032) (USD Billion)
10.2.6.2 USA Printed Electronics Market Estimates and Forecasts, by Technology (2020-2032) (USD Billion)
10.2.6.3 USA Printed Electronics Market Estimates and Forecasts, by Device (2020-2032) (USD Billion)
10.2.7 Canada
10.2.7.1 Canada Printed Electronics Market Estimates and Forecasts, by Material (2020-2032) (USD Billion)
10.2.7.2 Canada Printed Electronics Market Estimates and Forecasts, by Technology (2020-2032) (USD Billion)
10.2.7.3 Canada Printed Electronics Market Estimates and Forecasts, by Device (2020-2032) (USD Billion)
10.2.8 Mexico
10.2.8.1 Mexico Printed Electronics Market Estimates and Forecasts, by Material (2020-2032) (USD Billion)
10.2.8.2 Mexico Printed Electronics Market Estimates and Forecasts, by Technology (2020-2032) (USD Billion)
10.2.8.3 Mexico Printed Electronics Market Estimates and Forecasts, by Device (2020-2032) (USD Billion)
10.3 Europe
10.3.1 Eastern Europe
10.3.1.1 Trends Analysis
10.3.1.2 Eastern Europe Printed Electronics Market Estimates and Forecasts, by Country (2020-2032) (USD Billion)
10.3.1.3 Eastern Europe Printed Electronics Market Estimates and Forecasts, by Material (2020-2032) (USD Billion)
10.3.1.4 Eastern Europe Printed Electronics Market Estimates and Forecasts, by Technology (2020-2032) (USD Billion)
10.3.1.5 Eastern Europe Printed Electronics Market Estimates and Forecasts, by Device (2020-2032) (USD Billion)
10.3.1.6 Poland
10.3.1.6.1 Poland Printed Electronics Market Estimates and Forecasts, by Material (2020-2032) (USD Billion)
10.3.1.6.2 Poland Printed Electronics Market Estimates and Forecasts, by Technology (2020-2032) (USD Billion)
10.3.1.6.3 Poland Printed Electronics Market Estimates and Forecasts, by Device (2020-2032) (USD Billion)
10.3.1.7 Romania
10.3.1.7.1 Romania Printed Electronics Market Estimates and Forecasts, by Material (2020-2032) (USD Billion)
10.3.1.7.2 Romania Printed Electronics Market Estimates and Forecasts, by Technology (2020-2032) (USD Billion)
10.3.1.7.3 Romania Printed Electronics Market Estimates and Forecasts, by Device (2020-2032) (USD Billion)
10.3.1.8 Hungary
10.3.1.8.1 Hungary Printed Electronics Market Estimates and Forecasts, by Material (2020-2032) (USD Billion)
10.3.1.8.2 Hungary Printed Electronics Market Estimates and Forecasts, by Technology (2020-2032) (USD Billion)
10.3.1.8.3 Hungary Printed Electronics Market Estimates and Forecasts, by Device (2020-2032) (USD Billion)
10.3.1.9 Turkey
10.3.1.9.1 Turkey Printed Electronics Market Estimates and Forecasts, by Material (2020-2032) (USD Billion)
10.3.1.9.2 Turkey Printed Electronics Market Estimates and Forecasts, by Technology (2020-2032) (USD Billion)
10.3.1.9.3 Turkey Printed Electronics Market Estimates and Forecasts, by Device (2020-2032) (USD Billion)
10.3.1.10 Rest of Eastern Europe
10.3.1.10.1 Rest of Eastern Europe Printed Electronics Market Estimates and Forecasts, by Material (2020-2032) (USD Billion)
10.3.1.10.2 Rest of Eastern Europe Printed Electronics Market Estimates and Forecasts, by Technology (2020-2032) (USD Billion)
10.3.1.10.3 Rest of Eastern Europe Printed Electronics Market Estimates and Forecasts, by Device (2020-2032) (USD Billion)
10.3.2 Western Europe
10.3.2.1 Trends Analysis
10.3.2.2 Western Europe Printed Electronics Market Estimates and Forecasts, by Country (2020-2032) (USD Billion)
10.3.2.3 Western Europe Printed Electronics Market Estimates and Forecasts, by Material (2020-2032) (USD Billion)
10.3.2.4 Western Europe Printed Electronics Market Estimates and Forecasts, by Technology (2020-2032) (USD Billion)
10.3.2.5 Western Europe Printed Electronics Market Estimates and Forecasts, by Device (2020-2032) (USD Billion)
10.3.2.6 Germany
10.3.2.6.1 Germany Printed Electronics Market Estimates and Forecasts, by Material (2020-2032) (USD Billion)
10.3.2.6.2 Germany Printed Electronics Market Estimates and Forecasts, by Technology (2020-2032) (USD Billion)
10.3.2.6.3 Germany Printed Electronics Market Estimates and Forecasts, by Device (2020-2032) (USD Billion)
10.3.2.7 France
10.3.2.7.1 France Printed Electronics Market Estimates and Forecasts, by Material (2020-2032) (USD Billion)
10.3.2.7.2 France Printed Electronics Market Estimates and Forecasts, by Technology (2020-2032) (USD Billion)
10.3.2.7.3 France Printed Electronics Market Estimates and Forecasts, by Device (2020-2032) (USD Billion)
10.3.2.8 UK
10.3.2.8.1 UK Printed Electronics Market Estimates and Forecasts, by Material (2020-2032) (USD Billion)
10.3.2.8.2 UK Printed Electronics Market Estimates and Forecasts, by Technology (2020-2032) (USD Billion)
10.3.2.8.3 UK Printed Electronics Market Estimates and Forecasts, by Device (2020-2032) (USD Billion)
10.3.2.9 Italy
10.3.2.9.1 Italy Printed Electronics Market Estimates and Forecasts, by Material (2020-2032) (USD Billion)
10.3.2.9.2 Italy Printed Electronics Market Estimates and Forecasts, by Technology (2020-2032) (USD Billion)
10.3.2.9.3 Italy Printed Electronics Market Estimates and Forecasts, by Device (2020-2032) (USD Billion)
10.3.2.10 Spain
10.3.2.10.1 Spain Printed Electronics Market Estimates and Forecasts, by Material (2020-2032) (USD Billion)
10.3.2.10.2 Spain Printed Electronics Market Estimates and Forecasts, by Technology (2020-2032) (USD Billion)
10.3.2.10.3 Spain Printed Electronics Market Estimates and Forecasts, by Device (2020-2032) (USD Billion)
10.3.2.11 Netherlands
10.3.2.11.1 Netherlands Printed Electronics Market Estimates and Forecasts, by Material (2020-2032) (USD Billion)
10.3.2.11.2 Netherlands Printed Electronics Market Estimates and Forecasts, by Technology (2020-2032) (USD Billion)
10.3.2.11.3 Netherlands Printed Electronics Market Estimates and Forecasts, by Device (2020-2032) (USD Billion)
10.3.2.12 Switzerland
10.3.2.12.1 Switzerland Printed Electronics Market Estimates and Forecasts, by Material (2020-2032) (USD Billion)
10.3.2.12.2 Switzerland Printed Electronics Market Estimates and Forecasts, by Technology (2020-2032) (USD Billion)
10.3.2.12.3 Switzerland Printed Electronics Market Estimates and Forecasts, by Device (2020-2032) (USD Billion)
10.3.2.13 Austria
10.3.2.13.1 Austria Printed Electronics Market Estimates and Forecasts, by Material (2020-2032) (USD Billion)
10.3.2.13.2 Austria Printed Electronics Market Estimates and Forecasts, by Technology (2020-2032) (USD Billion)
10.3.2.13.3 Austria Printed Electronics Market Estimates and Forecasts, by Device (2020-2032) (USD Billion)
10.3.2.14 Rest of Western Europe
10.3.2.14.1 Rest of Western Europe Printed Electronics Market Estimates and Forecasts, by Material (2020-2032) (USD Billion)
10.3.2.14.2 Rest of Western Europe Printed Electronics Market Estimates and Forecasts, by Technology (2020-2032) (USD Billion)
10.3.2.14.3 Rest of Western Europe Printed Electronics Market Estimates and Forecasts, by Device (2020-2032) (USD Billion)
10.4 Asia-Pacific
10.4.1 Trends Analysis
10.4.2 Asia-Pacific Printed Electronics Market Estimates and Forecasts, by Country (2020-2032) (USD Billion)
10.4.3 Asia-Pacific Printed Electronics Market Estimates and Forecasts, by Material (2020-2032) (USD Billion)
10.4.4 Asia-Pacific Printed Electronics Market Estimates and Forecasts, by Technology (2020-2032) (USD Billion)
10.4.5 Asia-Pacific Printed Electronics Market Estimates and Forecasts, by Device (2020-2032) (USD Billion)
10.4.6 China
10.4.6.1 China Printed Electronics Market Estimates and Forecasts, by Material (2020-2032) (USD Billion)
10.4.6.2 China Printed Electronics Market Estimates and Forecasts, by Technology (2020-2032) (USD Billion)
10.4.6.3 China Printed Electronics Market Estimates and Forecasts, by Device (2020-2032) (USD Billion)
10.4.7 India
10.4.7.1 India Printed Electronics Market Estimates and Forecasts, by Material (2020-2032) (USD Billion)
10.4.7.2 India Printed Electronics Market Estimates and Forecasts, by Technology (2020-2032) (USD Billion)
10.4.7.3 India Printed Electronics Market Estimates and Forecasts, by Device (2020-2032) (USD Billion)
10.4.8 Japan
10.4.8.1 Japan Printed Electronics Market Estimates and Forecasts, by Material (2020-2032) (USD Billion)
10.4.8.2 Japan Printed Electronics Market Estimates and Forecasts, by Technology (2020-2032) (USD Billion)
10.4.8.3 Japan Printed Electronics Market Estimates and Forecasts, by Device (2020-2032) (USD Billion)
10.4.9 South Korea
10.4.9.1 South Korea Printed Electronics Market Estimates and Forecasts, by Material (2020-2032) (USD Billion)
10.4.9.2 South Korea Printed Electronics Market Estimates and Forecasts, by Technology (2020-2032) (USD Billion)
10.4.9.3 South Korea Printed Electronics Market Estimates and Forecasts, by Device (2020-2032) (USD Billion)
10.4.10 Vietnam
10.4.10.1 Vietnam Printed Electronics Market Estimates and Forecasts, by Material (2020-2032) (USD Billion)
10.4.10.2 Vietnam Printed Electronics Market Estimates and Forecasts, by Technology (2020-2032) (USD Billion)
10.4.10.3 Vietnam Printed Electronics Market Estimates and Forecasts, by Device (2020-2032) (USD Billion)
10.4.11 Singapore
10.4.11.1 Singapore Printed Electronics Market Estimates and Forecasts, by Material (2020-2032) (USD Billion)
10.4.11.2 Singapore Printed Electronics Market Estimates and Forecasts, by Technology (2020-2032) (USD Billion)
10.4.11.3 Singapore Printed Electronics Market Estimates and Forecasts, by Device (2020-2032) (USD Billion)
10.4.12 Australia
10.4.12.1 Australia Printed Electronics Market Estimates and Forecasts, by Material (2020-2032) (USD Billion)
10.4.12.2 Australia Printed Electronics Market Estimates and Forecasts, by Technology (2020-2032) (USD Billion)
10.4.12.3 Australia Printed Electronics Market Estimates and Forecasts, by Device (2020-2032) (USD Billion)
10.4.13 Rest of Asia-Pacific
10.4.13.1 Rest of Asia-Pacific Printed Electronics Market Estimates and Forecasts, by Material (2020-2032) (USD Billion)
10.4.13.2 Rest of Asia-Pacific Printed Electronics Market Estimates and Forecasts, by Technology (2020-2032) (USD Billion)
10.4.13.3 Rest of Asia-Pacific Printed Electronics Market Estimates and Forecasts, by Device (2020-2032) (USD Billion)
10.5 Middle East and Africa
10.5.1 Middle East
10.5.1.1 Trends Analysis
10.5.1.2 Middle East Printed Electronics Market Estimates and Forecasts, by Country (2020-2032) (USD Billion)
10.5.1.3 Middle East Printed Electronics Market Estimates and Forecasts, by Material (2020-2032) (USD Billion)
10.5.1.4 Middle East Printed Electronics Market Estimates and Forecasts, by Technology (2020-2032) (USD Billion)
10.5.1.5 Middle East Printed Electronics Market Estimates and Forecasts, by Device (2020-2032) (USD Billion)
10.5.1.6 UAE
10.5.1.6.1 UAE Printed Electronics Market Estimates and Forecasts, by Material (2020-2032) (USD Billion)
10.5.1.6.2 UAE Printed Electronics Market Estimates and Forecasts, by Technology (2020-2032) (USD Billion)
10.5.1.6.3 UAE Printed Electronics Market Estimates and Forecasts, by Device (2020-2032) (USD Billion)
10.5.1.7 Egypt
10.5.1.7.1 Egypt Printed Electronics Market Estimates and Forecasts, by Material (2020-2032) (USD Billion)
10.5.1.7.2 Egypt Printed Electronics Market Estimates and Forecasts, by Technology (2020-2032) (USD Billion)
10.5.1.7.3 Egypt Printed Electronics Market Estimates and Forecasts, by Device (2020-2032) (USD Billion)
10.5.1.8 Saudi Arabia
10.5.1.8.1 Saudi Arabia Printed Electronics Market Estimates and Forecasts, by Material (2020-2032) (USD Billion)
10.5.1.8.2 Saudi Arabia Printed Electronics Market Estimates and Forecasts, by Technology (2020-2032) (USD Billion)
10.5.1.8.3 Saudi Arabia Printed Electronics Market Estimates and Forecasts, by Device (2020-2032) (USD Billion)
10.5.1.9 Qatar
10.5.1.9.1 Qatar Printed Electronics Market Estimates and Forecasts, by Material (2020-2032) (USD Billion)
10.5.1.9.2 Qatar Printed Electronics Market Estimates and Forecasts, by Technology (2020-2032) (USD Billion)
10.5.1.9.3 Qatar Printed Electronics Market Estimates and Forecasts, by Device (2020-2032) (USD Billion)
10.5.1.10 Rest of Middle East
10.5.1.10.1 Rest of Middle East Printed Electronics Market Estimates and Forecasts, by Material (2020-2032) (USD Billion)
10.5.1.10.2 Rest of Middle East Printed Electronics Market Estimates and Forecasts, by Technology (2020-2032) (USD Billion)
10.5.1.10.3 Rest of Middle East Printed Electronics Market Estimates and Forecasts, by Device (2020-2032) (USD Billion)
10.5.2 Africa
10.5.2.1 Trends Analysis
10.5.2.2 Africa Printed Electronics Market Estimates and Forecasts, by Country (2020-2032) (USD Billion)
10.5.2.3 Africa Printed Electronics Market Estimates and Forecasts, by Material (2020-2032) (USD Billion)
10.5.2.4 Africa Printed Electronics Market Estimates and Forecasts, by Technology (2020-2032) (USD Billion)
10.5.2.5 Africa Printed Electronics Market Estimates and Forecasts, by Device (2020-2032) (USD Billion)
10.5.2.6 South Africa
10.5.2.6.1 South Africa Printed Electronics Market Estimates and Forecasts, by Material (2020-2032) (USD Billion)
10.5.2.6.2 South Africa Printed Electronics Market Estimates and Forecasts, by Technology (2020-2032) (USD Billion)
10.5.2.6.3 South Africa Printed Electronics Market Estimates and Forecasts, by Device (2020-2032) (USD Billion)
10.5.2.7 Nigeria
10.5.2.7.1 Nigeria Printed Electronics Market Estimates and Forecasts, by Material (2020-2032) (USD Billion)
10.5.2.7.2 Nigeria Printed Electronics Market Estimates and Forecasts, by Technology (2020-2032) (USD Billion)
10.5.2.7.3 Nigeria Printed Electronics Market Estimates and Forecasts, by Device (2020-2032) (USD Billion)
10.5.2.8 Rest of Africa
10.5.2.8.1 Rest of Africa Printed Electronics Market Estimates and Forecasts, by Material (2020-2032) (USD Billion)
10.5.2.8.2 Rest of Africa Printed Electronics Market Estimates and Forecasts, by Technology (2020-2032) (USD Billion)
10.5.2.8.3 Rest of Africa Printed Electronics Market Estimates and Forecasts, by Device (2020-2032) (USD Billion)
10.6 Latin America
10.6.1 Trends Analysis
10.6.2 Latin America Printed Electronics Market Estimates and Forecasts, by Country (2020-2032) (USD Billion)
10.6.3 Latin America Printed Electronics Market Estimates and Forecasts, by Material (2020-2032) (USD Billion)
10.6.4 Latin America Printed Electronics Market Estimates and Forecasts, by Technology (2020-2032) (USD Billion)
10.6.5 Latin America Printed Electronics Market Estimates and Forecasts, by Device (2020-2032) (USD Billion)
10.6.6 Brazil
10.6.6.1 Brazil Printed Electronics Market Estimates and Forecasts, by Material (2020-2032) (USD Billion)
10.6.6.2 Brazil Printed Electronics Market Estimates and Forecasts, by Technology (2020-2032) (USD Billion)
10.6.6.3 Brazil Printed Electronics Market Estimates and Forecasts, by Device (2020-2032) (USD Billion)
10.6.7 Argentina
10.6.7.1 Argentina Printed Electronics Market Estimates and Forecasts, by Material (2020-2032) (USD Billion)
10.6.7.2 Argentina Printed Electronics Market Estimates and Forecasts, by Technology (2020-2032) (USD Billion)
10.6.7.3 Argentina Printed Electronics Market Estimates and Forecasts, by Device (2020-2032) (USD Billion)
10.6.8 Colombia
10.6.8.1 Colombia Printed Electronics Market Estimates and Forecasts, by Material (2020-2032) (USD Billion)
10.6.8.2 Colombia Printed Electronics Market Estimates and Forecasts, by Technology (2020-2032) (USD Billion)
10.6.8.3 Colombia Printed Electronics Market Estimates and Forecasts, by Device (2020-2032) (USD Billion)
10.6.9 Rest of Latin America
10.6.9.1 Rest of Latin America Printed Electronics Market Estimates and Forecasts, by Material (2020-2032) (USD Billion)
10.6.9.2 Rest of Latin America Printed Electronics Market Estimates and Forecasts, by Technology (2020-2032) (USD Billion)
10.6.9.3 Rest of Latin America Printed Electronics Market Estimates and Forecasts, by Device (2020-2032) (USD Billion)
11. Company Profiles
11.1 BASF SE
11.1.1 Company Overview
11.1.2 Financial
11.1.3 Products/ Services Offered
11.1.4 SWOT Analysis
11.2 DuPont
11.2.1 Company Overview
11.2.2 Financial
11.2.3 Products/ Services Offered
11.2.4 SWOT Analysis
11.3 Molex, Inc.
11.3.1 Company Overview
11.3.2 Financial
11.3.3 Products/ Services Offered
11.3.4 SWOT Analysis
11.4 PARC
11.4.1 Company Overview
11.4.2 Financial
11.4.3 Products/ Services Offered
11.4.4 SWOT Analysis
11.5 E-Ink Holdings, Inc.
11.5.1 Company Overview
11.5.2 Financial
11.5.3 Products/ Services Offered
11.5.4 SWOT Analysis
11.6 Thin Film Electronics ASA
11.6.1 Company Overview
11.6.2 Financial
11.6.3 Products/ Services Offered
11.6.4 SWOT Analysis
11.7 Samsung Electronics Co., Ltd.
11.7.1 Company Overview
11.7.2 Financial
11.7.3 Products/ Services Offered
11.7.4 SWOT Analysis
11.8 LG Display Co., Ltd.
11.8.1 Company Overview
11.8.2 Financial
11.8.3 Products/ Services Offered
11.8.4 SWOT Analysis
11.9 Agfa-Gevaert Group
11.9.1 Company Overview
11.9.2 Financial
11.9.3 Products/ Services Offered
11.9.4 SWOT Analysis
11.10 Nissha Co., Ltd.
11.10.1 Company Overview
11.10.2 Financial
11.10.3 Products/ Services Offered
11.10.4 SWOT Analysis
12. Use Cases and Best Practices
13. Conclusion
An accurate research report requires proper strategizing as well as implementation. There are multiple factors involved in the completion of good and accurate research report and selecting the best methodology to compete the research is the toughest part. Since the research reports we provide play a crucial role in any company’s decision-making process, therefore we at SNS Insider always believe that we should choose the best method which gives us results closer to reality. This allows us to reach at a stage wherein we can provide our clients best and accurate investment to output ratio.
Each report that we prepare takes a timeframe of 350-400 business hours for production. Starting from the selection of titles through a couple of in-depth brain storming session to the final QC process before uploading our titles on our website we dedicate around 350 working hours. The titles are selected based on their current market cap and the foreseen CAGR and growth.
The 5 steps process:
Step 1: Secondary Research:
Secondary Research or Desk Research is as the name suggests is a research process wherein, we collect data through the readily available information. In this process we use various paid and unpaid databases which our team has access to and gather data through the same. This includes examining of listed companies’ annual reports, Journals, SEC filling etc. Apart from this our team has access to various associations across the globe across different industries. Lastly, we have exchange relationships with various university as well as individual libraries.
Step 2: Primary Research
When we talk about primary research, it is a type of study in which the researchers collect relevant data samples directly, rather than relying on previously collected data. This type of research is focused on gaining content specific facts that can be sued to solve specific problems. Since the collected data is fresh and first hand therefore it makes the study more accurate and genuine.
We at SNS Insider have divided Primary Research into 2 parts.
Part 1 wherein we interview the KOLs of major players as well as the upcoming ones across various geographic regions. This allows us to have their view over the market scenario and acts as an important tool to come closer to the accurate market numbers. As many as 45 paid and unpaid primary interviews are taken from both the demand and supply side of the industry to make sure we land at an accurate judgement and analysis of the market.
This step involves the triangulation of data wherein our team analyses the interview transcripts, online survey responses and observation of on filed participants. The below mentioned chart should give a better understanding of the part 1 of the primary interview.
Part 2: In this part of primary research the data collected via secondary research and the part 1 of the primary research is validated with the interviews from individual consultants and subject matter experts.
Consultants are those set of people who have at least 12 years of experience and expertise within the industry whereas Subject Matter Experts are those with at least 15 years of experience behind their back within the same space. The data with the help of two main processes i.e., FGDs (Focused Group Discussions) and IDs (Individual Discussions). This gives us a 3rd party nonbiased primary view of the market scenario making it a more dependable one while collation of the data pointers.
Step 3: Data Bank Validation
Once all the information is collected via primary and secondary sources, we run that information for data validation. At our intelligence centre our research heads track a lot of information related to the market which includes the quarterly reports, the daily stock prices, and other relevant information. Our data bank server gets updated every fortnight and that is how the information which we collected using our primary and secondary information is revalidated in real time.
Step 4: QA/QC Process
After all the data collection and validation our team does a final level of quality check and quality assurance to get rid of any unwanted or undesired mistakes. This might include but not limited to getting rid of the any typos, duplication of numbers or missing of any important information. The people involved in this process include technical content writers, research heads and graphics people. Once this process is completed the title gets uploader on our platform for our clients to read it.
Step 5: Final QC/QA Process:
This is the last process and comes when the client has ordered the study. In this process a final QA/QC is done before the study is emailed to the client. Since we believe in giving our clients a good experience of our research studies, therefore, to make sure that we do not lack at our end in any way humanly possible we do a final round of quality check and then dispatch the study to the client.
Key Segments:
By Material
Ink
Substrate
By Technology
Inkjet
Screen
Gravure
Flexographic
By Device
Displays
Photovoltaic
Lighting
RFID
Others
Request for Segment Customization as per your Business Requirement: Segment Customization Request
Regional Coverage:
North America
US
Canada
Mexico
Europe
Eastern Europe
Poland
Romania
Hungary
Turkey
Rest of Eastern Europe
Western Europe
Germany
France
UK
Italy
Spain
Netherlands
Switzerland
Austria
Rest of Western Europe
Asia Pacific
China
India
Japan
South Korea
Vietnam
Singapore
Australia
Rest of Asia Pacific
Middle East & Africa
Middle East
UAE
Egypt
Saudi Arabia
Qatar
Rest of Middle East
Africa
Nigeria
South Africa
Rest of Africa
Latin America
Brazil
Argentina
Colombia
Rest of Latin America
Request for Country Level Research Report: Country Level Customization Request
Available Customization
With the given market data, SNS Insider offers customization as per the company’s specific needs. The following customization options are available for the report:
Detailed Volume Analysis
Criss-Cross segment analysis (e.g. Product X Application)
Competitive Product Benchmarking
Geographic Analysis
Additional countries in any of the regions
Customized Data Representation
Detailed analysis and profiling of additional market players
The Electric Car Charger Market size was valued at USD 7.64 billion in 2023 and is expected to grow to USD 55.45 billion by 2032 and grow at a CAGR of 24.64 % over the forecast period of 2024-2032
The Precision Planting Market Size was valued at $5.00 Billion in 2023. It is estimated to reach $12.24 Billion by 2032, at CAGR of 10.47% during 2024-2032
The Ultra High Purity Metal Tubing for Semiconductor Market was valued at USD 0.55 billion in 2023 and is expected to reach USD 1.01 billion by 2032 and grow at a CAGR of 7.05 % over the forecast period 2024-2032.
The Spintronics Market Size was valued at USD 1.07 Billion in 2023 and is expected to grow at a CAGR of 35.67% to reach USD 16.64 Billion by 2032.
The Digital Out of Home (DOOH) Market Size was valued at USD 23.66 Billion in 2023 and is expected to grow at 11.84% CAGR to reach USD 64.72 Billion by 2032.
The Simultaneous Localization and Mapping Market was valued at USD 478.45 million in 2023 and is expected to reach USD 7811.04 million by 2032, growing at a CAGR of 36.43% over the forecast period 2024-2032.
Hi! Click one of our member below to chat on Phone