Get More Information on Pressure Transmitter Market - Request Sample Report
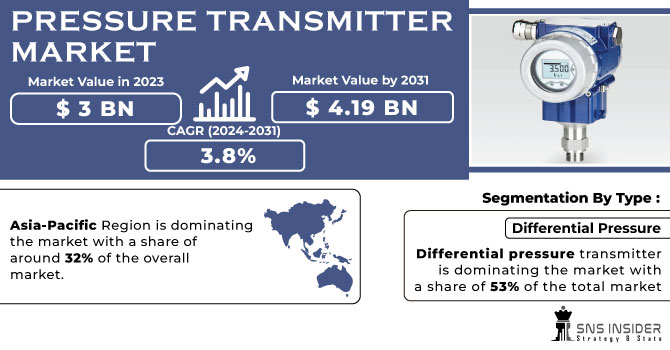
The Pressure Transmitter Market Size was valued at USD 3 Billion in 2023 and is now anticipated to grow USD 4.19 Billion by 2031, displaying a compound annual growth rate (CAGR) of 3.8% during the forecast Period 2024-2031.
The pressure transmitter market is growing at a significant rate, with the widespread usage of automation systems like pressure transmitters in eliminating human interaction in the processes. These machines can survive in any weather condition which even includes immersion in fluids like water.
Also, pressure transmitters helps in monitoring and capturing of useful data in order to boost productivity, pattern spotting and even implementing the changes in order to avoid any unfortunate incidents in future. Pressure transmitters are also used in variety of industries ranging from oil and gas to food and beverages industry. The increasing demand for predictive maintenance and real-time data analysis will drive pressure transmitter market revenue expansion. Furthermore, with the integration of industrial internet of things (IIoT) and industry 4.0 into industries will help in the growth of the pressure transmitter market into expansion.
Drivers
Restraints
Pressure transmitters need to be constantly updated and maintained based on changing requirements. Implementation of industrial automation has promoted digital transformation but also has increased the complexity of the measurement and analysis of parameters. Even the productivity increases, the complexity of staying up to date with continuous upgrades becomes inevitable in order to avoid failures & downtimes.
Opportunities
Increase in demand is because of its ability to measure and calculate the mass flow as a function of absolute pressure, temperature and differential pressure. The key benefit is to have only one device rather than having several transmitters and a mass flow calculator. The transmitters help improve productivity, increase process efficiency, and enhance plant safety while significantly lowering the total cost of ownership is helping in the growth of the market.
Challenges
Impact of Russia-Ukraine War
The Russia-Ukraine war has heavily impacted the market, with the disrupted supply chain which is impacting the pressure transmitter market in variety of ways. Russia has limited its access to raw materials required for the manufacturing of pressure transmitters causing shortages and ultimately price hikes. With the disrupted logistics because of the war is also delaying the deliveries of products which is affecting the projects that heavily relies on pressure transmitters. Also, with a shifting focus towards defense the resources may get diverted from industries like oil & gas which is major user of pressure transmitters which can lead to a decline in demand. But, on the other side some regions might see a rise in demand for pressure transmitters from an alternative suppliers. Also, some countries may even start to manufacture domestically to reduce its dependence on foreign suppliers. The war also raises the problem of energy security so pressure transmitters can help in optimizing energy production and distribution which could lead to increased demand for pressure transmitters in the long run.
Impact of Economic Slowdown
The economic slowdown has a huge impact on the pressure transmitter market With a decrease in demand because of Tight budgets by companies which could delay or even cancel the procurement of new pressure transmitters. Pressure transmitters is an additional equipment meaning that the investment on the equipment can be delayed. The slowdown has caused a disruption in supply chain. Pressure transmitters rely on varieties of raw materials, and slowdown can lead to shortages due to production downturns or even trade restrictions. Which will affect the availability and inflating the prices. But, on the other side focusing on maintaining existing equipment, there may be seen a rise in demand for spare parts and replacements in order to keep the equipments operational. Furthermore, companies may even try to prioritize efficiency so by upgrading to advanced pressure transmitters cost savings strategy. There might be mixed impacts of the slowdown but the overall efficiency make it favourable throughout.
By Type
Differential pressure transmitter is dominating the market with a share of 53% of the total market because of its versatility in flow, level & pressure measurement applications which is of great importance in monitoring & control of processes. Differential pressure transmitters can be of any pressure sensing technologies and find their usage in level detection and flow measurement with the help of primary elements such as orifice plates, venturi tubes, flow nozzles, low loss flow tubes, and pivot tubes etc. in industries.
By Fluid Type
Liquid
Gas
Steam
The Liquid Fluid type is dominating the market with a share of 75% of thee total market because of its extensive use in non-hydrocarbon liquids, fluid pressure and level measurement applications like water & wastewater applications, a submersible pressure transmitter finds wide usage. Gauge and differential pressure transmitters are widely used to measure the hydrostatic level of liquids in tanks and used for water level measurement of groundwater pumps.
By Application
Level
Pressure
Flow
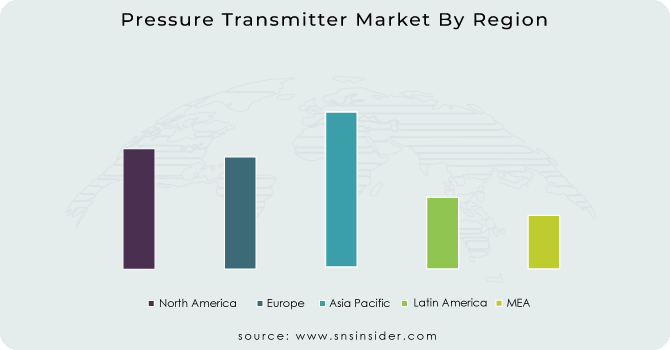
Asia-Pacific Region is dominating the market with a share of around 32% of the overall market. With the growing demand for electricity, exports of chemicals, and development of industrial and utility-grade wastewater treatment plants are driving the growth of the market in the region. Also with the rapid growth of chemical and food & beverage industry is making a dominance in the market.
North America is the fastest growing region next to Asia-Pacific because of rapid industrialization and rapid growth of the healthcare sector.
Get Customized Report as per your Business Requirement - Request For Customized Report
Regional Outlook
North America
US
Canada
Mexico
Europe
Eastern Europe
Poland
Romania
Hungary
Turkey
Rest of Eastern Europe
Western Europe
Germany
France
UK
Italy
Spain
Netherlands
Switzerland
Austria
Rest of Western Europe
Asia Pacific
China
India
Japan
South Korea
Vietnam
Singapore
Australia
Rest of Asia Pacific
Middle East & Africa
Middle East
UAE
Egypt
Saudi Arabia
Qatar
Rest of the Middle East
Africa
Nigeria
South Africa
Rest of Africa
Latin America
Brazil
Argentina
Colombia
Rest of Latin America
The major key players are Emerson Electric Company, Yokogawa Electric Corporation, Endress+Hauser AG, ABB Lid., Honeywell International Inc., Siemens AG, General Electric, Schneider Electric SE, WIKA Alexander Wiegand SE & Co. KG, Dwyer Instruments Inc. and others.
Yokogawa Electric Corporation-Company Financial Analysis
In March 2024, Siemens, announced the expansion of its Sitrans P series pressure transmitter portfolio. The new additions include models specifically designed for harsh environments like offshore oil rigs or chemical processing plants. These transmitters boast enhanced corrosion resistance and can withstand extreme temperatures and pressures.
In February 2024, Yokogawa, launched a subscription-based service called "OpreX Lifecycle Management for Pressure." This service provides remote monitoring, diagnostics, and maintenance recommendations for Yokogawa pressure transmitters. The subscription model allows companies to access these functionalities without a significant upfront investment.
| Report Attributes | Details |
|---|---|
| Market Size in 2023 | US$ 3 Billion |
| Market Size by 2031 | US$ 4.19 Billion |
| CAGR | CAGR of 3.8 % From 2024 to 2031 |
| Base Year | 2023 |
| Forecast Period | 2024-2031 |
| Historical Data | 2020-2022 |
| Report Scope & Coverage | Market Size, Segments Analysis, Competitive Landscape, Regional Analysis, DROC & SWOT Analysis, Forecast Outlook |
| Key Segments | • By Type (Absolute, Gauge, Differential Pressure, Multivariable) • By Fluid Type (Liquid, Gas, Steam) • By Application (Level, Pressure, Flow) |
| Regional Analysis/Coverage | North America (US, Canada, Mexico), Europe (Eastern Europe [Poland, Romania, Hungary, Turkey, Rest of Eastern Europe] Western Europe] Germany, France, UK, Italy, Spain, Netherlands, Switzerland, Austria, Rest of Western Europe]), Asia Pacific (China, India, Japan, South Korea, Vietnam, Singapore, Australia, Rest of Asia Pacific), Middle East & Africa (Middle East [UAE, Egypt, Saudi Arabia, Qatar, Rest of Middle East], Africa [Nigeria, South Africa, Rest of Africa], Latin America (Brazil, Argentina, Colombia, Rest of Latin America) |
| Company Profiles | Emerson Electric Company, Yokogawa Electric Corporation, Endress+Hauser AG, ABB Lid., Honeywell International Inc., Siemens AG, General Electric, Schneider Electric SE, WIKA Alexander Wiegand SE & Co. KG, Dwyer Instruments Inc. |
| Key Drivers | • Rise in importance towards industrial automation for optimum utilization of resources • Advancements in automated & remote calibration for reliable and accurate outputs is driving the growth of the market. |
| Restraints | • Requirement for constant maintenances and frequent software upgrades of the system. • Severe competition from low cost alternatives which may offer basic functionalities but at lower price can be a restraint in the growth of the market. |
Ans: The Pressure Transmitter Market is expected to grow at a CAGR of 3.8%.
Ans: Pressure Transmitter Market size was USD 3 billion in 2023 and is expected to Reach USD 4.19 billion by 2031.
Ans: Advancements in automated & remote calibration for reliable and accurate outputs is driving the growth of the market.
Ans: Severe competition from low cost alternatives which may offer basic functionalities but at lower price can be a restraint in the growth of the market.
Ans: Asia-Pacific region is expected to hold the largest market share in the Pressure Transmitter Market.
TABLE OF CONTENTS
1. Introduction
1.1 Market Definition
1.2 Scope
1.3 Research Assumptions
2. Industry Flowchart
3. Research Methodology
4. Market Dynamics
4.1 Drivers
4.2 Restraints
4.3 Opportunities
4.4 Challenges
5. Impact Analysis
5.1 Impact of Russia-Ukraine Crisis
5.2 Impact of Economic Slowdown on Major Countries
5.2.1 Introduction
5.2.2 United States
5.2.3 Canada
5.2.4 Germany
5.2.5 France
5.2.6 UK
5.2.7 China
5.2.8 Japan
5.2.9 South Korea
5.2.10 India
6. Value Chain Analysis
7. Porter’s 5 Forces Model
8. Pest Analysis
9. Pressure Transmitter Market Segmentation, by Type
9.1 Introduction
9.2 Trend Analysis
9.3 Absolute
9.4 Gauge
9.5 Differential Pressure
9.6 Multivariable
10. Pressure Transmitter Market Segmentation, by Fluid Type
10.1 Introduction
10.2 Trend Analysis
10.3 Liquid
10.4 Gas
10.5 Steam
11. Pressure Transmitter Market Segmentation, by Application
11.1 Introduction
11.2 Trend Analysis
11.3 Level
11.4 Pressure
11.5 Flow
12. Regional Analysis
12.1 Introduction
12.2 North America
12.2.1 Trend Analysis
12.2.2 North America Pressure Transmitter Market by Country
12.2.3 North America Pressure Transmitter Market by Type
12.2.4 North America Pressure Transmitter Market by Fluid Type
12.2.5 North America Pressure Transmitter Market by Application
12.2.6 USA
12.2.6.1 USA Pressure Transmitter Market by Type
12.2.6.2 USA Pressure Transmitter Market by Fluid Type
12.2.6.3 USA Pressure Transmitter Market by Application
12.2.7 Canada
12.2.7.1 Canada Pressure Transmitter Market by Type
12.2.7.2 Canada Pressure Transmitter Market by Fluid Type
12.2.7.3 Canada Pressure Transmitter Market by Application
12.2.8 Mexico
12.2.8.1 Mexico Pressure Transmitter Market by Type
12.2.8.2 Mexico Pressure Transmitter Market by Fluid Type
12.2.8.3 Mexico Pressure Transmitter Market by Application
12.3 Europe
12.3.1 Trend Analysis
12.3.2 Eastern Europe
12.3.2.1 Eastern Europe Pressure Transmitter Market by Country
12.3.2.2 Eastern Europe Pressure Transmitter Market by Type
12.3.2.3 Eastern Europe Pressure Transmitter Market by Fluid Type
12.3.2.4 Eastern Europe Pressure Transmitter Market by Application
12.3.2.5 Poland
12.3.2.5.1 Poland Pressure Transmitter Market by Type
12.3.2.5.2 Poland Pressure Transmitter Market by Fluid Type
12.3.2.5.3 Poland Pressure Transmitter Market by Application
12.3.2.6 Romania
12.3.2.6.1 Romania Pressure Transmitter Market by Type
12.3.2.6.2 Romania Pressure Transmitter Market by Fluid Type
12.3.2.6.4 Romania Pressure Transmitter Market by Application
12.3.2.7 Hungary
12.3.2.7.1 Hungary Pressure Transmitter Market by Type
12.3.2.7.2 Hungary Pressure Transmitter Market by Fluid Type
12.3.2.7.3 Hungary Pressure Transmitter Market by Application
12.3.2.8 Turkey
12.3.2.8.1 Turkey Pressure Transmitter Market by Type
12.3.2.8.2 Turkey Pressure Transmitter Market by Fluid Type
12.3.2.8.3 Turkey Pressure Transmitter Market by Application
12.3.2.9 Rest of Eastern Europe
12.3.2.9.1 Rest of Eastern Europe Pressure Transmitter Market by Type
12.3.2.9.2 Rest of Eastern Europe Pressure Transmitter Market by Fluid Type
12.3.2.9.3 Rest of Eastern Europe Pressure Transmitter Market by Application
12.3.3 Western Europe
12.3.3.1 Western Europe Pressure Transmitter Market by Country
12.3.3.2 Western Europe Pressure Transmitter Market by Type
12.3.3.3 Western Europe Pressure Transmitter Market by Fluid Type
12.3.3.4 Western Europe Pressure Transmitter Market by Application
12.3.3.5 Germany
12.3.3.5.1 Germany Pressure Transmitter Market by Type
12.3.3.5.2 Germany Pressure Transmitter Market by Fluid Type
12.3.3.5.3 Germany Pressure Transmitter Market by Application
12.3.3.6 France
12.3.3.6.1 France Pressure Transmitter Market by Type
12.3.3.6.2 France Pressure Transmitter Market by Fluid Type
12.3.3.6.3 France Pressure Transmitter Market by Application
12.3.3.7 UK
12.3.3.7.1 UK Pressure Transmitter Market by Type
12.3.3.7.2 UK Pressure Transmitter Market by Fluid Type
12.3.3.7.3 UK Pressure Transmitter Market by Application
12.3.3.8 Italy
12.3.3.8.1 Italy Pressure Transmitter Market by Type
12.3.3.8.2 Italy Pressure Transmitter Market by Fluid Type
12.3.3.8.3 Italy Pressure Transmitter Market by Application
12.3.3.9 Spain
12.3.3.9.1 Spain Pressure Transmitter Market by Type
12.3.3.9.2 Spain Pressure Transmitter Market by Fluid Type
12.3.3.9.3 Spain Pressure Transmitter Market by Application
12.3.3.10 Netherlands
12.3.3.10.1 Netherlands Pressure Transmitter Market by Type
12.3.3.10.2 Netherlands Pressure Transmitter Market by Fluid Type
12.3.3.10.3 Netherlands Pressure Transmitter Market by Application
12.3.3.11 Switzerland
12.3.3.11.1 Switzerland Pressure Transmitter Market by Type
12.3.3.11.2 Switzerland Pressure Transmitter Market by Fluid Type
12.3.3.11.3 Switzerland Pressure Transmitter Market by Application
12.3.3.1.12 Austria
12.3.3.12.1 Austria Pressure Transmitter Market by Type
12.3.3.12.2 Austria Pressure Transmitter Market by Fluid Type
12.3.3.12.3 Austria Pressure Transmitter Market by Application
12.3.3.13 Rest of Western Europe
12.3.3.13.1 Rest of Western Europe Pressure Transmitter Market by Type
12.3.3.13.2 Rest of Western Europe Pressure Transmitter Market by Fluid Type
12.3.3.13.3 Rest of Western Europe Pressure Transmitter Market by Application
12.4 Asia-Pacific
12.4.1 Trend Analysis
12.4.2 Asia-Pacific Pressure Transmitter Market by Country
12.4.3 Asia-Pacific Pressure Transmitter Market by Type
12.4.4 Asia-Pacific Pressure Transmitter Market by Fluid Type
12.4.5 Asia-Pacific Pressure Transmitter Market by Application
12.4.6 China
12.4.6.1 China Pressure Transmitter Market by Type
12.4.6.2 China Pressure Transmitter Market by Fluid Type
12.4.6.3 China Pressure Transmitter Market by Application
12.4.7 India
12.4.7.1 India Pressure Transmitter Market by Type
12.4.7.2 India Pressure Transmitter Market by Fluid Type
12.4.7.3 India Pressure Transmitter Market by Application
12.4.8 Japan
12.4.8.1 Japan Pressure Transmitter Market by Type
12.4.8.2 Japan Pressure Transmitter Market by Fluid Type
12.4.8.3 Japan Pressure Transmitter Market by Application
12.4.9 South Korea
12.4.9.1 South Korea Pressure Transmitter Market by Type
12.4.9.2 South Korea Pressure Transmitter Market by Fluid Type
12.4.9.3 South Korea Pressure Transmitter Market by Application
12.4.10 Vietnam
12.4.10.1 Vietnam Pressure Transmitter Market by Type
12.4.10.2 Vietnam Pressure Transmitter Market by Fluid Type
12.4.10.3 Vietnam Pressure Transmitter Market by Application
12.4.11 Singapore
12.4.11.1 Singapore Pressure Transmitter Market by Type
12.4.11.2 Singapore Pressure Transmitter Market by Fluid Type
12.4.11.3 Singapore Pressure Transmitter Market by Application
12.4.12 Australia
12.4.12.1 Australia Pressure Transmitter Market by Type
12.4.12.2 Australia Pressure Transmitter Market by Fluid Type
12.4.12.3 Australia Pressure Transmitter Market by Application
12.4.13 Rest of Asia-Pacific
12.4.13.1 Rest of Asia-Pacific Pressure Transmitter Market by Type
12.4.13.2 Rest of Asia-Pacific Pressure Transmitter Market by Fluid Type
12.4.13.3 Rest of Asia-Pacific Pressure Transmitter Market by Application
12.5 Middle East & Africa
12.5.1 Trend Analysis
12.5.2 Middle East
12.5.2.1 Middle East Pressure Transmitter Market by Country
12.5.2.2 Middle East Pressure Transmitter Market by Type
12.5.2.3 Middle East Pressure Transmitter Market by Fluid Type
12.5.2.4 Middle East Pressure Transmitter Market by Application
12.5.2.5 UAE
12.5.2.5.1 UAE Pressure Transmitter Market by Type
12.5.2.5.2 UAE Pressure Transmitter Market by Fluid Type
12.5.2.5.3 UAE Pressure Transmitter Market by Application
12.5.2.6 Egypt
12.5.2.6.1 Egypt Pressure Transmitter Market by Type
12.5.2.6.2 Egypt Pressure Transmitter Market by Fluid Type
12.5.2.6.3 Egypt Pressure Transmitter Market by Application
12.5.2.7 Saudi Arabia
12.5.2.7.1 Saudi Arabia Pressure Transmitter Market by Type
12.5.2.7.2 Saudi Arabia Pressure Transmitter Market by Fluid Type
12.5.2.7.3 Saudi Arabia Pressure Transmitter Market by Application
12.5.2.8 Qatar
12.5.2.8.1 Qatar Pressure Transmitter Market by Type
12.5.2.8.2 Qatar Pressure Transmitter Market by Fluid Type
12.5.2.8.3 Qatar Pressure Transmitter Market by Application
12.5.2.9 Rest of Middle East
12.5.2.9.1 Rest of Middle East Pressure Transmitter Market by Type
12.5.2.9.2 Rest of Middle East Pressure Transmitter Market by Fluid Type
12.5.2.9.3 Rest of Middle East Pressure Transmitter Market by Application
12.5.3 Africa
12.5.3.1 Africa Pressure Transmitter Market by Country
12.5.3.2 Africa Pressure Transmitter Market by Type
12.5.3.3 Africa Pressure Transmitter Market by Fluid Type
12.5.3.4 Africa Pressure Transmitter Market by Application
12.5.3.5 Nigeria
12.5.3.5.1 Nigeria Pressure Transmitter Market by Type
12.5.3.5.2 Nigeria Pressure Transmitter Market by Fluid Type
12.5.3.5.3 Nigeria Pressure Transmitter Market by Application
12.5.3.6 South Africa
12.5.3.6.1 South Africa Pressure Transmitter Market by Type
12.5.3.6.2 South Africa Pressure Transmitter Market by Fluid Type
12.5.3.6.3 South Africa Pressure Transmitter Market by Application
12.5.3.7 Rest of Africa
12.5.3.7.1 Rest of Africa Pressure Transmitter Market by Type
12.5.3.7.2 Rest of Africa Pressure Transmitter Market by Fluid Type
12.5.3.7.3 Rest of Africa Pressure Transmitter Market by Application
12.6 Latin America
12.6.1 Trend Analysis
12.6.2 Latin America Pressure Transmitter Market by country
12.6.3 Latin America Pressure Transmitter Market by Type
12.6.4 Latin America Pressure Transmitter Market by Fluid Type
12.6.5 Latin America Pressure Transmitter Market by Application
12.6.6 Brazil
12.6.6.1 Brazil Pressure Transmitter Market by Type
12.6.6.2 Brazil Pressure Transmitter Market by Fluid Type
12.6.6.3 Brazil Pressure Transmitter Market by Application
12.6.7 Argentina
12.6.7.1 Argentina Pressure Transmitter Market by Type
12.6.7.2 Argentina Pressure Transmitter Market by Fluid Type
12.6.7.3 Argentina Pressure Transmitter Market by Application
12.6.8 Colombia
12.6.8.1 Colombia Pressure Transmitter Market by Type
12.6.8.2 Colombia Pressure Transmitter Market by Fluid Type
12.6.8.3 Colombia Pressure Transmitter Market by Application
12.6.9 Rest of Latin America
12.6.9.1 Rest of Latin America Pressure Transmitter Market by Type
12.6.9.2 Rest of Latin America Pressure Transmitter Market by Fluid Type
12.6.9.3 Rest of Latin America Pressure Transmitter Market by Application
13. Company Profiles
13.1 Emerson Electric Company
13.1.1 Company Overview
13.1.2 Financial
13.1.3 Products/ Services Offered
13.1.4 SWOT Analysis
13.1.5 The SNS View
13.2 Yokogawa Electric Corporation
13.2.1 Company Overview
13.2.2 Financial
13.2.3 Products/ Services Offered
13.2.4 SWOT Analysis
13.2.5 The SNS View
13.3 Endress+Hauser AG
13.3.1 Company Overview
13.3.2 Financial
13.3.3 Products/ Services Offered
13.3.4 SWOT Analysis
13.3.5 The SNS View
13.4 ABB Ltd.
13.4.1 Company Overview
13.4.2 Financial
13.4.3 Products/ Services Offered
13.4.4 SWOT Analysis
13.4.5 The SNS View
13.5 Honeywell International Inc.
13.5.1 Company Overview
13.5.2 Financial
13.5.3 Products/ Services Offered
13.5.4 SWOT Analysis
13.5.5 The SNS View
13.6 Siemens AG
13.6.1 Company Overview
13.6.2 Financial
13.6.3 Products/ Services Offered
13.6.4 SWOT Analysis
13.6.5 The SNS View
13.7 General Electric
13.7.1 Company Overview
13.7.2 Financial
13.7.3 Products/ Services Offered
13.7.4 SWOT Analysis
13.7.5 The SNS View
13.8 Schneider Electric SE
13.8.1 Company Overview
13.8.2 Financial
13.8.3 Products/ Services Offered
13.8.4 SWOT Analysis
13.8.5 The SNS View
13.9 WIKA Alexander Wiegand SE & Co. KG
13.9.1 Company Overview
13.9.2 Financial
13.9.3 Products/ Services Offered
13.9.4 SWOT Analysis
13.9.5 The SNS View
13.10 Dwyer Instruments Inc.
13.10.1 Company Overview
13.10.2 Financial
13.10.3 Products/ Services Offered
13.10.4 SWOT Analysis
13.10.5 The SNS View
14. Competitive Landscape
14.1 Competitive Benchmarking
14.2 Market Share Analysis
14.3 Recent Developments
14.3.1 Industry News
14.3.2 Company News
14.3.3 Mergers & Acquisitions
15. Use Case and Best Practices
16. Conclusion
An accurate research report requires proper strategizing as well as implementation. There are multiple factors involved in the completion of good and accurate research report and selecting the best methodology to compete the research is the toughest part. Since the research reports we provide play a crucial role in any company’s decision-making process, therefore we at SNS Insider always believe that we should choose the best method which gives us results closer to reality. This allows us to reach at a stage wherein we can provide our clients best and accurate investment to output ratio.
Each report that we prepare takes a timeframe of 350-400 business hours for production. Starting from the selection of titles through a couple of in-depth brain storming session to the final QC process before uploading our titles on our website we dedicate around 350 working hours. The titles are selected based on their current market cap and the foreseen CAGR and growth.
The 5 steps process:
Step 1: Secondary Research:
Secondary Research or Desk Research is as the name suggests is a research process wherein, we collect data through the readily available information. In this process we use various paid and unpaid databases which our team has access to and gather data through the same. This includes examining of listed companies’ annual reports, Journals, SEC filling etc. Apart from this our team has access to various associations across the globe across different industries. Lastly, we have exchange relationships with various university as well as individual libraries.

Step 2: Primary Research
When we talk about primary research, it is a type of study in which the researchers collect relevant data samples directly, rather than relying on previously collected data. This type of research is focused on gaining content specific facts that can be sued to solve specific problems. Since the collected data is fresh and first hand therefore it makes the study more accurate and genuine.
We at SNS Insider have divided Primary Research into 2 parts.
Part 1 wherein we interview the KOLs of major players as well as the upcoming ones across various geographic regions. This allows us to have their view over the market scenario and acts as an important tool to come closer to the accurate market numbers. As many as 45 paid and unpaid primary interviews are taken from both the demand and supply side of the industry to make sure we land at an accurate judgement and analysis of the market.
This step involves the triangulation of data wherein our team analyses the interview transcripts, online survey responses and observation of on filed participants. The below mentioned chart should give a better understanding of the part 1 of the primary interview.

Part 2: In this part of primary research the data collected via secondary research and the part 1 of the primary research is validated with the interviews from individual consultants and subject matter experts.
Consultants are those set of people who have at least 12 years of experience and expertise within the industry whereas Subject Matter Experts are those with at least 15 years of experience behind their back within the same space. The data with the help of two main processes i.e., FGDs (Focused Group Discussions) and IDs (Individual Discussions). This gives us a 3rd party nonbiased primary view of the market scenario making it a more dependable one while collation of the data pointers.
Step 3: Data Bank Validation
Once all the information is collected via primary and secondary sources, we run that information for data validation. At our intelligence centre our research heads track a lot of information related to the market which includes the quarterly reports, the daily stock prices, and other relevant information. Our data bank server gets updated every fortnight and that is how the information which we collected using our primary and secondary information is revalidated in real time.

Step 4: QA/QC Process
After all the data collection and validation our team does a final level of quality check and quality assurance to get rid of any unwanted or undesired mistakes. This might include but not limited to getting rid of the any typos, duplication of numbers or missing of any important information. The people involved in this process include technical content writers, research heads and graphics people. Once this process is completed the title gets uploader on our platform for our clients to read it.
Step 5: Final QC/QA Process:
This is the last process and comes when the client has ordered the study. In this process a final QA/QC is done before the study is emailed to the client. Since we believe in giving our clients a good experience of our research studies, therefore, to make sure that we do not lack at our end in any way humanly possible we do a final round of quality check and then dispatch the study to the client.
The Non-Destructive Testing Market size is value USD 20.56 Billion in 2023 and is expected to reach USD 39.79 Billion by 2032 with a growing CAGR of 7.61 % over the forecast period 2024-2032.
The Sanitary Pumps and Valves Market Size will be valued at USD 3.27 billion by 2031, and it was valued at USD 2.23 billion in 2022, and grow at a CAGR of 4.36% over the forecast period 2024-2031.
The Industrial Crystallizers Market Size was valued at USD 3.91 Billion in 2023 and is expected to reach USD 5.87 Billion by 2032 and grow at a CAGR of 4.67% over the forecast period 2024-2032.
Bubble Generator Market was estimated at USD 1.31 Bn in 2023 and is expected to arrive at USD 2.34 Bn by 2032 with a growing CAGR of 6.64% from 2024-2032.
The Food Processing and Handling Equipment Market size was estimated at USD 108.63 Billion in 2023 and is expected to reach USD 168.79 Billion by 2032 with a growing at a CAGR of 5.02% during the forecast period of 2024-2032.
The Cooling Tower Market Size was esteemed at USD 2.08 billion in 2023 and is supposed to arrive at USD 3.07 billion by 2031 and develop at a CAGR of 5.01% over the forecast period 2024-2031.

Hi! Click one of our member below to chat on Phone
© 2025 All Rights Reserved by SNS Insider Pvt Ltd


