image

Preparative And Process Chromatography Market Report Scope & Overview:

Preparative and Process Chromatography Market was valued at USD 11.74 billion in 2023 and is expected to reach USD 23.29 billion by 2032, growing at a CAGR of 8.20% from 2024-2032.
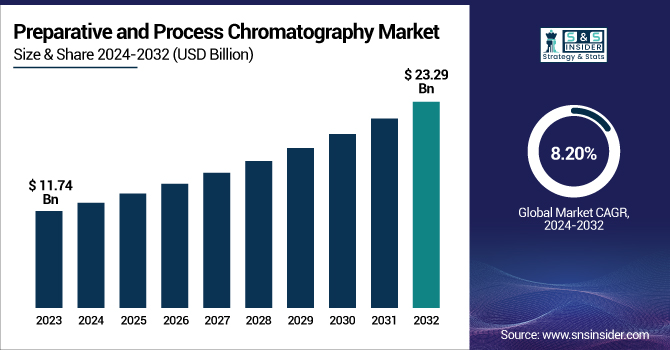
The Preparative and Process Chromatography Market report offers the first insights into market adoption and usage patterns, highlighting how technologies of chromatography are embedded in pharmaceutical, food, and biotechnology industries in 2023. It also presents regional demand differences, outlining consumption patterns of chromatography systems and consumables in major global markets. Furthermore, the report analyzes R&D investments, offering insights into technological innovations and improvements. It further delves into regulatory compliance effects, determining how strict quality controls influence industry norms. Finally, the research addresses automation and AI adoption, determining their contribution to process efficiency, scalability, and accuracy in chromatography processes.

The United States leads the North American Preparative and Process Chromatography Market with 8.34% CAGR as a result of its robust pharmaceutical and biotechnology industries, which extensively depend on chromatography in drug discovery and bioprocessing. High R&D spending, state-of-the-art manufacturing infrastructure, and regulatory compliance also promote extensive use of chromatography systems and consumables in the nation.

Market Dynamics

Drivers

  • Increasing Demand for Biopharmaceuticals and Personalized Medicine is driving the market growth.

Increasing demand for biopharmaceutical manufacture, such as monoclonal antibodies, vaccines, and cell & gene therapies, has seen significant growth for preparative and process chromatography. With an expanding pipeline in the pharmaceutical sector toward personalized medicine and biologics, the requirement for drug manufacture using high-purity separation processes is now greater than ever. Industry analysis has shown biologics at more than 40% of new drug approvals in 2023, thus illustrating the increase in demand for innovative chromatography solutions. In addition, regulatory standards like those of the FDA and EMA require high purification standards, also driving market growth. Recent advancements involve improvements in single-use chromatography systems and continuous chromatography technologies that increase efficiency and lower processing costs. These technologies, combined with the explosion of biologics research, are driving the use of chromatography in pharmaceutical and biotech applications.

  • Technological Advancements in Chromatography Systems are propelling the market to grow.

Unceasing innovation in chromatography technology, including automation, artificial intelligence-based analytics, and high-throughput purification strategies, is changing the dynamics of the market. New-generation chromatography equipment with increased resolution, faster throughput times, and greater scalability serves diverse industries from pharma to food safety. Inclusion of artificial intelligence and machine learning into chromatography supports predictive maintenance and process optimization, decreases downtime, and enhances efficiency. Gilson introduced its VERITY Preparative LC system in September 2024 to boost purification capacity in CROs and biotech R&D. At the same time, Shimadzu Corporation entered into a strategic alliance with Sepragen Corporation in November 2024 to boost bioprocess chromatography solutions in Asia. All these developments are enhancing workflows, enhancing reproducibility, and broadening the horizon of chromatography applications across various industries.                                                                  

Restraint

  • The high level of capital outlay needed in preparative and process chromatography systems is the major hindrance to market development.

Sophisticated chromatography equipment, for example, HPLC and preparative chromatography systems, is expensive initially and hence beyond the reach of SMEs as well as universities and research organizations. The high costs of maintenance of consumable materials such as resins, columns, and solvents, in addition to the initial purchase, contribute further to the costs of operation. For example, resins employed in biopharmaceutical purification with high purity can be costly, with some ranging from thousands of dollars per liter. The expense is further magnified by maintenance costs and the requirement for qualified personnel to operate and analyze chromatography data. Such financial burdens can restrict adoption levels, especially in developing areas, where fiscal limitations prevent investment in high-capacity chromatography technologies.

Opportunities

  • The rising need for biopharmaceuticals, such as monoclonal antibodies, vaccines, and gene therapies, is generating enormous opportunities for the preparative and process chromatography market.

Chromatography is essential in the purification and separation of biomolecules to produce high-quality and regulatory-compliant biopharmaceuticals. With the increasing trend towards personalized medicine and cell & gene therapy, the need for high-purity chromatography methods is likely to increase. In addition, top biotechnology companies and CDMOs are augmenting their bioprocessing capacities, fueling investments in large-scale chromatography equipment. For instance, international biopharma players are boosting investments in downstream processing technology, with a focus on chromatography. This tendency opens avenues for market participants to bring in high-efficiency, scalable chromatography technology solutions designed for biologics and next-generation therapies.

Challenges

  • Regulatory hurdles are the greatest challenge to producers in the process and preparative chromatography market.

The strict regulations by regulatory bodies like the FDA, EMA, and ICH require chromatography methods to achieve stringent levels of purity, reproducibility, and process validation. Compliance usually takes the form of extensive documentation, validation studies, and ongoing quality control tests, which are both time- and money-consuming. Additionally, regional differences in regulatory environments contribute to the complexity, necessitating companies to adapt their chromatography processes for various markets. The implementation of newer chromatography technologies, including continuous chromatography and AI-based automation, also necessitates further regulatory approvals, introducing another level of compliance issues. This regulatory complexity contributes to increased time-to-market for chromatography products, posing challenges for both incumbent companies and new market entrants.

Segmentation Analysis

By Product

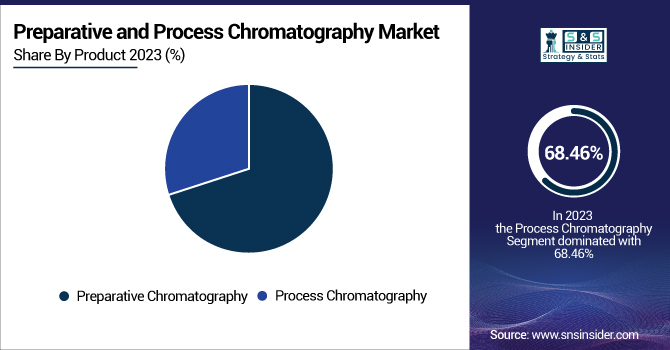
The Process Chromatography segment dominated the Preparative and Process Chromatography Market with a 68.46% market share in 2023, as it is in high demand in large-scale manufacturing of biopharmaceuticals, purification of monoclonal antibodies, and manufacture of vaccines. The segment is essential in bioprocessing processes where high-purity separation of biomolecules is needed for drug development and commercialization. Growing requirements for biologics and biosimilars, coupled with strict regulatory regulations for purification operations, have influenced substantial investments in process-scale chromatography equipment and consumables. The fact that there are mature biopharma clusters in North America and Europe has also favored the high utilization of process chromatography systems within GMP-regulated manufacturing sites.

The Preparative Chromatography segment is expected to grow at the fastest rate with 8.53% CAGR during the forecast period, owing to the growing use in small-scale drug discovery, proteomics, and research-based purification methods. With the development of personalized medicine, peptide synthesis, and oligonucleotide-based treatments, there is an emerging need for high-precision separation methods in R&D labs and pilot-scale manufacturing. Furthermore, advances in automation, artificial intelligence-based chromatography software, and miniaturized purification technologies are increasing preparative chromatography's efficiency and affordability. The growth of the CRO and biotech R&D market, especially in the developing regions of Asia Pacific, is also accelerating this trend as researchers require affordable, versatile chromatography solutions to enable early-stage drug development.

By Chromatography Type

The Liquid Chromatography segment dominated the Preparative and Process Chromatography Market with 31.20% market share in 2023 on account of its strong versatility, efficiency, and extensive use in biopharmaceutical, food, and chemical sectors. Methods such as High-Performance Liquid Chromatography (HPLC) and Ultra-High-Performance Liquid Chromatography (UHPLC) are heavily applied in protein purification, separation of biomolecules, and analysis of small-molecule drugs, thus being invaluable to research and industrial-scale manufacturing. Furthermore, the use of liquid chromatography in the production of monoclonal antibodies (mAb), the purification of vaccines, and biosimilar production has accelerated with the expansion of the biopharmaceutical sector. The combination of automated platforms and AI-based analytical software has further boosted the efficiency of liquid chromatography, making it the go-to chromatography method in preparative and process contexts.

By End User

The Bio-Pharmaceutical Industry segment dominated the Preparative and Process Chromatography Market with around 43.56% market share in 2023 because of the growing demand for biologics, monoclonal antibodies (mAbs), vaccines, and cell and gene therapies. The growing incidence of chronic diseases, cancer, and autoimmune diseases has led pharmaceutical companies to invest heavily in purification and separation technologies to guarantee high-purity drug formulations. Preparative and process chromatography is also a key part of downstream processing, protein purification, and biomolecule separation, and thus is a significant tool in the manufacture of biopharmaceuticals. The use of single-use chromatography systems, continuous bioprocessing, and automation supported by artificial intelligence also increased efficiency and scalability, further increasing the demand for chromatography in mass drug production. Regulatory authorities, for instance, the FDA and the EMA, have also pushed tight quality guidelines into the use of chromatography technologies in the biopharmaceutical industry.

Regional Analysis

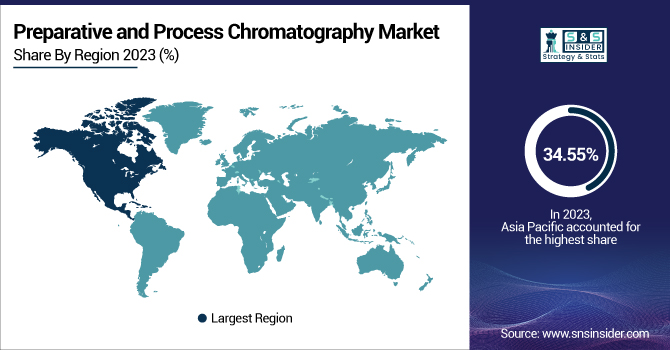
North America dominated the preparative and process chromatography market with around 34.55% market share in 2023, driven by its robust base of biopharmaceutical firms, contract development and manufacturing organizations (CDMOs), and research institutions. The United States is the leader in the region, with large investments in bioprocessing, drug discovery, and personalized medicine. The availability of prominent industry players like Thermo Fisher Scientific, Agilent Technologies, and Bio-Rad Laboratories, coupled with sophisticated regulatory systems implemented by the FDA, promotes strong adoption of chromatography methods. Moreover, government and private investment in proteomics, genomics, and biopharma R&D has further boosted demand for high-performance chromatography systems. North America's established healthcare infrastructure, robust academic research partnerships, and increasing emphasis on biologics manufacturing are factors in its market dominance.

The Asia Pacific is the fastest-growing region in preparative and process chromatography market with 9.03% CAGR throughout the forecast period, fueled by increased pharmaceutical and biotechnology investments in nations such as China, India, Japan, and South Korea. The area enjoys reduced manufacturing expenses, a growing contract research and manufacturing (CRO/CMO) sector, and rising government funding for life sciences research. China and India, especially, are experiencing an upsurge in biopharmaceutical manufacturing and biosimilar development, fueling demand for high-efficiency chromatography methods. Furthermore, international pharma firms are relocating their R&D and manufacturing activities to Asia Pacific because of its cost benefits and educated workforce. Regulatory advancements, increasing scholarly research partnerships, and improvements in the automation of chromatography also promote market growth within the region.

Key Market Players

  • GE Healthcare (ÄKTAprocess, BioProcess Columns)

  • Agilent Technologies (InfinityLab Preparative LC, 1290 Infinity II Preparative LC System)

  • Danaher Corporation (NGC Chromatography Systems, Profinia Protein Purification System)

  • Bio-Rad Laboratories Inc. (NGC Medium-Pressure Chromatography Systems, UNOsphere Chromatography Media)

  • Merck KGaA (Chromabolt Prepacked Columns, Fractogel EMD Resins)

  • Thermo Fisher Scientific Inc. (Dionex ICS-6000 HPIC System, HyPeak Chromatography Systems)

  • Shimadzu Corporation (LC-20AP Preparative Liquid Chromatograph, Nexera Prep Series)

  • Novasep Holding S.A.S (Hipersep Process Chromatography Systems, BioSC Pilot)

  • Waters Corporation (AutoPurification System, Prep 150 LC System)

  • PerkinElmer Inc. (Flexar LC Preparative System, Clarus SQ 8 GC/MS)

  • Sartorius AG (Resolute BioSMB Systems, Sartobind Membrane Adsorbers)

  • Tosoh Bioscience LLC (Octave Chromatography System, TSKgel Resins)

  • YMC Co., Ltd. (YMC PilotPLUS Columns, YMC-Triart Prep LC Columns)

  • KNAUER Wissenschaftliche Geräte GmbH (AZURA Preparative HPLC, Eurokat Columns)

  • Gilson, Inc. (VERITY Preparative HPLC Systems, PLC 2020 Personal Purification System)

  • Pall Corporation (Resolute Linear Columns, Mustang Chromatography Capsules)

  • Repligen Corporation (OPUS Pre-packed Columns, XCell ATF Systems)

  • Novasep (Hipersep Flowdrive, BioSC Lab)

  • ChromaCon AG (Contichrom CUBE, Contichrom Lab)

  • Biotage AB (Isolera Dalton 2000, Flash 400 System)

Suppliers (These suppliers provide essential chromatography resins, filtration media, and purification materials critical for large-scale separation processes in biopharmaceutical, chemical, and food industries.) in the Preparative and Process Chromatography Market.

  • Purolite Corporation

  • W. R. Grace & Co.

  • Mitsubishi Chemical Corporation

  • 3M Company

  • Dow Chemical Company

  • Resindion S.R.L.

  • Avantor, Inc.

  • Thermax Limited

  • Polymetrix AG

  • Daicel Corporation

Recent Development

  • In September 2024, Gilson launched the VERITY Preparative LC system, a high-performance purification platform with built-in software that will assist contract research organizations (CROs) and biotech R&D scientists in synthetic drug discovery, including peptide and oligonucleotide synthesis.

  • In November 2024, Shimadzu Corporation established a strategic alliance with Sepragen Corporation, a U.S.-based company that is an expert in the manufacture of bioprocess chromatography equipment. Under this partnership, Shimadzu gained exclusive rights to sell and service Sepragen's products in Japan, South Korea, and Southeast Asia.


    Preparative And Process Chromatography Market Report Scope:

    Report Attributes Details
    Market Size in 2023 US$ 11.74 billion
    Market Size by 2032 US$  23.79 billion
    CAGR CAGR of 8.20% From 2024 to 2032
    Base Year 2023
    Forecast Period 2024-2032
    Historical Data 2020-2022
    Report Scope & Coverage Market Size, Segments Analysis, Competitive  Landscape, Regional Analysis, DROC & SWOT Analysis, Forecast Outlook
    Key Segments • By Product (Preparative Chromatography, Process Chromatography)
    • By Chromatography Type (Liquid Chromatography, Gas Chromatography, Thin Layer Chromatography, Paper Chromatography, Others)
    • By End User (Food Industry, Nutraceutical Industry, Bio-Pharmaceutical Industry, Oil & Gas Industry, Diagnostics, Academic and Research Institutes)
    Regional Analysis/Coverage North America (US, Canada, Mexico), Europe (Eastern Europe [Poland, Romania, Hungary, Turkey, Rest of Eastern Europe] Western Europe] Germany, France, UK, Italy, Spain, Netherlands, Switzerland, Austria, Rest of Western Europe]), Asia Pacific (China, India, Japan, South Korea, Vietnam, Singapore, Australia, Rest of Asia Pacific), Middle East & Africa (Middle East [UAE, Egypt, Saudi Arabia, Qatar, Rest of Middle East], Africa [Nigeria, South Africa, Rest of Africa], Latin America (Brazil, Argentina, Colombia, Rest of Latin America)
    Company Profiles GE Healthcare, Agilent Technologies, Danaher Corporation, Bio-Rad Laboratories Inc., Merck KGaA, Thermo Fisher Scientific Inc., Shimadzu Corporation, Novasep Holding S.A.S, Waters Corporation, PerkinElmer Inc., Sartorius AG, Tosoh Bioscience LLC, YMC Co., Ltd., KNAUER Wissenschaftliche Geräte GmbH, Gilson, Inc., Pall Corporation, Repligen Corporation, Novasep, ChromaCon AG, Biotage AB, and other players.
     

Frequently Asked Questions

Ans:  The Preparative and Process Chromatography Market is expected to grow at a CAGR of 8.20% from 2024-2032.

Ans: The Preparative and Process Chromatography Market was USD 11.74 billion in 2023 and is expected to reach USD 23.79 billion by 2032.

Ans: Increasing Demand for Biopharmaceuticals and Personalized Medicine is driving the market growth.

Ans: The Process Chromatography segment dominated the Preparative and Process Chromatography Market.

Ans: North America dominated the Preparative and Process Chromatography Market in 2023.

Table of Contents:

1. Introduction

1.1 Market Definition

1.2 Scope (Inclusion and Exclusions)

1.3 Research Assumptions

2. Executive Summary

2.1 Market Overview

2.2 Regional Synopsis

2.3 Competitive Summary

3. Research Methodology

3.1 Top-Down Approach

3.2 Bottom-up Approachs

3.3. Data Validation

3.4 Primary Interviews

4. Market Dynamics Impact Analysis

4.1 Market Driving Factors Analysis

4.1.1 Drivers

4.1.2 Restraints

4.1.3 Opportunities

4.1.4 Challenges

4.2 PESTLE Analysis

4.3 Porter’s Five Forces Model

5. Statistical Insights and Trends Reporting

5.1 Market Adoption and Utilization Trends (2023)

5.2 Regional Demand for Chromatography Systems and Consumables (2023)

5.3 Research & Development Investments in Chromatography Technologies (2023-2032).

5.4 Regulatory Compliance and Quality Standards Impact (2023-2032)

5.5 Advancements in Process Automation and AI Integration in Chromatography

6. Competitive Landscape

6.1 List of Major Companies, By Region

6.2 Market Share Analysis, By Region

6.3 Product Benchmarking

6.3.1 Product specifications and features

6.3.2 Pricing

6.4 Strategic Initiatives

6.4.1 Marketing and promotional activities

6.4.2 Distribution and supply chain strategies

6.4.3 Expansion plans and new product launches

6.4.4 Strategic partnerships and collaborations

6.5 Technological Advancements

6.6 Market Positioning and Branding

7. Preparative and Process Chromatography Market Segmentation, By Product

7.1 Chapter Overview

7.2 By Preparative Chromatography

7.2.1 By Preparative Chromatography Market Trends Analysis (2020-2032)

7.2.2 By Preparative Chromatography Market Size Estimates and Forecasts to 2032 (USD Billion)

7.3 By Process Chromatography

7.3.1 By Process Chromatography Market Trends Analysis (2020-2032)

7.3.2 By Process Chromatography Market Size Estimates and Forecasts to 2032 (USD Billion)

8. Preparative and Process Chromatography Market Segmentation, By Chromatography Type

8.1 Chapter Overview

8.2 Liquid Chromatography

8.2.1 Liquid Chromatography Market Trends Analysis (2020-2032)

8.2.2 Liquid Chromatography Market Size Estimates and Forecasts to 2032 (USD Billion)

8.3 Gas Chromatography

8.3.1 Gas Chromatography Market Trends Analysis (2020-2032)

8.3.2 Gas Chromatography Market Size Estimates and Forecasts to 2032 (USD Billion)

8.4 Thin Layer Chromatography

8.4.1 Thin Layer Chromatography Market Trends Analysis (2020-2032)

8.4.2 Thin Layer Chromatography Market Size Estimates and Forecasts to 2032 (USD Billion)

8.5 Paper Chromatography

8.5.1 Paper Chromatography Market Trends Analysis (2020-2032)

8.5.2 Paper Chromatography Market Size Estimates and Forecasts to 2032 (USD Billion)

8.6 Others

8.6.1 Others Market Trends Analysis (2020-2032)

8.6.2 Others Market Size Estimates and Forecasts to 2032 (USD Billion)

9. Preparative and Process Chromatography Market Segmentation, By End User

9.1 Chapter Overview

9.2 Food Industry

9.2.1 Food Industry Market Trends Analysis (2020-2032)

9.2.2 Food Industry Market Size Estimates and Forecasts to 2032 (USD Billion)

9.3 Nutraceutical Industry

9.3.1 Nutraceutical Industry Market Trends Analysis (2020-2032)

9.3.2 Nutraceutical Industry Market Size Estimates and Forecasts to 2032 (USD Billion)

9.4 Bio-Pharmaceutical Industry

               9.4.1 Bio-Pharmaceutical Industry Market Trends Analysis (2020-2032)

9.4.2 Bio-Pharmaceutical Industry Market Size Estimates and Forecasts to 2032 (USD Billion)

9.5 Oil & Gas Industry

9.5.1 Oil & Gas Industry Market Trends Analysis (2020-2032)

9.5.2 Oil & Gas Industry Market Size Estimates and Forecasts to 2032 (USD Billion)

9.6 Diagnostics

9.6.1 Diagnostics Market Trends Analysis (2020-2032)

9.6.2 Diagnostics Market Size Estimates and Forecasts to 2032 (USD Billion)

9.7 Academic and Research Institutes

9.7.1 Academic and Research Institutes Market Trends Analysis (2020-2032)

9.7.2 Academic and Research Institutes Market Size Estimates and Forecasts to 2032 (USD Billion)

10. Regional Analysis

10.1 Chapter Overview

10.2 North America

10.2.1 Trends Analysis

10.2.2 North America Preparative and Process Chromatography Market Estimates and Forecasts, by Country (2020-2032) (USD Billion)

10.2.3 North America Preparative and Process Chromatography Market Estimates and Forecasts, by Product (2020-2032) (USD Billion) 

10.2.4 North America Preparative and Process Chromatography Market Estimates and Forecasts, by Chromatography Type (2020-2032) (USD Billion)

10.2.5 North America Preparative and Process Chromatography Market Estimates and Forecasts, by End User (2020-2032) (USD Billion)

10.2.6 USA

10.2.6.1 USA Preparative and Process Chromatography Market Estimates and Forecasts, by Product (2020-2032) (USD Billion)

10.2.6.2 USA Preparative and Process Chromatography Market Estimates and Forecasts, by Chromatography Type (2020-2032) (USD Billion)

10.2.6.3 USA Preparative and Process Chromatography Market Estimates and Forecasts, by End User (2020-2032) (USD Billion)

10.2.7 Canada

10.2.7.1 Canada Preparative and Process Chromatography Market Estimates and Forecasts, by Product (2020-2032) (USD Billion)

10.2.7.2 Canada Preparative and Process Chromatography Market Estimates and Forecasts, by Chromatography Type (2020-2032) (USD Billion)

10.2.7.3 Canada Preparative and Process Chromatography Market Estimates and Forecasts, by End User (2020-2032) (USD Billion)

10.2.8 Mexico

10.2.8.1 Mexico Preparative and Process Chromatography Market Estimates and Forecasts, by Product (2020-2032) (USD Billion)

10.2.8.2 Mexico Preparative and Process Chromatography Market Estimates and Forecasts, by Chromatography Type (2020-2032) (USD Billion)

10.2.8.3 Mexico Preparative and Process Chromatography Market Estimates and Forecasts, by End User (2020-2032) (USD Billion)

10.3 Europe

10.3.1 Eastern Europe

10.3.1.1 Trends Analysis

10.3.1.2 Eastern Europe Preparative and Process Chromatography Market Estimates and Forecasts, by Country (2020-2032) (USD Billion)

10.3.1.3 Eastern Europe Preparative and Process Chromatography Market Estimates and Forecasts, by Product (2020-2032) (USD Billion) 

10.3.1.4 Eastern Europe Preparative and Process Chromatography Market Estimates and Forecasts, by Chromatography Type (2020-2032) (USD Billion)

10.3.1.5 Eastern Europe Preparative and Process Chromatography Market Estimates and Forecasts, by End User (2020-2032) (USD Billion)

10.3.1.6 Poland

10.3.1.6.1 Poland Preparative and Process Chromatography Market Estimates and Forecasts, by Product (2020-2032) (USD Billion)

10.3.1.6.2 Poland Preparative and Process Chromatography Market Estimates and Forecasts, by Chromatography Type (2020-2032) (USD Billion)

10.3.1.6.3 Poland Preparative and Process Chromatography Market Estimates and Forecasts, by End User (2020-2032) (USD Billion)

10.3.1.7 Romania

10.3.1.7.1 Romania Preparative and Process Chromatography Market Estimates and Forecasts, by Product (2020-2032) (USD Billion)

10.3.1.7.2 Romania Preparative and Process Chromatography Market Estimates and Forecasts, by Chromatography Type (2020-2032) (USD Billion)

10.3.1.7.3 Romania Preparative and Process Chromatography Market Estimates and Forecasts, by End User (2020-2032) (USD Billion)

10.3.1.8 Hungary

10.3.1.8.1 Hungary Preparative and Process Chromatography Market Estimates and Forecasts, by Product (2020-2032) (USD Billion)

10.3.1.8.2 Hungary Preparative and Process Chromatography Market Estimates and Forecasts, by Chromatography Type (2020-2032) (USD Billion)

10.3.1.8.3 Hungary Preparative and Process Chromatography Market Estimates and Forecasts, by End User (2020-2032) (USD Billion)

10.3.1.9 Turkey

10.3.1.9.1 Turkey Preparative and Process Chromatography Market Estimates and Forecasts, by Product (2020-2032) (USD Billion)

10.3.1.9.2 Turkey Preparative and Process Chromatography Market Estimates and Forecasts, by Chromatography Type (2020-2032) (USD Billion)

10.3.1.9.3 Turkey Preparative and Process Chromatography Market Estimates and Forecasts, by End User (2020-2032) (USD Billion)

10.3.1.10 Rest of Eastern Europe

10.3.1.10.1 Rest of Eastern Europe Preparative and Process Chromatography Market Estimates and Forecasts, by Product (2020-2032) (USD Billion)

10.3.1.10.2 Rest of Eastern Europe Preparative and Process Chromatography Market Estimates and Forecasts, by Chromatography Type (2020-2032) (USD Billion)

10.3.1.10.3 Rest of Eastern Europe Preparative and Process Chromatography Market Estimates and Forecasts, by End User (2020-2032) (USD Billion)

10.3.2 Western Europe

10.3.2.1 Trends Analysis

10.3.2.2 Western Europe Preparative and Process Chromatography Market Estimates and Forecasts, by Country (2020-2032) (USD Billion)

10.3.2.3 Western Europe Preparative and Process Chromatography Market Estimates and Forecasts, by Product (2020-2032) (USD Billion) 

10.3.2.4 Western Europe Preparative and Process Chromatography Market Estimates and Forecasts, by Chromatography Type (2020-2032) (USD Billion)

10.3.2.5 Western Europe Preparative and Process Chromatography Market Estimates and Forecasts, by End User (2020-2032) (USD Billion)

10.3.2.6 Germany

10.3.2.6.1 Germany Preparative and Process Chromatography Market Estimates and Forecasts, by Product (2020-2032) (USD Billion)

10.3.2.6.2 Germany Preparative and Process Chromatography Market Estimates and Forecasts, by Chromatography Type (2020-2032) (USD Billion)

10.3.2.6.3 Germany Preparative and Process Chromatography Market Estimates and Forecasts, by End User (2020-2032) (USD Billion)

10.3.2.7 France

10.3.2.7.1 France Preparative and Process Chromatography Market Estimates and Forecasts, by Product (2020-2032) (USD Billion)

10.3.2.7.2 France Preparative and Process Chromatography Market Estimates and Forecasts, by Chromatography Type (2020-2032) (USD Billion)

10.3.2.7.3 France Preparative and Process Chromatography Market Estimates and Forecasts, by End User (2020-2032) (USD Billion)

10.3.2.8 UK

10.3.2.8.1 UK Preparative and Process Chromatography Market Estimates and Forecasts, by Product (2020-2032) (USD Billion)

10.3.2.8.2 UK Preparative and Process Chromatography Market Estimates and Forecasts, by Chromatography Type (2020-2032) (USD Billion)

10.3.2.8.3 UK Preparative and Process Chromatography Market Estimates and Forecasts, by End User (2020-2032) (USD Billion)

10.3.2.9 Italy

10.3.2.9.1 Italy Preparative and Process Chromatography Market Estimates and Forecasts, by Product (2020-2032) (USD Billion)

10.3.2.9.2 Italy Preparative and Process Chromatography Market Estimates and Forecasts, by Chromatography Type (2020-2032) (USD Billion)

10.3.2.9.3 Italy Preparative and Process Chromatography Market Estimates and Forecasts, by End User (2020-2032) (USD Billion)

10.3.2.10 Spain

10.3.2.10.1 Spain Preparative and Process Chromatography Market Estimates and Forecasts, by Product (2020-2032) (USD Billion)

10.3.2.10.2 Spain Preparative and Process Chromatography Market Estimates and Forecasts, by Chromatography Type (2020-2032) (USD Billion)

10.3.2.10.3 Spain Preparative and Process Chromatography Market Estimates and Forecasts, by End User (2020-2032) (USD Billion)

10.3.2.11 Netherlands

10.3.2.11.1 Netherlands Preparative and Process Chromatography Market Estimates and Forecasts, by Product (2020-2032) (USD Billion)

10.3.2.11.2 Netherlands Preparative and Process Chromatography Market Estimates and Forecasts, by Chromatography Type (2020-2032) (USD Billion)

10.3.2.11.3 Netherlands Preparative and Process Chromatography Market Estimates and Forecasts, by End User (2020-2032) (USD Billion)

10.3.2.12 Switzerland

10.3.2.12.1 Switzerland Preparative and Process Chromatography Market Estimates and Forecasts, by Product (2020-2032) (USD Billion)

10.3.2.12.2 Switzerland Preparative and Process Chromatography Market Estimates and Forecasts, by Chromatography Type (2020-2032) (USD Billion)

10.3.2.12.3 Switzerland Preparative and Process Chromatography Market Estimates and Forecasts, by End User (2020-2032) (USD Billion)

10.3.2.13 Austria

10.3.2.13.1 Austria Preparative and Process Chromatography Market Estimates and Forecasts, by Product (2020-2032) (USD Billion)

10.3.2.13.2 Austria Preparative and Process Chromatography Market Estimates and Forecasts, by Chromatography Type (2020-2032) (USD Billion)

10.3.2.13.3 Austria Preparative and Process Chromatography Market Estimates and Forecasts, by End User (2020-2032) (USD Billion)

10.3.2.14 Rest of Western Europe

10.3.2.14.1 Rest of Western Europe Preparative and Process Chromatography Market Estimates and Forecasts, by Product (2020-2032) (USD Billion)

10.3.2.14.2 Rest of Western Europe Preparative and Process Chromatography Market Estimates and Forecasts, by Chromatography Type (2020-2032) (USD Billion)

10.3.2.14.3 Rest of Western Europe Preparative and Process Chromatography Market Estimates and Forecasts, by End User (2020-2032) (USD Billion)

10.4 Asia Pacific

10.4.1 Trends Analysis

10.4.2 Asia Pacific Preparative and Process Chromatography Market Estimates and Forecasts, by Country (2020-2032) (USD Billion)

10.4.3 Asia Pacific Preparative and Process Chromatography Market Estimates and Forecasts, by Product (2020-2032) (USD Billion) 

10.4.4 Asia Pacific Preparative and Process Chromatography Market Estimates and Forecasts, by Chromatography Type (2020-2032) (USD Billion)

10.4.5 Asia Pacific Preparative and Process Chromatography Market Estimates and Forecasts, by End User (2020-2032) (USD Billion)

10.4.6 China

10.4.6.1 China Preparative and Process Chromatography Market Estimates and Forecasts, by Product (2020-2032) (USD Billion)

10.4.6.2 China Preparative and Process Chromatography Market Estimates and Forecasts, by Chromatography Type (2020-2032) (USD Billion)

10.4.6.3 China Preparative and Process Chromatography Market Estimates and Forecasts, by End User (2020-2032) (USD Billion)

10.4.7 India

10.4.7.1 India Preparative and Process Chromatography Market Estimates and Forecasts, by Product (2020-2032) (USD Billion)

10.4.7.2 India Preparative and Process Chromatography Market Estimates and Forecasts, by Chromatography Type (2020-2032) (USD Billion)

10.4.7.3 India Preparative and Process Chromatography Market Estimates and Forecasts, by End User (2020-2032) (USD Billion)

10.4.8 Japan

10.4.8.1 Japan Preparative and Process Chromatography Market Estimates and Forecasts, by Product (2020-2032) (USD Billion)

10.4.8.2 Japan Preparative and Process Chromatography Market Estimates and Forecasts, by Chromatography Type (2020-2032) (USD Billion)

10.4.8.3 Japan Preparative and Process Chromatography Market Estimates and Forecasts, by End User (2020-2032) (USD Billion)

10.4.9 South Korea

10.4.9.1 South Korea Preparative and Process Chromatography Market Estimates and Forecasts, by Product (2020-2032) (USD Billion)

10.4.9.2 South Korea Preparative and Process Chromatography Market Estimates and Forecasts, by Chromatography Type (2020-2032) (USD Billion)

10.4.9.3 South Korea Preparative and Process Chromatography Market Estimates and Forecasts, by End User (2020-2032) (USD Billion)

10.4.10 Vietnam

10.4.10.1 Vietnam Preparative and Process Chromatography Market Estimates and Forecasts, by Product (2020-2032) (USD Billion)

10.4.10.2 Vietnam Preparative and Process Chromatography Market Estimates and Forecasts, by Chromatography Type (2020-2032) (USD Billion)

10.4.10.3 Vietnam Preparative and Process Chromatography Market Estimates and Forecasts, by End User (2020-2032) (USD Billion)

10.4.11 Singapore

10.4.11.1 Singapore Preparative and Process Chromatography Market Estimates and Forecasts, by Product (2020-2032) (USD Billion)

10.4.11.2 Singapore Preparative and Process Chromatography Market Estimates and Forecasts, by Chromatography Type (2020-2032) (USD Billion)

10.4.11.3 Singapore Preparative and Process Chromatography Market Estimates and Forecasts, by End User (2020-2032) (USD Billion)

10.4.12 Australia

10.4.12.1 Australia Preparative and Process Chromatography Market Estimates and Forecasts, by Product (2020-2032) (USD Billion)

10.4.12.2 Australia Preparative and Process Chromatography Market Estimates and Forecasts, by Chromatography Type (2020-2032) (USD Billion)

10.4.12.3 Australia Preparative and Process Chromatography Market Estimates and Forecasts, by End User (2020-2032) (USD Billion)

10.4.13 Rest of Asia Pacific

10.4.13.1 Rest of Asia Pacific Preparative and Process Chromatography Market Estimates and Forecasts, by Product (2020-2032) (USD Billion)

10.4.13.2 Rest of Asia Pacific Preparative and Process Chromatography Market Estimates and Forecasts, by Chromatography Type (2020-2032) (USD Billion)

10.4.13.3 Rest of Asia Pacific Preparative and Process Chromatography Market Estimates and Forecasts, by End User (2020-2032) (USD Billion)

10.5 Middle East and Africa

10.5.1 Middle East

10.5.1.1 Trends Analysis

10.5.1.2 Middle East Preparative and Process Chromatography Market Estimates and Forecasts, by Country (2020-2032) (USD Billion)

10.5.1.3 Middle East Preparative and Process Chromatography Market Estimates and Forecasts, by Product (2020-2032) (USD Billion) 

10.5.1.4 Middle East Preparative and Process Chromatography Market Estimates and Forecasts, by Chromatography Type (2020-2032) (USD Billion)

10.5.1.5 Middle East Preparative and Process Chromatography Market Estimates and Forecasts, by End User (2020-2032) (USD Billion)

10.5.1.6 UAE

10.5.1.6.1 UAE Preparative and Process Chromatography Market Estimates and Forecasts, by Product (2020-2032) (USD Billion)

10.5.1.6.2 UAE Preparative and Process Chromatography Market Estimates and Forecasts, by Chromatography Type (2020-2032) (USD Billion)

10.5.1.6.3 UAE Preparative and Process Chromatography Market Estimates and Forecasts, by End User (2020-2032) (USD Billion)

10.5.1.7 Egypt

10.5.1.7.1 Egypt Preparative and Process Chromatography Market Estimates and Forecasts, by Product (2020-2032) (USD Billion)

10.5.1.7.2 Egypt Preparative and Process Chromatography Market Estimates and Forecasts, by Chromatography Type (2020-2032) (USD Billion)

10.5.1.7.3 Egypt Preparative and Process Chromatography Market Estimates and Forecasts, by End User (2020-2032) (USD Billion)

10.5.1.8 Saudi Arabia

10.5.1.8.1 Saudi Arabia Preparative and Process Chromatography Market Estimates and Forecasts, by Product (2020-2032) (USD Billion)

10.5.1.8.2 Saudi Arabia Preparative and Process Chromatography Market Estimates and Forecasts, by Chromatography Type (2020-2032) (USD Billion)

10.5.1.8.3 Saudi Arabia Preparative and Process Chromatography Market Estimates and Forecasts, by End User (2020-2032) (USD Billion)

10.5.1.9 Qatar

10.5.1.9.1 Qatar Preparative and Process Chromatography Market Estimates and Forecasts, by Product (2020-2032) (USD Billion)

10.5.1.9.2 Qatar Preparative and Process Chromatography Market Estimates and Forecasts, by Chromatography Type (2020-2032) (USD Billion)

10.5.1.9.3 Qatar Preparative and Process Chromatography Market Estimates and Forecasts, by End User (2020-2032) (USD Billion)

10.5.1.10 Rest of Middle East

10.5.1.10.1 Rest of Middle East Preparative and Process Chromatography Market Estimates and Forecasts, by Product (2020-2032) (USD Billion)

10.5.1.10.2 Rest of Middle East Preparative and Process Chromatography Market Estimates and Forecasts, by Chromatography Type (2020-2032) (USD Billion)

10.5.1.10.3 Rest of Middle East Preparative and Process Chromatography Market Estimates and Forecasts, by End User (2020-2032) (USD Billion)

10.5.2 Africa

10.5.2.1 Trends Analysis

10.5.2.2 Africa Preparative and Process Chromatography Market Estimates and Forecasts, by Country (2020-2032) (USD Billion)

10.5.2.3 Africa Preparative and Process Chromatography Market Estimates and Forecasts, by Product (2020-2032) (USD Billion) 

10.5.2.4 Africa Preparative and Process Chromatography Market Estimates and Forecasts, by Chromatography Type (2020-2032) (USD Billion)

10.5.2.5 Africa Preparative and Process Chromatography Market Estimates and Forecasts, by End User (2020-2032) (USD Billion)

10.5.2.6 South Africa

10.5.2.6.1 South Africa Preparative and Process Chromatography Market Estimates and Forecasts, by Product (2020-2032) (USD Billion)

10.5.2.6.2 South Africa Preparative and Process Chromatography Market Estimates and Forecasts, by Chromatography Type (2020-2032) (USD Billion)

10.5.2.6.3 South Africa Preparative and Process Chromatography Market Estimates and Forecasts, by End User (2020-2032) (USD Billion)

10.5.2.7 Nigeria

10.5.2.7.1 Nigeria Preparative and Process Chromatography Market Estimates and Forecasts, by Product (2020-2032) (USD Billion)

10.5.2.7.2 Nigeria Preparative and Process Chromatography Market Estimates and Forecasts, by Chromatography Type (2020-2032) (USD Billion)

10.5.2.7.3 Nigeria Preparative and Process Chromatography Market Estimates and Forecasts, by End User (2020-2032) (USD Billion)

10.5.2.8 Rest of Africa

10.5.2.8.1 Rest of Africa Preparative and Process Chromatography Market Estimates and Forecasts, by Product (2020-2032) (USD Billion)

10.5.2.8.2 Rest of Africa Preparative and Process Chromatography Market Estimates and Forecasts, by Chromatography Type (2020-2032) (USD Billion)

10.5.2.8.3 Rest of Africa Preparative and Process Chromatography Market Estimates and Forecasts, by End User (2020-2032) (USD Billion)

10.6 Latin America

10.6.1 Trends Analysis

10.6.2 Latin America Preparative and Process Chromatography Market Estimates and Forecasts, by Country (2020-2032) (USD Billion)

10.6.3 Latin America Preparative and Process Chromatography Market Estimates and Forecasts, by Product (2020-2032) (USD Billion) 

10.6.4 Latin America Preparative and Process Chromatography Market Estimates and Forecasts, by Chromatography Type (2020-2032) (USD Billion)

10.6.5 Latin America Preparative and Process Chromatography Market Estimates and Forecasts, by End User (2020-2032) (USD Billion)

10.6.6 Brazil

10.6.6.1 Brazil Preparative and Process Chromatography Market Estimates and Forecasts, by Product (2020-2032) (USD Billion)

10.6.6.2 Brazil Preparative and Process Chromatography Market Estimates and Forecasts, by Chromatography Type (2020-2032) (USD Billion)

10.6.6.3 Brazil Preparative and Process Chromatography Market Estimates and Forecasts, by End User (2020-2032) (USD Billion)

10.6.7 Argentina

10.6.7.1 Argentina Preparative and Process Chromatography Market Estimates and Forecasts, by Product (2020-2032) (USD Billion)

10.6.7.2 Argentina Preparative and Process Chromatography Market Estimates and Forecasts, by Chromatography Type (2020-2032) (USD Billion)

10.6.7.3 Argentina Preparative and Process Chromatography Market Estimates and Forecasts, by End User (2020-2032) (USD Billion)

10.6.8 Colombia

10.6.8.1 Colombia Preparative and Process Chromatography Market Estimates and Forecasts, by Product (2020-2032) (USD Billion)

10.6.8.2 Colombia Preparative and Process Chromatography Market Estimates and Forecasts, by Chromatography Type (2020-2032) (USD Billion)

10.6.8.3 Colombia Preparative and Process Chromatography Market Estimates and Forecasts, by End User (2020-2032) (USD Billion)

10.6.9 Rest of Latin America

10.6.9.1 Rest of Latin America Preparative and Process Chromatography Market Estimates and Forecasts, by Product (2020-2032) (USD Billion)

10.6.9.2 Rest of Latin America Preparative and Process Chromatography Market Estimates and Forecasts, by Chromatography Type (2020-2032) (USD Billion)

10.6.9.3 Rest of Latin America Preparative and Process Chromatography Market Estimates and Forecasts, by End User (2020-2032) (USD Billion)

11. Company Profiles

11.1 GE Healthcare

11.1.1 Company Overview

11.1.2 Financial

11.1.3 Products/ Services Offered

11.1.4 SWOT Analysis

11.2 Agilent Technologies

11.2.1 Company Overview

11.2.2 Financial

11.2.3 Products/ Services Offered

11.2.4 SWOT Analysis

11.3 Danaher Corporation

11.3.1 Company Overview

11.3.2 Financial

11.3.3 Products/ Services Offered

11.3.4 SWOT Analysis

11.4 Bio-Rad Laboratories Inc.

11.4.1 Company Overview

11.4.2 Financial

11.4.3 Products/ Services Offered

11.4.4 SWOT Analysis

11.5 Merck KGaA

11.5.1 Company Overview

11.5.2 Financial

11.5.3 Products/ Services Offered

11.5.4 SWOT Analysis

11.6 Thermo Fisher Scientific Inc.

11.6.1 Company Overview

11.6.2 Financial

11.6.3 Products/ Services Offered

11.6.4 SWOT Analysis

11.7 Shimadzu Corporation

11.7.1 Company Overview

11.7.2 Financial

11.7.3 Products/ Services Offered

11.7.4 SWOT Analysis

11.8 Novasep Holding S.A.S

11.8.1 Company Overview

11.8.2 Financial

11.8.3 Products/ Services Offered

11.8.4 SWOT Analysis

11.9 Waters Corporation

11.9.1 Company Overview

11.9.2 Financial

11.9.3 Products/ Services Offered

11.9.4 SWOT Analysis

11.10 PerkinElmer Inc.

11.10.1 Company Overview

11.10.2 Financial

11.10.3 Products/ Services Offered

11.10.4 SWOT Analysis

12. Use Cases and Best Practices

13. Conclusion

An accurate research report requires proper strategizing as well as implementation. There are multiple factors involved in the completion of good and accurate research report and selecting the best methodology to compete the research is the toughest part. Since the research reports we provide play a crucial role in any company’s decision-making process, therefore we at SNS Insider always believe that we should choose the best method which gives us results closer to reality. This allows us to reach at a stage wherein we can provide our clients best and accurate investment to output ratio.

Each report that we prepare takes a timeframe of 350-400 business hours for production. Starting from the selection of titles through a couple of in-depth brain storming session to the final QC process before uploading our titles on our website we dedicate around 350 working hours. The titles are selected based on their current market cap and the foreseen CAGR and growth.


The 5 steps process:

Step 1: Secondary Research:

Secondary Research or Desk Research is as the name suggests is a research process wherein, we collect data through the readily available information. In this process we use various paid and unpaid databases which our team has access to and gather data through the same. This includes examining of listed companies’ annual reports, Journals, SEC filling etc. Apart from this our team has access to various associations across the globe across different industries. Lastly, we have exchange relationships with various university as well as individual libraries.

Secondary Research

Step 2: Primary Research

When we talk about primary research, it is a type of study in which the researchers collect relevant data samples directly, rather than relying on previously collected data.  This type of research is focused on gaining content specific facts that can be sued to solve specific problems. Since the collected data is fresh and first hand therefore it makes the study more accurate and genuine.

We at SNS Insider have divided Primary Research into 2 parts.

Part 1 wherein we interview the KOLs of major players as well as the upcoming ones across various geographic regions. This allows us to have their view over the market scenario and acts as an important tool to come closer to the accurate market numbers. As many as 45 paid and unpaid primary interviews are taken from both the demand and supply side of the industry to make sure we land at an accurate judgement and analysis of the market.

This step involves the triangulation of data wherein our team analyses the interview transcripts, online survey responses and observation of on filed participants. The below mentioned chart should give a better understanding of the part 1 of the primary interview.

Primary Research

Part 2: In this part of primary research the data collected via secondary research and the part 1 of the primary research is validated with the interviews from individual consultants and subject matter experts.

Consultants are those set of people who have at least 12 years of experience and expertise within the industry whereas Subject Matter Experts are those with at least 15 years of experience behind their back within the same space. The data with the help of two main processes i.e., FGDs (Focused Group Discussions) and IDs (Individual Discussions). This gives us a 3rd party nonbiased primary view of the market scenario making it a more dependable one while collation of the data pointers.

Step 3: Data Bank Validation

Once all the information is collected via primary and secondary sources, we run that information for data validation. At our intelligence centre our research heads track a lot of information related to the market which includes the quarterly reports, the daily stock prices, and other relevant information. Our data bank server gets updated every fortnight and that is how the information which we collected using our primary and secondary information is revalidated in real time.

Data Bank Validation

Step 4: QA/QC Process

After all the data collection and validation our team does a final level of quality check and quality assurance to get rid of any unwanted or undesired mistakes. This might include but not limited to getting rid of the any typos, duplication of numbers or missing of any important information. The people involved in this process include technical content writers, research heads and graphics people. Once this process is completed the title gets uploader on our platform for our clients to read it.

Step 5: Final QC/QA Process:

This is the last process and comes when the client has ordered the study. In this process a final QA/QC is done before the study is emailed to the client. Since we believe in giving our clients a good experience of our research studies, therefore, to make sure that we do not lack at our end in any way humanly possible we do a final round of quality check and then dispatch the study to the client.

Key Segments:

By Product

  • By Preparative Chromatography
    • Consumables
      • Columns
      • Reagents
      • Resins
    • Systems
  • By Process Chromatography
    • Consumable
      • Column
      • Reagent
      • Resin
    • System

By Chromatography Type

  • Liquid Chromatography
  • Gas Chromatography
  • Thin Layer Chromatography
  • Paper Chromatography
  • Others

By End User

  • Food Industry
  • Nutraceutical Industry
  • Bio-Pharmaceutical Industry
  • Oil & Gas Industry
  • Diagnostics
  • Academic and Research Institutes

Request for Segment Customization as per your Business Requirement: Segment Customization Request

Regional Coverage:

North America

  • US
  • Canada
  • Mexico

Europe

  • Eastern Europe
    • Poland
    • Romania
    • Hungary
    • Turkey
    • Rest of Eastern Europe
  • Western Europe
    • Germany
    • France
    • UK
    • Italy
    • Spain
    • Netherlands
    • Switzerland
    • Austria
    • Rest of Western Europe

Asia Pacific

  • China
  • India
  • Japan
  • South Korea
  • Vietnam
  • Singapore
  • Australia
  • Rest of Asia Pacific

Middle East & Africa

  • Middle East
    • UAE
    • Egypt
    • Saudi Arabia
    • Qatar
    • Rest of Middle East
  • Africa
    • Nigeria
    • South Africa
    • Rest of Africa

Latin America

  • Brazil
  • Argentina
  • Colombia
  • Rest of Latin America

Request for Country Level Research Report: Country Level Customization Request

Available Customization

With the given market data, SNS Insider offers customization as per the company’s specific needs. The following customization options are available for the report:

  • Detailed Volume Analysis
  • Criss-Cross segment analysis (e.g. Product X Application)
  • Competitive Product Benchmarking
  • Geographic Analysis
  • Additional countries in any of the regions
  • Customized Data Representation
  • Detailed analysis and profiling of additional market players


  •            5000 (33% Discount)


  •            8950 (40% Discount)


  •            3050 (23% Discount)

Start a Conversation

Hi! Click one of our member below to chat on Phone