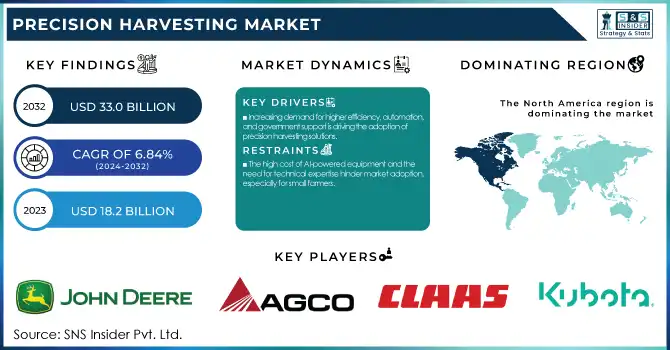
The Precision Harvesting Market Size was valued at USD 18.2 Billion in 2023 and is expected to reach USD 33.0 Billion by 2032, growing at a CAGR of 6.84% from 2024-2032. The growth of smart farming infrastructure, powered by IoT and AI-driven analytics, is revolutionizing global agricultural practices. AI and robotics in harvesting are expanding rapidly, with developed nations driving innovation, while emerging regions prioritize mechanization to enhance productivity and efficiency. North America and Europe lead in adopting precision agriculture technologies, while Asia-Pacific and Latin America are steadily advancing in smart farming.
To Get more information on Precision Harvesting Market - Request Free Sample Report
Drivers
Increasing demand for higher efficiency, automation, and government support is driving the adoption of precision harvesting solutions.
The rise in need for advanced agricultural output & productivity levels is anticipated to drive the precision harvesting solutions adoption. With the aid of technologies like GPS guidance in machinery, Artificial Intelligence analyzing data & Internet of Things-based sensors, the farmers are assuring better harvesting with lesser wastage of crops and thriving quality. Moreover, government initiatives toward smart farming practices and subsidies for precision farming equipment are strengthening market growth. In addition, the global food demand increase, together with a decrease in the agricultural labor pool has sharpened the urge for automation for harvesting, which also is driving the adoption of advanced technologies by farmers, in turn enhancing resource utilization and bettering profits.
Restraints
The high cost of AI-powered equipment and the need for technical expertise hinder market adoption, especially for small farmers.
Although precision harvesting could gain from widespread adoption, the price of specialized gear is stuck at a high level, and also freshly evolved tech is not often well-matched with the farm technologies that are presently in use. Precision harvesting systems are typically hard to afford for small and medium-scale farmers — especially in developing countries, due primarily to the high cost of these AI-powered harvesters, robotics, and real-time monitoring systems. Moreover, the requirement of having specialized training and technical skills to operate these systems prevents them from getting implemented on a large scale. Additionally, poor connectivity, especially at rural levels, continues to impede the growth of the market.
Opportunities
AI-driven automation, machine learning, and 5G connectivity are revolutionizing precision harvesting, improving efficiency, and reducing losses.
Ongoing advancements in AI, robotics, and automation are creating new growth prospects in precise harvesting. Machine learning and computer vision-powered autonomous harvesters can not only identify patterns but detect crops to find commercial maturity, therefore reducing wastage and scheduling harvesting at the right time. With 5G connectivity and real-time data analytics, the location of every piece of farm equipment can be easily monitored, and coordinated with cloud-based data for decision-making. Additionally, agri-tech startup investments and collaborations between agri-businesses and tech companies are encouraging innovations that are making precision harvesting solutions easier and cheaper for farmers around the world.
Challenges
Lack of awareness, poor connectivity, and reliance on traditional methods restrict precision harvesting adoption in emerging economies.
The absence of awareness and limited digital infrastructure in developing regions is one of the significant factors hampering the precision harvesting market. Even now, a considerable fraction of the farmers are dependent on traditional harvesting methods and are not familiar with precision farming methods. Low internet connectivity, poor access to cloud computing, and lack of skill in precision harvesting technologies are major constraints for adoption. Moreover, in the less developed agricultural background, the expansion of the market is limited by traditional farmers are hesitant to put into automated harvesting more, as they worry about the cost and reliability of automatic harvesting.
By Product
In 2023, the combined harvesters segment dominated the market and accounted for a revenue share of more than 49% in the market. The rising adoption of mechanized farming equipment that increases productivity and lowers labor costs is propelling this growth. Moreover, the ease of usage of multi-functional wheel-type combine harvesters which can be used in different field conditions has propelled the segment further upward.
The harvesting robots segment is projected to grow at the fastest CAGR during the forecast period. Much of this growth happens across the backdrop of near-constant advancement of autonomous technology and growing interest in the automation of agriculture. As labor shortages loom larger on the horizon, harvesting robots are delivering efficiencies that increase yields while decreasing dependence on human labor.
By Application
In 2023, the crop segment dominated the market and accounted for significant revenue share. This rise is attributable to the growing need for efficient solutions for harvesting in agriculture as farmers are swiftly adopting precision harvesting technologies to improve productivity and yield. In addition to this, the segment is benefitting from the increasing trend of sustainable farming practices. As a result, during the forecast period, the crop segment is expected to remain the market leader.
The greenhouse segment is expected to register the fastest CAGR during the forecast period. The growth is driven by the high adoption of smart greenhouse technologies to improve the efficiency of greenhouse operations and optimize plant growth through automation and data analytics. This will greatly increase the demand for Controlled Environment Agriculture from companies that are adopting sustainable practices in their agriculture practices.
By Offering
In 2023, the hardware segment dominated the market and accounted for a significant revenue share. The segment is expected to see growth owing to the rising adoption of highly advanced agricultural machinery and equipment for operational efficiency. Increasing implementation of these precision farming technologies has resulted in a growing demand for hardware solutions that have automation and data analytics capabilities. Further, continued hardware design improvements are changing the ways that farmers do things and driving the growth of the precision harvest space.
The software segment is expected to register the fastest CAGR during the forecast period. Growth in this area is expected to come from the need for data-driven decision-making in agriculture, as farmers look to maximize productivity and efficiency. Farmers can benefit from farm management software that helps them have access to crop ailment, soil, and weather data in real time, leading to a better approach to farming.
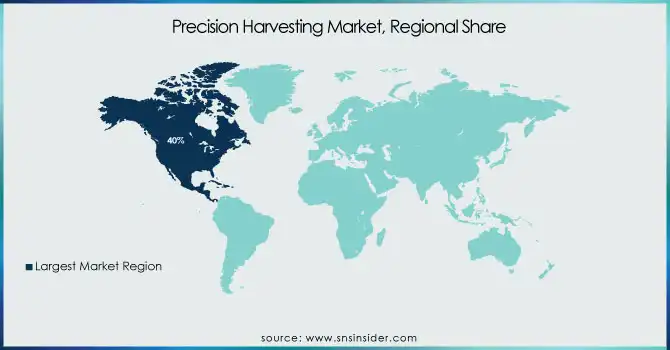
In 2023, North America dominated the precision harvesting market and accounted for the largest revenue share of more than 40%. The combination of early-on integrated application of advanced agricultural technologies and high expenditure on research and development is driving this growth. The region has a strong technology infrastructure and friendly government policies that promote innovations related to farming methods. Moreover, the rising need for effective and sustainable agricultural solutions reinforces the region's dominance in the precision harvesting market.
The Asia Pacific precision harvesting market is expected to achieve the fastest CAGR. The growth is due to rising urbanization and an increasing population driving food consumption in the region. Moreover, the growing importance of sustainable agriculture alongside advances in technology supports the early adoption of precision harvesting solutions.
Get Customized Report as per Your Business Requirement - Enquiry Now
The major key players along with their products are
John Deere – Combine Harvester S-Series
AGCO Corporation – Fendt IDEAL Combine
CLAAS – LEXION Combine Harvester
CNH Industrial – New Holland CR Series Combine
Kubota Corporation – PRO1408Y Paddy Harvester
Yanmar Co., Ltd. – AW82V Rice Combine Harvester
Mahindra & Mahindra Ltd. – Arjun Novo 605 DI-I Harvester
Trimble Inc. – GreenSeeker Crop Sensing System
Topcon Corporation – YieldTrakk Harvest Monitoring System
Raven Industries – AutoCart Autonomous Grain Cart
TeeJet Technologies – Matrix 908 Guidance System
Ag Leader Technology – InCommand 1200 Display
Hexagon Agriculture – HxGN AgrOn Harvest Planning
Zunhammer GmbH – Slurry Injecting Precision Harvester
Pöttinger Landtechnik GmbH – JUMBO Forage Wagon
In June 2024, Case IH introduced the Axial-Flow 260 series combine, featuring integrated technology designed to meet the unique needs of growers.
In October 2024, Wilmar Sugar and Renewables, Australia's largest raw sugar manufacturer and exporter, had processed 56% of the estimated 15.54 million tonnes of sugarcane across its eight mills, aiming to complete the harvest by December.
| Report Attributes | Details |
|---|---|
| Market Size in 2023 | USD 18.2 Billion |
| Market Size by 2032 | USD 33.0 Billion |
| CAGR | CAGR of 6.84% From 2024 to 2032 |
| Base Year | 2023 |
| Forecast Period | 2024-2032 |
| Historical Data | 2020-2022 |
| Report Scope & Coverage | Market Size, Segments Analysis, Competitive Landscape, Regional Analysis, DROC & SWOT Analysis, Forecast Outlook |
| Key Segments | • By Application (Crop, Greenhouse, Horticulture, Others) • By Product (Combine Harvesters, Harvesting Robots, Self-Propelled Forage Harvesters) • By Offering (Hardware, Software, Services) |
| Regional Analysis/Coverage | North America (US, Canada, Mexico), Europe (Eastern Europe [Poland, Romania, Hungary, Turkey, Rest of Eastern Europe] Western Europe] Germany, France, UK, Italy, Spain, Netherlands, Switzerland, Austria, Rest of Western Europe]), Asia Pacific (China, India, Japan, South Korea, Vietnam, Singapore, Australia, Rest of Asia Pacific), Middle East & Africa (Middle East [UAE, Egypt, Saudi Arabia, Qatar, Rest of Middle East], Africa [Nigeria, South Africa, Rest of Africa], Latin America (Brazil, Argentina, Colombia, Rest of Latin America) |
| Company Profiles | John Deere, AGCO Corporation, CLAAS, CNH Industrial, Kubota Corporation, Yanmar Co., Ltd., Mahindra & Mahindra Ltd., Trimble Inc., Topcon Corporation, Raven Industries, TeeJet Technologies, Ag Leader Technology, Hexagon Agriculture, Zunhammer GmbH, Pöttinger Landtechnik GmbH. |
Ans The Precision Harvesting Market was valued at USD 18.2 Billion in 2023 and is expected to reach USD 33.0 Billion by 2032.
Ans- The CAGR of the Precision Harvesting Market during the forecast period is 6.84% from 2024-2032.
Ans- Asia-Pacific is expected to register the fastest CAGR during the forecast period.
Ans- Increasing demand for higher efficiency, automation, and government support is driving the adoption of precision harvesting solutions.
Ans- Lack of awareness, poor connectivity, and reliance on traditional methods restrict precision harvesting adoption in emerging economies.
1. Introduction
1.1 Market Definition
1.2 Scope (Inclusion and Exclusions)
1.3 Research Assumptions
2. Executive Summary
2.1 Market Overview
2.2 Regional Synopsis
2.3 Competitive Summary
3. Research Methodology
3.1 Top-Down Approach
3.2 Bottom-up Approach
3.3. Data Validation
3.4 Primary Interviews
4. Market Dynamics Impact Analysis
4.1 Market Driving Factors Analysis
4.1.1 Drivers
4.1.2 Restraints
4.1.3 Opportunities
4.1.4 Challenges
4.2 PESTLE Analysis
4.3 Porter’s Five Forces Model
5. Statistical Insights and Trends Reporting
5.1 Adoption Rates of Precision Agriculture Technologies, by Region
5.2 Expansion of Smart Farming Infrastructure, by Region
5.3 Agricultural Productivity Improvement, by Region (2020-2023)
5.4 Use of AI and Robotics in Harvesting, by Region
6. Competitive Landscape
6.1 List of Major Companies, By Region
6.2 Market Share Analysis, By Region
6.3 Product Benchmarking
6.3.1 Product specifications and features
6.3.2 Pricing
6.4 Strategic Initiatives
6.4.1 Marketing and promotional activities
6.4.2 Distribution and supply chain strategies
6.4.3 Expansion plans and new product launches
6.4.4 Strategic partnerships and collaborations
6.5 Technological Advancements
6.6 Market Positioning and Branding
7. Precision Harvesting Market Segmentation, By Application
7.1 Chapter Overview
7.2 Crop
7.2.1 Crop Market Trends Analysis (2020-2032)
7.2.2 Crop Market Size Estimates and Forecasts to 2032 (USD Billion)
7.3 Greenhouse
7.3.1 Greenhouse Market Trends Analysis (2020-2032)
7.3.2 Greenhouse Market Size Estimates and Forecasts to 2032 (USD Billion)
7.4 Horticulture
7.4.1 Horticulture Market Trends Analysis (2020-2032)
7.4.2 Horticulture Market Size Estimates and Forecasts to 2032 (USD Billion)
7.5 Others
7.5.1 Others Market Trends Analysis (2020-2032)
7.5.2 Others Market Size Estimates and Forecasts to 2032 (USD Billion)
8. Precision Harvesting Market Segmentation, by Product
8.1 Chapter Overview
8.2 Combine Harvesters
8.2.1 Combine Harvesters Market Trends Analysis (2020-2032)
8.2.2 Combine Harvesters Market Size Estimates and Forecasts to 2032 (USD Billion)
8.3 Harvesting Robots
8.3.1 Harvesting Robots Market Trends Analysis (2020-2032)
8.3.2 Harvesting Robots Market Size Estimates and Forecasts to 2032 (USD Billion)
8.4 Self-Propelled Forage Harvesters
8.4.1 Self-Propelled Forage Harvesters Market Trends Analysis (2020-2032)
8.4.2 Self-Propelled Forage Harvesters Market Size Estimates and Forecasts to 2032 (USD Billion)
9. Precision Harvesting Market Segmentation, by Offering
9.1 Chapter Overview
9.2 Hardware
9.2.1 Hardware Market Trends Analysis (2020-2032)
9.2.2Hardware Market Size Estimates and Forecasts to 2032 (USD Billion)
9.2.3Automation & Control System
9.2.3.1Automation & Control System Market Trends Analysis (2020-2032)
9.2.3.2Automation & Control System Market Size Estimates and Forecasts to 2032 (USD Billion)
9.2.4 Sensing Devices
9.2.4.1Sensing Devices Market Trends Analysis (2020-2032)
9.2.4.2 Sensing Devices Market Size Estimates and Forecasts to 2032 (USD Billion)
9.2.5 Others
9.2.5.1 Others Devices Market Trends Analysis (2020-2032)
9.2.5.2 Others Market Size Estimates and Forecasts to 2032 (USD Billion)
9.3 Software
9.3.1 Software Market Trends Analysis (2020-2032)
9.3.2 Software Market Size Estimates and Forecasts to 2032 (USD Billion)
9.4 Services
9.4.1 Services Market Trends Analysis (2020-2032)
9.4.2 Services Market Size Estimates and Forecasts to 2032 (USD Billion)
10. Regional Analysis
10.1 Chapter Overview
10.2 North America
10.2.1 Trends Analysis
10.2.2 North America Precision Harvesting Market Estimates and Forecasts, by Country (2020-2032) (USD Billion)
10.2.3 North America Precision Harvesting Market Estimates and Forecasts, By Application (2020-2032) (USD Billion)
10.2.4 North America Precision Harvesting Market Estimates and Forecasts, by Product (2020-2032) (USD Billion)
10.2.5 North America Precision Harvesting Market Estimates and Forecasts, by Offering (2020-2032) (USD Billion)
10.2.6 USA
10.2.6.1 USA Precision Harvesting Market Estimates and Forecasts, By Application (2020-2032) (USD Billion)
10.2.6.2 USA Precision Harvesting Market Estimates and Forecasts, by Product (2020-2032) (USD Billion)
10.2.6.3 USA Precision Harvesting Market Estimates and Forecasts, by Offering (2020-2032) (USD Billion)
10.2.7 Canada
10.2.7.1 Canada Precision Harvesting Market Estimates and Forecasts, By Application (2020-2032) (USD Billion)
10.2.7.2 Canada Precision Harvesting Market Estimates and Forecasts, by Product (2020-2032) (USD Billion)
10.2.7.3 Canada Precision Harvesting Market Estimates and Forecasts, by Offering (2020-2032) (USD Billion)
10.2.8 Mexico
10.2.8.1 Mexico Precision Harvesting Market Estimates and Forecasts, By Application (2020-2032) (USD Billion)
10.2.8.2 Mexico Precision Harvesting Market Estimates and Forecasts, by Product (2020-2032) (USD Billion)
10.2.8.3 Mexico Precision Harvesting Market Estimates and Forecasts, by Offering (2020-2032) (USD Billion)
10.3 Europe
10.3.1 Eastern Europe
10.3.1.1 Trends Analysis
10.3.1.2 Eastern Europe Precision Harvesting Market Estimates and Forecasts, by Country (2020-2032) (USD Billion)
10.3.1.3 Eastern Europe Precision Harvesting Market Estimates and Forecasts, By Application (2020-2032) (USD Billion)
10.3.1.4 Eastern Europe Precision Harvesting Market Estimates and Forecasts, by Product (2020-2032) (USD Billion)
10.3.1.5 Eastern Europe Precision Harvesting Market Estimates and Forecasts, by Offering (2020-2032) (USD Billion)
10.3.1.6 Poland
10.3.1.6.1 Poland Precision Harvesting Market Estimates and Forecasts, By Application (2020-2032) (USD Billion)
10.3.1.6.2 Poland Precision Harvesting Market Estimates and Forecasts, by Product (2020-2032) (USD Billion)
10.3.1.6.3 Poland Precision Harvesting Market Estimates and Forecasts, by Offering (2020-2032) (USD Billion)
10.3.1.7 Romania
10.3.1.7.1 Romania Precision Harvesting Market Estimates and Forecasts, By Application (2020-2032) (USD Billion)
10.3.1.7.2 Romania Precision Harvesting Market Estimates and Forecasts, by Product (2020-2032) (USD Billion)
10.3.1.7.3 Romania Precision Harvesting Market Estimates and Forecasts, by Offering (2020-2032) (USD Billion)
10.3.1.8 Hungary
10.3.1.8.1 Hungary Precision Harvesting Market Estimates and Forecasts, By Application (2020-2032) (USD Billion)
10.3.1.8.2 Hungary Precision Harvesting Market Estimates and Forecasts, by Product (2020-2032) (USD Billion)
10.3.1.8.3 Hungary Precision Harvesting Market Estimates and Forecasts, by Offering (2020-2032) (USD Billion)
10.3.1.9 Turkey
10.3.1.9.1 Turkey Precision Harvesting Market Estimates and Forecasts, By Application (2020-2032) (USD Billion)
10.3.1.9.2 Turkey Precision Harvesting Market Estimates and Forecasts, by Product (2020-2032) (USD Billion)
10.3.1.9.3 Turkey Precision Harvesting Market Estimates and Forecasts, by Offering (2020-2032) (USD Billion)
10.3.1.10 Rest of Eastern Europe
10.3.1.10.1 Rest of Eastern Europe Precision Harvesting Market Estimates and Forecasts, By Application (2020-2032) (USD Billion)
10.3.1.10.2 Rest of Eastern Europe Precision Harvesting Market Estimates and Forecasts, by Product (2020-2032) (USD Billion)
10.3.1.10.3 Rest of Eastern Europe Precision Harvesting Market Estimates and Forecasts, by Offering (2020-2032) (USD Billion)
10.3.2 Western Europe
10.3.2.1 Trends Analysis
10.3.2.2 Western Europe Precision Harvesting Market Estimates and Forecasts, by Country (2020-2032) (USD Billion)
10.3.2.3 Western Europe Precision Harvesting Market Estimates and Forecasts, By Application (2020-2032) (USD Billion)
10.3.2.4 Western Europe Precision Harvesting Market Estimates and Forecasts, by Product (2020-2032) (USD Billion)
10.3.2.5 Western Europe Precision Harvesting Market Estimates and Forecasts, by Offering (2020-2032) (USD Billion)
10.3.2.6 Germany
10.3.2.6.1 Germany Precision Harvesting Market Estimates and Forecasts, By Application (2020-2032) (USD Billion)
10.3.2.6.2 Germany Precision Harvesting Market Estimates and Forecasts, by Product (2020-2032) (USD Billion)
10.3.2.6.3 Germany Precision Harvesting Market Estimates and Forecasts, by Offering (2020-2032) (USD Billion)
10.3.2.7 France
10.3.2.7.1 France Precision Harvesting Market Estimates and Forecasts, By Application (2020-2032) (USD Billion)
10.3.2.7.2 France Precision Harvesting Market Estimates and Forecasts, by Product (2020-2032) (USD Billion)
10.3.2.7.3 France Precision Harvesting Market Estimates and Forecasts, by Offering (2020-2032) (USD Billion)
10.3.2.8 UK
10.3.2.8.1 UK Precision Harvesting Market Estimates and Forecasts, By Application (2020-2032) (USD Billion)
10.3.2.8.2 UK Precision Harvesting Market Estimates and Forecasts, by Product (2020-2032) (USD Billion)
10.3.2.8.3 UK Precision Harvesting Market Estimates and Forecasts, by Offering (2020-2032) (USD Billion)
10.3.2.9 Italy
10.3.2.9.1 Italy Precision Harvesting Market Estimates and Forecasts, By Application (2020-2032) (USD Billion)
10.3.2.9.2 Italy Precision Harvesting Market Estimates and Forecasts, by Product (2020-2032) (USD Billion)
10.3.2.9.3 Italy Precision Harvesting Market Estimates and Forecasts, by Offering (2020-2032) (USD Billion)
10.3.2.10 Spain
10.3.2.10.1 Spain Precision Harvesting Market Estimates and Forecasts, By Application (2020-2032) (USD Billion)
10.3.2.10.2 Spain Precision Harvesting Market Estimates and Forecasts, by Product (2020-2032) (USD Billion)
10.3.2.10.3 Spain Precision Harvesting Market Estimates and Forecasts, by Offering (2020-2032) (USD Billion)
10.3.2.11 Netherlands
10.3.2.11.1 Netherlands Precision Harvesting Market Estimates and Forecasts, By Application (2020-2032) (USD Billion)
10.3.2.11.2 Netherlands Precision Harvesting Market Estimates and Forecasts, by Product (2020-2032) (USD Billion)
10.3.2.11.3 Netherlands Precision Harvesting Market Estimates and Forecasts, by Offering (2020-2032) (USD Billion)
10.3.2.12 Switzerland
10.3.2.12.1 Switzerland Precision Harvesting Market Estimates and Forecasts, By Application (2020-2032) (USD Billion)
10.3.2.12.2 Switzerland Precision Harvesting Market Estimates and Forecasts, by Product (2020-2032) (USD Billion)
10.3.2.12.3 Switzerland Precision Harvesting Market Estimates and Forecasts, by Offering (2020-2032) (USD Billion)
10.3.2.13 Austria
10.3.2.13.1 Austria Precision Harvesting Market Estimates and Forecasts, By Application (2020-2032) (USD Billion)
10.3.2.13.2 Austria Precision Harvesting Market Estimates and Forecasts, by Product (2020-2032) (USD Billion)
10.3.2.13.3 Austria Precision Harvesting Market Estimates and Forecasts, by Offering (2020-2032) (USD Billion)
10.3.2.14 Rest of Western Europe
10.3.2.14.1 Rest of Western Europe Precision Harvesting Market Estimates and Forecasts, By Application (2020-2032) (USD Billion)
10.3.2.14.2 Rest of Western Europe Precision Harvesting Market Estimates and Forecasts, by Product (2020-2032) (USD Billion)
10.3.2.14.3 Rest of Western Europe Precision Harvesting Market Estimates and Forecasts, by Offering (2020-2032) (USD Billion)
10.4 Asia Pacific
10.4.1 Trends Analysis
10.4.2 Asia Pacific Precision Harvesting Market Estimates and Forecasts, by Country (2020-2032) (USD Billion)
10.4.3 Asia Pacific Precision Harvesting Market Estimates and Forecasts, By Application (2020-2032) (USD Billion)
10.4.4 Asia Pacific Precision Harvesting Market Estimates and Forecasts, by Product (2020-2032) (USD Billion)
10.4.5 Asia Pacific Precision Harvesting Market Estimates and Forecasts, by Offering (2020-2032) (USD Billion)
10.4.6 China
10.4.6.1 China Precision Harvesting Market Estimates and Forecasts, By Application (2020-2032) (USD Billion)
10.4.6.2 China Precision Harvesting Market Estimates and Forecasts, by Product (2020-2032) (USD Billion)
10.4.6.3 China Precision Harvesting Market Estimates and Forecasts, by Offering (2020-2032) (USD Billion)
10.4.7 India
10.4.7.1 India Precision Harvesting Market Estimates and Forecasts, By Application (2020-2032) (USD Billion)
10.4.7.2 India Precision Harvesting Market Estimates and Forecasts, by Product (2020-2032) (USD Billion)
10.4.7.3 India Precision Harvesting Market Estimates and Forecasts, by Offering (2020-2032) (USD Billion)
10.4.8 Japan
10.4.8.1 Japan Precision Harvesting Market Estimates and Forecasts, By Application (2020-2032) (USD Billion)
10.4.8.2 Japan Precision Harvesting Market Estimates and Forecasts, by Product (2020-2032) (USD Billion)
10.4.8.3 Japan Precision Harvesting Market Estimates and Forecasts, by Offering (2020-2032) (USD Billion)
10.4.9 South Korea
10.4.9.1 South Korea Precision Harvesting Market Estimates and Forecasts, By Application (2020-2032) (USD Billion)
10.4.9.2 South Korea Precision Harvesting Market Estimates and Forecasts, by Product (2020-2032) (USD Billion)
10.4.9.3 South Korea Precision Harvesting Market Estimates and Forecasts, by Offering (2020-2032) (USD Billion)
10.4.10 Vietnam
10.4.10.1 Vietnam Precision Harvesting Market Estimates and Forecasts, By Application (2020-2032) (USD Billion)
10.4.10.2 Vietnam Precision Harvesting Market Estimates and Forecasts, by Product (2020-2032) (USD Billion)
10.4.10.3 Vietnam Precision Harvesting Market Estimates and Forecasts, by Offering (2020-2032) (USD Billion)
10.4.11 Singapore
10.4.11.1 Singapore Precision Harvesting Market Estimates and Forecasts, By Application (2020-2032) (USD Billion)
10.4.11.2 Singapore Precision Harvesting Market Estimates and Forecasts, by Product (2020-2032) (USD Billion)
10.4.11.3 Singapore Precision Harvesting Market Estimates and Forecasts, by Offering (2020-2032) (USD Billion)
10.4.12 Australia
10.4.12.1 Australia Precision Harvesting Market Estimates and Forecasts, By Application (2020-2032) (USD Billion)
10.4.12.2 Australia Precision Harvesting Market Estimates and Forecasts, by Product (2020-2032) (USD Billion)
10.4.12.3 Australia Precision Harvesting Market Estimates and Forecasts, by Offering (2020-2032) (USD Billion)
10.4.13 Rest of Asia Pacific
10.4.13.1 Rest of Asia Pacific Precision Harvesting Market Estimates and Forecasts, By Application (2020-2032) (USD Billion)
10.4.13.2 Rest of Asia Pacific Precision Harvesting Market Estimates and Forecasts, by Product (2020-2032) (USD Billion)
10.4.13.3 Rest of Asia Pacific Precision Harvesting Market Estimates and Forecasts, by Offering (2020-2032) (USD Billion)
10.5 Middle East and Africa
10.5.1 Middle East
10.5.1.1 Trends Analysis
10.5.1.2 Middle East Precision Harvesting Market Estimates and Forecasts, by Country (2020-2032) (USD Billion)
10.5.1.3 Middle East Precision Harvesting Market Estimates and Forecasts, By Application (2020-2032) (USD Billion)
10.5.1.4 Middle East Precision Harvesting Market Estimates and Forecasts, by Product (2020-2032) (USD Billion)
10.5.1.5 Middle East Precision Harvesting Market Estimates and Forecasts, by Offering (2020-2032) (USD Billion)
10.5.1.6 UAE
10.5.1.6.1 UAE Precision Harvesting Market Estimates and Forecasts, By Application (2020-2032) (USD Billion)
10.5.1.6.2 UAE Precision Harvesting Market Estimates and Forecasts, by Product (2020-2032) (USD Billion)
10.5.1.6.3 UAE Precision Harvesting Market Estimates and Forecasts, by Offering (2020-2032) (USD Billion)
10.5.1.7 Egypt
10.5.1.7.1 Egypt Precision Harvesting Market Estimates and Forecasts, By Application (2020-2032) (USD Billion)
10.5.1.7.2 Egypt Precision Harvesting Market Estimates and Forecasts, by Product (2020-2032) (USD Billion)
10.5.1.7.3 Egypt Precision Harvesting Market Estimates and Forecasts, by Offering (2020-2032) (USD Billion)
10.5.1.8 Saudi Arabia
10.5.1.8.1 Saudi Arabia Precision Harvesting Market Estimates and Forecasts, By Application (2020-2032) (USD Billion)
10.5.1.8.2 Saudi Arabia Precision Harvesting Market Estimates and Forecasts, by Product (2020-2032) (USD Billion)
10.5.1.8.3 Saudi Arabia Precision Harvesting Market Estimates and Forecasts, by Offering (2020-2032) (USD Billion)
10.5.1.9 Qatar
10.5.1.9.1 Qatar Precision Harvesting Market Estimates and Forecasts, By Application (2020-2032) (USD Billion)
10.5.1.9.2 Qatar Precision Harvesting Market Estimates and Forecasts, by Product (2020-2032) (USD Billion)
10.5.1.9.3 Qatar Precision Harvesting Market Estimates and Forecasts, by Offering (2020-2032) (USD Billion)
10.5.1.10 Rest of Middle East
10.5.1.10.1 Rest of Middle East Precision Harvesting Market Estimates and Forecasts, By Application (2020-2032) (USD Billion)
10.5.1.10.2 Rest of Middle East Precision Harvesting Market Estimates and Forecasts, by Product (2020-2032) (USD Billion)
10.5.1.10.3 Rest of Middle East Precision Harvesting Market Estimates and Forecasts, by Offering (2020-2032) (USD Billion)
10.5.2 Africa
10.5.2.1 Trends Analysis
10.5.2.2 Africa Precision Harvesting Market Estimates and Forecasts, by Country (2020-2032) (USD Billion)
10.5.2.3 Africa Precision Harvesting Market Estimates and Forecasts, By Application (2020-2032) (USD Billion)
10.5.2.4 Africa Precision Harvesting Market Estimates and Forecasts, by Product (2020-2032) (USD Billion)
10.5.2.5 Africa Precision Harvesting Market Estimates and Forecasts, by Offering (2020-2032) (USD Billion)
10.5.2.6 South Africa
10.5.2.6.1 South Africa Precision Harvesting Market Estimates and Forecasts, By Application (2020-2032) (USD Billion)
10.5.2.6.2 South Africa Precision Harvesting Market Estimates and Forecasts, by Product (2020-2032) (USD Billion)
10.5.2.6.3 South Africa Precision Harvesting Market Estimates and Forecasts, by Offering (2020-2032) (USD Billion)
10.5.2.7 Nigeria
10.5.2.7.1 Nigeria Precision Harvesting Market Estimates and Forecasts, By Application (2020-2032) (USD Billion)
10.5.2.7.2 Nigeria Precision Harvesting Market Estimates and Forecasts, by Product (2020-2032) (USD Billion)
10.5.2.7.3 Nigeria Precision Harvesting Market Estimates and Forecasts, by Offering (2020-2032) (USD Billion)
10.5.2.8 Rest of Africa
10.5.2.8.1 Rest of Africa Precision Harvesting Market Estimates and Forecasts, By Application (2020-2032) (USD Billion)
10.5.2.8.2 Rest of Africa Precision Harvesting Market Estimates and Forecasts, by Product (2020-2032) (USD Billion)
10.5.2.8.3 Rest of Africa Precision Harvesting Market Estimates and Forecasts, by Offering (2020-2032) (USD Billion)
10.6 Latin America
10.6.1 Trends Analysis
10.6.2 Latin America Precision Harvesting Market Estimates and Forecasts, by Country (2020-2032) (USD Billion)
10.6.3 Latin America Precision Harvesting Market Estimates and Forecasts, By Application (2020-2032) (USD Billion)
10.6.4 Latin America Precision Harvesting Market Estimates and Forecasts, by Product (2020-2032) (USD Billion)
10.6.5 Latin America Precision Harvesting Market Estimates and Forecasts, by Offering (2020-2032) (USD Billion)
10.6.6 Brazil
10.6.6.1 Brazil Precision Harvesting Market Estimates and Forecasts, By Application (2020-2032) (USD Billion)
10.6.6.2 Brazil Precision Harvesting Market Estimates and Forecasts, by Product (2020-2032) (USD Billion)
10.6.6.3 Brazil Precision Harvesting Market Estimates and Forecasts, by Offering (2020-2032) (USD Billion)
10.6.7 Argentina
10.6.7.1 Argentina Precision Harvesting Market Estimates and Forecasts, By Application (2020-2032) (USD Billion)
10.6.7.2 Argentina Precision Harvesting Market Estimates and Forecasts, by Product (2020-2032) (USD Billion)
10.6.7.3 Argentina Precision Harvesting Market Estimates and Forecasts, by Offering (2020-2032) (USD Billion)
10.6.8 Colombia
10.6.8.1 Colombia Precision Harvesting Market Estimates and Forecasts, By Application (2020-2032) (USD Billion)
10.6.8.2 Colombia Precision Harvesting Market Estimates and Forecasts, by Product (2020-2032) (USD Billion)
10.6.8.3 Colombia Precision Harvesting Market Estimates and Forecasts, by Offering (2020-2032) (USD Billion)
10.6.9 Rest of Latin America
10.6.9.1 Rest of Latin America Precision Harvesting Market Estimates and Forecasts, By Application (2020-2032) (USD Billion)
10.6.9.2 Rest of Latin America Precision Harvesting Market Estimates and Forecasts, by Product (2020-2032) (USD Billion)
10.6.9.3 Rest of Latin America Precision Harvesting Market Estimates and Forecasts, by Offering (2020-2032) (USD Billion)
11. Company Profiles
11.1 John Deere
11.1.1 Company Overview
11.1.2 Financial
11.1.3 Products/ Services Offered
11.1.4 SWOT Analysis
11.2 AGCO Corporation
11.2.1 Company Overview
11.2.2 Financial
11.2.3 Products/ Services Offered
11.2.4 SWOT Analysis
11.3 CLAAS
11.3.1 Company Overview
11.3.2 Financial
11.3.3 Products/ Services Offered
11.3.4 SWOT Analysis
11.4 CNH Industrial
11.4.1 Company Overview
11.4.2 Financial
11.4.3 Products/ Services Offered
11.4.4 SWOT Analysis
11.5 Kubota Corporation
11.5.1 Company Overview
11.5.2 Financial
11.5.3 Products/ Services Offered
11.5.4 SWOT Analysis
11.6 Yanmar Co., Ltd
11.6.1 Company Overview
11.6.2 Financial
11.6.3 Products/ Services Offered
11.6.4 SWOT Analysis
11.7 Mahindra & Mahindra Ltd.
11.7.1 Company Overview
11.7.2 Financial
11.7.3 Products/ Services Offered
11.7.4 SWOT Analysis
11.8 Trimble Inc.
11.8.1 Company Overview
11.8.2 Financial
11.8.3 Products/ Services Offered
11.8.4 SWOT Analysis
11.9 Topcon Corporation
11.9.1 Company Overview
11.9.2 Financial
11.9.3 Products/ Services Offered
11.9.4 SWOT Analysis
11.10 Raven Industries
11.10.1 Company Overview
11.10.2 Financial
11.10.3 Products/ Services Offered
11.10.4 SWOT Analysis
12. Use Cases and Best Practices
13. Conclusion
An accurate research report requires proper strategizing as well as implementation. There are multiple factors involved in the completion of good and accurate research report and selecting the best methodology to compete the research is the toughest part. Since the research reports we provide play a crucial role in any company’s decision-making process, therefore we at SNS Insider always believe that we should choose the best method which gives us results closer to reality. This allows us to reach at a stage wherein we can provide our clients best and accurate investment to output ratio.
Each report that we prepare takes a timeframe of 350-400 business hours for production. Starting from the selection of titles through a couple of in-depth brain storming session to the final QC process before uploading our titles on our website we dedicate around 350 working hours. The titles are selected based on their current market cap and the foreseen CAGR and growth.
The 5 steps process:
Step 1: Secondary Research:
Secondary Research or Desk Research is as the name suggests is a research process wherein, we collect data through the readily available information. In this process we use various paid and unpaid databases which our team has access to and gather data through the same. This includes examining of listed companies’ annual reports, Journals, SEC filling etc. Apart from this our team has access to various associations across the globe across different industries. Lastly, we have exchange relationships with various university as well as individual libraries.

Step 2: Primary Research
When we talk about primary research, it is a type of study in which the researchers collect relevant data samples directly, rather than relying on previously collected data. This type of research is focused on gaining content specific facts that can be sued to solve specific problems. Since the collected data is fresh and first hand therefore it makes the study more accurate and genuine.
We at SNS Insider have divided Primary Research into 2 parts.
Part 1 wherein we interview the KOLs of major players as well as the upcoming ones across various geographic regions. This allows us to have their view over the market scenario and acts as an important tool to come closer to the accurate market numbers. As many as 45 paid and unpaid primary interviews are taken from both the demand and supply side of the industry to make sure we land at an accurate judgement and analysis of the market.
This step involves the triangulation of data wherein our team analyses the interview transcripts, online survey responses and observation of on filed participants. The below mentioned chart should give a better understanding of the part 1 of the primary interview.

Part 2: In this part of primary research the data collected via secondary research and the part 1 of the primary research is validated with the interviews from individual consultants and subject matter experts.
Consultants are those set of people who have at least 12 years of experience and expertise within the industry whereas Subject Matter Experts are those with at least 15 years of experience behind their back within the same space. The data with the help of two main processes i.e., FGDs (Focused Group Discussions) and IDs (Individual Discussions). This gives us a 3rd party nonbiased primary view of the market scenario making it a more dependable one while collation of the data pointers.
Step 3: Data Bank Validation
Once all the information is collected via primary and secondary sources, we run that information for data validation. At our intelligence centre our research heads track a lot of information related to the market which includes the quarterly reports, the daily stock prices, and other relevant information. Our data bank server gets updated every fortnight and that is how the information which we collected using our primary and secondary information is revalidated in real time.

Step 4: QA/QC Process
After all the data collection and validation our team does a final level of quality check and quality assurance to get rid of any unwanted or undesired mistakes. This might include but not limited to getting rid of the any typos, duplication of numbers or missing of any important information. The people involved in this process include technical content writers, research heads and graphics people. Once this process is completed the title gets uploader on our platform for our clients to read it.
Step 5: Final QC/QA Process:
This is the last process and comes when the client has ordered the study. In this process a final QA/QC is done before the study is emailed to the client. Since we believe in giving our clients a good experience of our research studies, therefore, to make sure that we do not lack at our end in any way humanly possible we do a final round of quality check and then dispatch the study to the client.
By Application
Crop
Greenhouse
Horticulture
Others
By Product
Combine Harvesters
Harvesting Robots
Self-Propelled Forage Harvesters
By Offering
Hardware
Sensing Devices
Others
Software
Services
Request for Segment Customization as per your Business Requirement: Segment Customization Request
Regional Coverage:
North America
US
Canada
Mexico
Europe
Eastern Europe
Poland
Romania
Hungary
Turkey
Rest of Eastern Europe
Western Europe
Germany
France
UK
Italy
Spain
Netherlands
Switzerland
Austria
Rest of Western Europe
Asia Pacific
China
India
Japan
South Korea
Vietnam
Singapore
Australia
Rest of Asia Pacific
Middle East & Africa
Middle East
UAE
Egypt
Saudi Arabia
Qatar
Rest of Middle East
Africa
Nigeria
South Africa
Rest of Africa
Latin America
Brazil
Argentina
Colombia
Rest of Latin America
Request for Country Level Research Report: Country Level Customization Request
Available Customization
With the given market data, SNS Insider offers customization as per the company’s specific needs. The following customization options are available for the report:
Detailed Volume Analysis
Criss-Cross segment analysis (e.g. Product X Application)
Competitive Product Benchmarking
Geographic Analysis
Additional countries in any of the regions
Customized Data Representation
Detailed analysis and profiling of additional market players
The Semiconductor Metrology and Inspection Equipment Market Size is expected to reach USD 12.36 billion by 2032, grow at a CAGR of 6.50% by Forecast.
The Signal Generators Market Size was valued at USD 1.48 Billion in 2023 and is expected to grow at a CAGR of 7.90% to reach USD 2.94 Billion by 2032.
The 3D Metrology Market Size was valued at USD 10.88 Billion in 2023 and is expected to grow at a CAGR of 7.97% to reach USD 21.69 Billion by 2032.
The onboard magnetic Sensor Market was valued at USD 1.72 billion in 2023 and is expected to reach USD 3.46 billion by 2032, growing at a CAGR of 8.18% over the forecast period 2024-2032
The Motion Control Market Size was valued at USD 16.27 billion in 2023 and is expected to grow at a CAGR of 5.87% to reach USD 27.10 billion by 2032.
The Gaming Console Market Size was valued at USD 26.65 billion in 2023 and is expected to grow at a CAGR of 8.46% to reach USD 55.36 billion by 2032.

Hi! Click one of our member below to chat on Phone
© 2025 All Rights Reserved by SNS Insider Pvt Ltd


