Get E-PDF Sample Report on Precision Farming Market - Request Sample Report
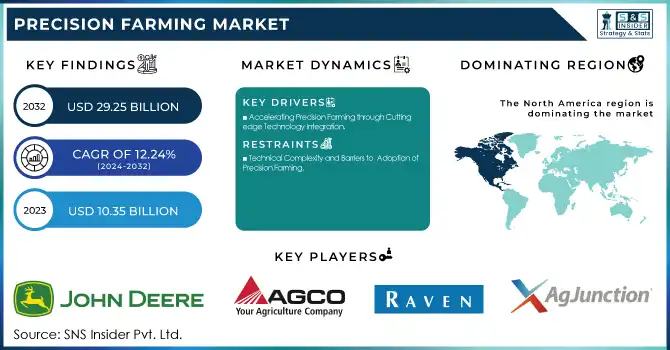
The Precision Farming Market size was valued at USD 9.89 billion in 2023 and is expected to grow to USD 24.49 billion by 2032 and grow at a CAGR of 10.6 % over the forecast period of 2024-2032.
The Precision agriculture (PA) is a farming strategy that uses IT to discover, analyse, and manage variability on a farm in order to increase crop production while requiring less labour from humans.
Through the retrieval of actual data on the conditions of the soil, crops, and weather, precision agriculture enables farmers to analyse the precise quantity of nutrition crops need to optimum production. Farmers are using advanced automation techniques to cut labour and material expenses thanks to precision farming technologies. Precision farming techniques help farmers make better judgments about when to harvest their crops, how to manage their soil and inventories, and how to manage their water resources.
One of the main drivers of the growth of the precision agriculture market is the growing demand for effective crop monitoring, increased acceptance of Internet of Things (IoT) technology, and the usage of advanced analytics by farmers. Furthermore, the adoption of cutting-edge farming technologies by farmers has been greatly facilitated by the altering weather patterns brought on by global warming. Government programs are assisting farmers and agro-businesses in developing nations embrace modern farming technology for higher yield output.
KEY DRIVERS:
Growing movement toward sustainable agriculture and use of different technologies
Increasing environmental concerns among the farmers
Sustainable farming's income growth is being greatly fueled by rising environmental consciousness among people. Various steps are being taken by businesses to promote organic farming. On August 15, 2022, Bayer AG unveiled a digital agriculture platform that will help American farmers adopt environmentally friendly practices and link them up with businesses searching for more sustainable ingredients for food, feed, and biofuel. The proposal would also allow companies, including food producers, to give farmers incentives to grow products in a way that would help them achieve their environmental goals and producers of biofuel.
RESTRAIN:
High cost of Equipment
Lack of awareness of smart technologies in farming
OPPORTUNITY:
Increasing use of AI based technologies in precision farming
Rising technological advancement in farming
Farmers greatly benefit from the ongoing trend of incorporating smart technologies into farming. In contrast to conventional biosensors, the use of nanotechnology in biosensor advancements, for instance, results in an efficient nano biosensor with a compact shape. Among many other things, nano-biosensors can identify different fertilizers, herbicides, pesticides, insecticides, and other chemicals pathogens, pesticides, and pH of the soil. When used properly and under supervision, nano biosensors have the potential to enhance sustainable agriculture and increase crop yield.
CHALLENGES:
Rising population and increased demand of organic food
Collecting and evaluating numerous farm data is difficult
From variable-rate sowing, yield monitoring, mapping, soil testing, and historical crop rotation, precision farming creates a lot of data. Precision farming depends on the analysis of this data for decision-making. It needs to be handled and stored. The main difficulty is managing this enormous volume of data, which calls for high knowledge, and many users lack the expertise to use this data for farm decision-making.
Particularly in the eastern districts most affected by fighting, the war has seriously hurt Ukrainian agriculture. Additionally, the ability of Ukrainian farmers to cultivate and export their commodities has been significantly hampered by the war. The same source calculates that the war has increased indirect costs to agriculture by $36.2 billion, primarily in the form of lost production and greater transportation expenses for continuing agricultural exports. Because Ukraine is a major supplier of grains and oilseeds, particularly corn and wheat, as covered in this article, but also barley, sunflower and sun oil, and other commodities, lost agricultural production there as a result of the war is of worldwide significance.
By Offering
Hardware
Software
Services
By Technology
Guidance Technology
Remote Sensing Technology
Variable Rate Application
By Application
Yield Monitoring
Crop Scouting
Field Mapping
Variable Rate Application
Weather Tracking and Forecasting
Inventory Management
Farm Labor Management
Financial Management
Others (demand forecasting, customer management, payables and receivables)
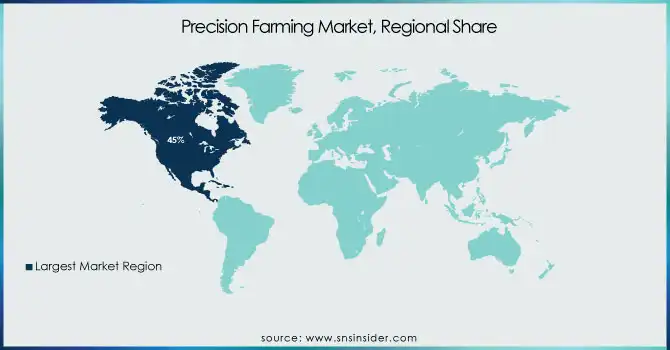
In 2023, North America had the highest revenue share (44.4%). The area is a pioneer in implementing new technologies. The region's market has a high revenue due to factors including expanding government efforts that boost the implementation of modern agriculture technologies and established infrastructure.
Over the anticipated timeframe, Asia Pacific is likely to have significant expansion. From 2023 to 2030, the region is anticipated to experience a CAGR of more than 15.1%. Many government programs are being implemented in emerging nations like India, Sri Lanka, and Nigeria to promote the use of contemporary precision agricultural technologies and increase production.
Get Customized Report as Per Your Business Requirement - Request For Customized Report
REGIONAL COVERAGE:
North America
US
Canada
Mexico
Europe
Eastern Europe
Poland
Romania
Hungary
Turkey
Rest of Eastern Europe
Western Europe
Germany
France
UK
Italy
Spain
Netherlands
Switzerland
Austria
Rest of Western Europe
Asia Pacific
China
India
Japan
South Korea
Vietnam
Singapore
Australia
Rest of Asia Pacific
Middle East & Africa
Middle East
UAE
Egypt
Saudi Arabia
Qatar
Rest of Middle East
Africa
Nigeria
South Africa
Rest of Africa
Latin America
Brazil
Argentina
Colombia
Rest of Latin America
There are some of the key players in the global precision farming Ag Leader Technology, AgJunetion, Inc., CropMetrics LLC, Trimble, Inc., AGCO Corporation, Raven Industries Inc., Deere and Company, Topcon Corporation, Farmers Edge Inc., The Climate Corporation and other players are listed in a final report.
Deere & Company introduced the information management product JDLINK in July 2021. The product offers connectivity services without charging extra. They assist clients with connecting their computers.
The AGCO Corporation's Precision Ag Line (PAL) program, a technology meant to streamline agricultural production, debuted its prototype version in July 2021. services to help farmers with mixed-fleet operations who use AGCO systems. PAL produces precision farming knowledge. offered to farmers from AGCO brands like Massey Ferguson, Challenger, Fendt, Gleaner, and Precision Planting
In May 2021, Raven Industries announced the introduction of its new autonomous product brand, "OMNI." This company emphasizes the capacity of the business to provide autonomous solutions
In May 2021, Raven and other brands joined forces with AGCO, a producer of agricultural gear. The purpose is to assess spraying technique increase the effectiveness and efficiency of crop protection product application.
Report Attributes | Details |
Market Size in 2023 | US$ 9.89 Bn |
Market Size by 2032 | US$ 24.49 Bn |
CAGR | CAGR of 10.6 % From 2024 to 2032 |
Base Year | 2023 |
Forecast Period | 2024-2032 |
Historical Data | 2020-2022 |
Report Scope & Coverage | Market Size, Segments Analysis, Competitive Landscape, Regional Analysis, DROC & SWOT Analysis, Forecast Outlook |
Key Segments | • By Offering (Hardware, Software, Services) • By Technology (Guidance Technology, Remote Sensing Technology, Variable Rate Application) • By Application (Yield Monitoring, Crop Scouting, Field Mapping, Variable Rate Application, Weather Tracking and Forecasting, Inventory Management, Farm Labor Management, Financial Management, Others) |
Regional Analysis/Coverage | North America (US, Canada, Mexico), Europe (Eastern Europe [Poland, Romania, Hungary, Turkey, Rest of Eastern Europe] Western Europe] Germany, France, UK, Italy, Spain, Netherlands, Switzerland, Austria, Rest of Western Europe]). Asia Pacific (China, India, Japan, South Korea, Vietnam, Singapore, Australia, Rest of Asia Pacific), Middle East & Africa (Middle East [UAE, Egypt, Saudi Arabia, Qatar, Rest of Middle East], Africa [Nigeria, South Africa, Rest of Africa], Latin America (Brazil, Argentina, Colombia Rest of Latin America) |
Company Profiles | Ag Leader Technology, AgJunetion, Inc., CropMetrics LLC, Trimble, Inc., AGCO Corporation, Raven Industries Inc., Deere and Company, Topcon Corporation, Farmers Edge Inc., The Climate Corporation |
Key Drivers | • Growing movement toward sustainable agriculture and use of different technologies • Increasing environmental concerns among the farmers |
Market Restraints | • High cost of Equipment • Lack of awareness of smart technologies in farming |
Ans: Precision Farming Market is anticipated to expand by 10.6 % from 2024 to 2031.
Ans: It is estimated to reach USD 24.49 billion by 2032.
Ans: Precision Farming Market size was valued at USD 9.89 billion in 2023
Ans: Increasing use of AI based technologies in precision farming and Rising technological advancement in farming
Ans: Rising population and increased demand of organic food, Collecting and evaluating numerous farm data is difficult
Table of Contents
1. Introduction
1.1 Market Definition
1.2 Scope
1.3 Research Assumptions
2. Research Methodology
3. Market Dynamics
3.1 Drivers
3.2 Restraints
3.3 Opportunities
3.4 Challenges
4. Impact Analysis
4.1 Impact of the Ukraine- Russia war
4.2 Impact of ongoing Recession
4.2.1 Introduction
4.2.2 Impact on major economies
4.2.2.1 US
4.2.2.2 Canada
4.2.2.3 Germany
4.2.2.4 France
4.2.2.5 United Kingdom
4.2.2.6 China
4.2.2.7 Japan
4.2.2.8 South Korea
4.2.2.9 Rest of the World
5. Value Chain Analysis
6. Porter’s 5 forces model
7. PEST Analysis
8. Precision Farming Market Segmentation, By Offering
8.1 Hardware
8.2 Software
8.3 Services
9. Precision Farming Market Segmentation, By Technology
9.1 Guidance Technology
9.2 Remote Sensing Technology
9.3 Variable Rate Application
10. Precision Farming Market Segmentation, By Application
10.1 Yield Monitoring
10.2 Crop Scouting
10.3 Field Mapping
10.4 Variable Rate Application
10.5 Weather Tracking and Forecasting
10.6 Inventory Management
10.7 Farm Labor Management
10.8 Financial Management
10.9 Others (demand forecasting, customer management, payables and receivables)
11. Regional Analysis
11.1 Introduction
11.2 North America
11.2.1 North America Precision Farming Market by Country
11.2.2North America Precision Farming Market by Offering
11.2.3 North America Precision Farming Market by Technology
11.2.4 North America Precision Farming Market by Application
11.2.5 USA
11.2.5.1 USA Precision Farming Market by Offering
11.2.5.2 USA Precision Farming Market by Technology
11.2.5.3 USA Precision Farming Market by Application
11.2.6 Canada
11.2.6.1 Canada Precision Farming Market by Offering
11.2.6.2 Canada Precision Farming Market by Technology
11.2.6.3 Canada Precision Farming Market by Application
11.2.7 Mexico
11.2.7.1 Mexico Precision Farming Market by Offering
11.2.7.2 Mexico Precision Farming Market by Technology
11.2.7.3 Mexico Precision Farming Market by Application
11.3 Europe
11.3.1 Eastern Europe
11.3.1.1 Eastern Europe Precision Farming Market by Country
11.3.1.2 Eastern Europe Precision Farming Market by Offering
11.3.1.3 Eastern Europe Precision Farming Market by Technology
11.3.1.4 Eastern Europe Precision Farming Market by Application
11.3.1.5 Poland
11.3.1.5.1 Poland Precision Farming Market by Offering
11.3.1.5.2 Poland Precision Farming Market by Technology
11.3.1.5.3 Poland Precision Farming Market by Application
11.3.1.6 Romania
11.3.1.6.1 Romania Precision Farming Market by Offering
11.3.1.6.2 Romania Precision Farming Market by Technology
11.3.1.6.4 Romania Precision Farming Market by Application
11.3.1.7 Turkey
11.3.1.7.1 Turkey Precision Farming Market by Offering
11.3.1.7.2 Turkey Precision Farming Market by Technology
11.3.1.7.3 Turkey Precision Farming Market by Application
11.3.1.8 Rest of Eastern Europe
11.3.1.8.1 Rest of Eastern Europe Precision Farming Market by Offering
11.3.1.8.2 Rest of Eastern Europe Precision Farming Market by Technology
11.3.1.8.3 Rest of Eastern Europe Precision Farming Market by Application
11.3.2 Western Europe
11.3.2.1 Western Europe Precision Farming Market by Offering
11.3.2.2 Western Europe Precision Farming Market by Technology
11.3.2.3 Western Europe Precision Farming Market by Application
11.3.2.4 Germany
11.3.2.4.1 Germany Precision Farming Market by Offering
11.3.2.4.2 Germany Precision Farming Market by Technology
11.3.2.4.3 Germany Precision Farming Market by Application
11.3.2.5 France
11.3.2.5.1 France Precision Farming Market by Offering
11.3.2.5.2 France Precision Farming Market by Technology
11.3.2.5.3 France Precision Farming Market by Application
11.3.2.6 UK
11.3.2.6.1 UK Precision Farming Market by Offering
11.3.2.6.2 UK Precision Farming Market by Technology
11.3.2.6.3 UK Precision Farming Market by Application
11.3.2.7 Italy
11.3.2.7.1 Italy Precision Farming Market by Offering
11.3.2.7.2 Italy Precision Farming Market by Technology
11.3.2.7.3 Italy Precision Farming Market by Application
11.3.2.8 Spain
11.3.2.8.1 Spain Precision Farming Market by Offering
11.3.2.8.2 Spain Precision Farming Market by Technology
11.3.2.8.3 Spain Precision Farming Market by Application
11.3.2.9 Netherlands
11.3.2.9.1 Netherlands Precision Farming Market by Offering
11.3.2.9.2 Netherlands Precision Farming Market by Technology
11.3.2.9.3 Netherlands Precision Farming Market by Application
11.3.2.10 Switzerland
11.3.2.10.1 Switzerland Precision Farming Market by Offering
11.3.2.10.2 Switzerland Precision Farming Market by Technology
11.3.2.10.3 Switzerland Precision Farming Market by Application
11.3.2.11.1 Austria
11.3.2.11.2 Austria Precision Farming Market by Offering
11.3.2.11.3 Austria Precision Farming Market by Technology
11.3.2.11.4 Austria Precision Farming Market by Application
11.3.2.12 Rest of Western Europe
11.3.2.12.1 Rest of Western Europe Precision Farming Market by Offering
11.3.2.12.2 Rest of Western Europe Precision Farming Market by Technology
11.3.2.12.3 Rest of Western Europe Precision Farming Market by Application
11.4 Asia-Pacific
11.4.1 Asia-Pacific Precision Farming Market by Country
11.4.2 Asia-Pacific Precision Farming Market by Offering
11.4.3 Asia-Pacific Precision Farming Market by Technology
11.4.4 Asia-Pacific Precision Farming Market by Application
11.4.5 China
11.4.5.1 China Precision Farming Market by Offering
11.4.5.2 China Precision Farming Market by Application
11.4.5.3 China Precision Farming Market by Technology
11.4.6 India
11.4.6.1 India Precision Farming Market by Offering
11.4.6.2 India Precision Farming Market by Technology
11.4.6.3 India Precision Farming Market by Application
11.4.7 Japan
11.4.7.1 Japan Precision Farming Market by Offering
11.4.7.2 Japan Precision Farming Market by Technology
11.4.7.3 Japan Precision Farming Market by Application
11.4.8 South Korea
11.4.8.1 South Korea Precision Farming Market by Offering
11.4.8.2 South Korea Precision Farming Market by Technology
11.4.8.3 South Korea Precision Farming Market by Application
11.4.9 Vietnam
11.4.9.1 Vietnam Precision Farming Market by Offering
11.4.9.2 Vietnam Precision Farming Market by Technology
11.4.9.3 Vietnam Precision Farming Market by Application
11.4.10 Singapore
11.4.10.1 Singapore Precision Farming Market by Offering
11.4.10.2 Singapore Precision Farming Market by Technology
11.4.10.3 Singapore Precision Farming Market by Application
11.4.11 Australia
11.4.11.1 Australia Precision Farming Market by Offering
11.4.11.2 Australia Precision Farming Market by Technology
11.4.11.3 Australia Precision Farming Market by Application
11.4.12 Rest of Asia-Pacific
11.4.12.1 Rest of Asia-Pacific Precision Farming Market by Offering
11.4.12.2 Rest of Asia-Pacific Precision Farming Market by Technology
11.4.12.3 Rest of Asia-Pacific Precision Farming Market by Application
11.5 Middle East & Africa
11.5.1 Middle East
11.5.1.1 Middle East Precision Farming Market by Country
11.5.1.2 Middle East Precision Farming Market by Offering
11.5.1.3 Middle East Precision Farming Market by Technology
11.5.1.4 Middle East Precision Farming Market by Application
11.5.1.5 UAE
11.5.1.5.1 UAE Precision Farming Market by Offering
11.5.1.5.2 UAE Precision Farming Market by Technology
11.5.1.5.3 UAE Precision Farming Market by Application
11.5.1.6 Egypt
11.5.1.6.1 Egypt Precision Farming Market by Offering
11.5.1.6.2 Egypt Precision Farming Market by Technology
11.5.1.6.3 Egypt Precision Farming Market by Application
11.5.1.7 Saudi Arabia
11.5.1.7.1 Saudi Arabia Precision Farming Market by Offering
11.5.1.7.2 Saudi Arabia Precision Farming Market by Technology
11.5.1.7.3 Saudi Arabia Precision Farming Market by Application
11.5.1.8 Qatar
11.5.1.8.1 Qatar Precision Farming Market by Offering
11.5.1.8.2 Qatar Precision Farming Market by Technology
11.5.1.8.3 Qatar Precision Farming Market by Application
11.5.1.9 Rest of Middle East
11.5.1.9.1 Rest of Middle East Precision Farming Market by Offering
11.5.1.9.2 Rest of Middle East Precision Farming Market by Technology
11.5.1.9.3 Rest of Middle East Precision Farming Market by Application
11.5.2 Africa
11.5.2.1 Africa Transfusion Diagnostics Market by Country
11.5.2.2 Africa Precision Farming Market by Offering
11.5.2.3 Africa Precision Farming Market by Technology
11.5.2.4 Africa Precision Farming Market by Application
11.5.2.5 Nigeria
11.5.2.5.1 Nigeria Precision Farming Market by Offering
11.5.2.5.2 Nigeria Precision Farming Market by Technology
11.5.2.5.3 Nigeria Precision Farming Market by Application
11.5.2.6 South Africa
11.5.2.6.1 South Africa Precision Farming Market by Offering
11.5.2.6.2 South Africa Precision Farming Market by Technology
11.5.2.6.3 South Africa Precision Farming Market by Application
11.5.2.7 Rest of Africa
11.5.2.7.1 Rest of Africa Precision Farming Market by Offering
11.5.2.7.2 Rest of Africa Precision Farming Market by Technology
11.5.2.7.3 Rest of Africa Precision Farming Market by Application
11.6 Latin America
11.6.1 Latin America Precision Farming Market by Country
11.6.2 Latin America Precision Farming Market by Offering
11.6.3 Latin America Precision Farming Market by Technology
11.6.4 Latin America Precision Farming Market by Application
11.6.5 Brazil
11.6.5.1 Brazil America Precision Farming Market by Offering
11.6.5.2 Brazil America Precision Farming Market by Technology
11.6.5.3 Brazil America Precision Farming Market by Application
11.6.6 Argentina
11.6.6.1 Argentina America Precision Farming Market by Offering
11.6.6.2 Argentina America Precision Farming Market by Technology
11.6.6.3 Argentina America Precision Farming Market by Application
11.6.7 Colombia
11.6.7.1 Colombia America Precision Farming Market by Offering
11.6.7.2 Colombia America Precision Farming Market by Technology
11.6.7.3 Colombia America Precision Farming Market by Application
11.6.8 Rest of Latin America
11.6.8.1 Rest of Latin America Precision Farming Market by Offering
11.6.8.2 Rest of Latin America Precision Farming Market by Technology
11.6.8.3 Rest of Latin America Precision Farming Market by Application
12. Company profile
12.1 Ag Leader Technology
12.1.1 Company Overview
12.1.2 Financial
12.1.3 Products/ Services Offered
12.1.4 SWOT Analysis
12.1.5 The SNS View
12.2 AgJunetion, Inc.
12.2.1 Company Overview
12.2.2 Financials
12.2.3 Product/Services Offered
12.2.4 SWOT Analysis
12.2.5 The SNS View
12.3 CropMetrics LLC
12.3.1 Company Overview
12.3.2 Financials
12.3.3 Product/Services Offered
12.3.4 SWOT Analysis
12.3.5 The SNS View
12.4 Trimble, Inc.
12.4.1 Company Overview
12.4.2 Financials
12.4.3 Product/Services Offered
12.4.4 SWOT Analysis
12.4.5 The SNS View
12.5 AGCO Corporation
12.5.1 Company Overview
12.5.2 Financials
12.5.3 Product/Services Offered
12.5.4 SWOT Analysis
12.5.5 The SNS View
12.6 Raven Industries Inc.
12.6.1 Company Overview
12.6.2 Financials
12.6.3 Product/Services Offered
12.6.4 SWOT Analysis
12.6.5 The SNS View
12.7 Deere and Company
12.7.1 Company Overview
12.7.2 Financials
12.7.3 Product/Services Offered
12.7.4 SWOT Analysis
12.7.5 The SNS View
12.8 Topcon Corporation
12.8.1 Company Overview
12.8.2 Financials
12.8.3 Product/Services Offered
12.8.4 SWOT Analysis
12.8.5 The SNS View
12.9 AgEagle Aerial Systems Inc.
12.9.1 Company Overview
12.9.2 Financials
12.9.3 Product/Services Offered
12.9.4 SWOT Analysis
12.9.5 The SNS View
12.10 Farmers Edge Inc.
12.10.1 Company Overview
12.10.2 Financials
12.10.3 Product/Services Offered
12.10.4 SWOT Analysis
12.10.5 The SNS View
12.11 The Climate Corporation
12.11.1 Company Overview
12.11.2 Financials
12.11.3 Product/Services Offered
12.11.4 SWOT Analysis
12.11.5 The SNS View
13. Competitive Landscape
13.1 Competitive Bench marking
13.2 Market Share Analysis
13.3 Recent Developments
13.3.1 Industry News
13.3.2 Company News
13.3.3 Mergers & Acquisitions
14. Use Case and Best Practices
15. Conclusion
An accurate research report requires proper strategizing as well as implementation. There are multiple factors involved in the completion of good and accurate research report and selecting the best methodology to compete the research is the toughest part. Since the research reports we provide play a crucial role in any company’s decision-making process, therefore we at SNS Insider always believe that we should choose the best method which gives us results closer to reality. This allows us to reach at a stage wherein we can provide our clients best and accurate investment to output ratio.
Each report that we prepare takes a timeframe of 350-400 business hours for production. Starting from the selection of titles through a couple of in-depth brain storming session to the final QC process before uploading our titles on our website we dedicate around 350 working hours. The titles are selected based on their current market cap and the foreseen CAGR and growth.
The 5 steps process:
Step 1: Secondary Research:
Secondary Research or Desk Research is as the name suggests is a research process wherein, we collect data through the readily available information. In this process we use various paid and unpaid databases which our team has access to and gather data through the same. This includes examining of listed companies’ annual reports, Journals, SEC filling etc. Apart from this our team has access to various associations across the globe across different industries. Lastly, we have exchange relationships with various university as well as individual libraries.
Step 2: Primary Research
When we talk about primary research, it is a type of study in which the researchers collect relevant data samples directly, rather than relying on previously collected data. This type of research is focused on gaining content specific facts that can be sued to solve specific problems. Since the collected data is fresh and first hand therefore it makes the study more accurate and genuine.
We at SNS Insider have divided Primary Research into 2 parts.
Part 1 wherein we interview the KOLs of major players as well as the upcoming ones across various geographic regions. This allows us to have their view over the market scenario and acts as an important tool to come closer to the accurate market numbers. As many as 45 paid and unpaid primary interviews are taken from both the demand and supply side of the industry to make sure we land at an accurate judgement and analysis of the market.
This step involves the triangulation of data wherein our team analyses the interview transcripts, online survey responses and observation of on filed participants. The below mentioned chart should give a better understanding of the part 1 of the primary interview.
Part 2: In this part of primary research the data collected via secondary research and the part 1 of the primary research is validated with the interviews from individual consultants and subject matter experts.
Consultants are those set of people who have at least 12 years of experience and expertise within the industry whereas Subject Matter Experts are those with at least 15 years of experience behind their back within the same space. The data with the help of two main processes i.e., FGDs (Focused Group Discussions) and IDs (Individual Discussions). This gives us a 3rd party nonbiased primary view of the market scenario making it a more dependable one while collation of the data pointers.
Step 3: Data Bank Validation
Once all the information is collected via primary and secondary sources, we run that information for data validation. At our intelligence centre our research heads track a lot of information related to the market which includes the quarterly reports, the daily stock prices, and other relevant information. Our data bank server gets updated every fortnight and that is how the information which we collected using our primary and secondary information is revalidated in real time.
Step 4: QA/QC Process
After all the data collection and validation our team does a final level of quality check and quality assurance to get rid of any unwanted or undesired mistakes. This might include but not limited to getting rid of the any typos, duplication of numbers or missing of any important information. The people involved in this process include technical content writers, research heads and graphics people. Once this process is completed the title gets uploader on our platform for our clients to read it.
Step 5: Final QC/QA Process:
This is the last process and comes when the client has ordered the study. In this process a final QA/QC is done before the study is emailed to the client. Since we believe in giving our clients a good experience of our research studies, therefore, to make sure that we do not lack at our end in any way humanly possible we do a final round of quality check and then dispatch the study to the client.
The Lithium Titanate Oxide (LTO) Battery Market size was USD 4.46 billion in 2023 and is estimated to Reach USD 11.35 billion by 2032 and grow at a CAGR of 10.98% over the forecast period of 2024-2032.
The Multilayer Ceramic Capacitor Market Size was valued at USD 13.17 Billion in 2023 and is expected to grow at a CAGR of 5.72% During 2024-2032.
The Embedded Systems Market Size was valued at USD 103.79 billion in 2023 and is expected to reach USD 178.30 billion by 2032 and grow at a CAGR of 6.20% over the forecast period 2024-2032.
The Silicon-on-Insulator (SOI) Market Size was valued at USD 1.54 Billion in 2023 and expected to grow at 13.71% CAGR to reach USD 4.89 Billion by 2032.
The SiC Wafer Polishing Market size was valued at USD 0.46 Billion in 2023 and is expected to grow to USD 8.27 Billion by 2032 and grow at a CAGR of 37.86% over the forecast period of 2024-2032.
The Narrowband IoT (NB IoT) Chipset Market Size was valued at USD 4.50 billion in 2023 and is expected to reach USD 52.37 billion by 2032 and grow at a CAGR of 31.35% over the forecast period 2024-2032.
Hi! Click one of our member below to chat on Phone