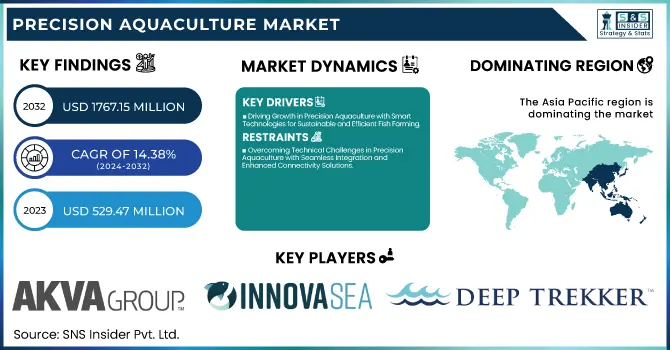
The Precision Aquaculture Market Size was valued at USD 529.47 million in 2023 and is expected to reach USD 1767.15 million by 2032, growing at a CAGR of 14.38% over the forecast period 2024-2032. The precision aquaculture market is in a rapid evolution phase in terms of adoption & technology, with the use of modern technology including IoT, AI, and data analytics to make fish farming operations more efficient and cost-effective. More operational & performance capabilities with automated feeding systems, monitoring, and predictive maintenance.
To Get more information on Precision Aquaculture Market - Request Free Sample Report
Smart sensors and imaging tools used to predict fish behavior contribute to fish health & welfare by enabling the best conditions and lowest disease outbreaks. Additionally, system performance improvements focus on reliable hardware-software integration and reliable communication solutions for aquaculture operations by ensuring the collection and analysis of data to support integrated-detection-based decision-making.
Key Drivers:
Driving Growth in Precision Aquaculture with Smart Technologies for Sustainable and Efficient Fish Farming
There are several drivers in the precision aquaculture market, as efficiencies and sustainability in fish farming are becoming increasingly important. Growing Trend of Smart Fish Farming Using IoT Sensors, AI Data Analytics & Automated Feeding Systems It also helps to monitor the water quality, overall fish health, and feeding patterns in real-time, helping ease waste and produce better. Also, the increasing need for sustainable seafood production is steering farmers towards precision solutions to minimize environmental damage. Increasing investment in aquaculture infrastructure, along with government support towards smart farming techniques, further enhances the market growth. Additionally, awareness of the economic advantage precision systems provide like minimized feed expenses and increased yield is fueling the market expansion.
Restrain:
Overcoming Technical Challenges in Precision Aquaculture with Seamless Integration and Enhanced Connectivity Solutions
The precision aquaculture market has been experiencing some pressing challenges due to technical complications and integration complications. Utilization of advanced systems including IoT sensors, AI-powered monitoring tools, and automated feeding systems needs technical knowledge and technical proficiency. Aquaculture farmers, particularly in small-scale farms, will have difficulty in the calibration of systems, data interpretation, and troubleshooting. Moreover, real-time data transmission can be limited in monitoring and control systems due to remote or offshore aquaculture sites where connectivity problems exist, making it difficult to achieve an effective monitoring and control process. Another challenge that persists is that of integrating different hardware and software solutions across various farming environments into a seamless solution.
Opportunity:
AI-Driven Solutions and Data Analytics Unlock Growth Opportunities in Precision Aquaculture Technologies
There is a huge scope for an AI-enabled monitoring platform and a data-driven decision-making tool in the market. This includes feed prediction analytics for disease detection and automated adjustments in feeding those types of systems would be more widely adopted. As offshore aquaculture expands and recirculating aquaculture systems (RAS) become more popular, precision aquaculture technologies will continue to find new opportunities. Further, the heightened weather handling on use sustainability presents prospects for eco-friendly innovations made to maximize efficiency. Firms that are implementing cloud-based platforms, machine learning algorithms, and biometric monitoring tools stand to benefit from a better competitive position in the face of a changing market.
Challenges:
Enhancing Data Security and System Interoperability for Safe and Scalable Precision Aquaculture Solutions
A connected aquaculture system has all the same data security and privacy risks that you would have in any other connected environment, which is another significant hurdle. Modern farms are becoming more vulnerable to threats from cybercrime, and area and technical system malfunctions as more farms adopt cloud-based platforms and remote monitoring solutions. The mitigation of risk to sensitive data feeding schedules, environmental conditions, and operational insights is paramount to maintaining business continuity. Furthermore, the absence of uniform guidelines regarding data sharing and system interoperability can limit the scalability of precision aquaculture technology. Solutions will involve better cybersecurity approaches, greater operator technical training, and greater consensus on standards to provide for the interoperability of systems.
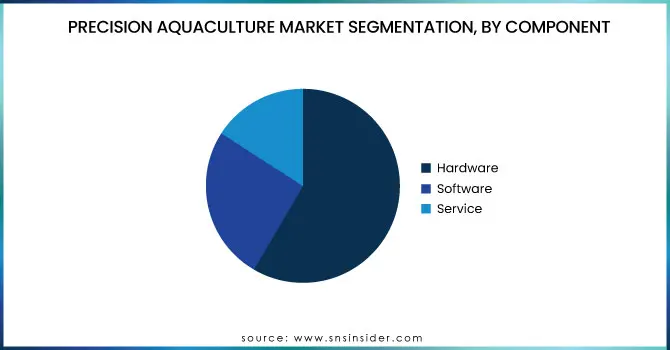
By Component
The hardware segment dominated the overall precision aquaculture market, with a maximum share of 58.4% in 2023. The rapid adoption of devices, such as smart feeding systems, sensors, cameras, and other monitoring equipment, which are essential for maintaining optimal health and farm productivity for their fish, spurred this dominance. Incorporating appropriate hardware technologies is still necessary to gather real-time data on water quality, temperature, and fish behavior.
The software segment will grow at the highest from 2024 to 2032 These growth drivers include increasing demand for AI-based analytic platforms, cloud-based data management, and predictive modeling tools that provide timely and resource-optimized decision-making power. The growing number of benefits that come along with data-driven insights is leading aquaculture operators to drive technologies like advanced software solutions for better management.
By System
In 2023, the precision aquaculture market was dominated by Smart Feeding Systems, which held 46.6% of the total market. The large share can be credited to the high adoption rate of automated feeding solutions which not only distribute the feeds evenly but also reduce the feed wastage and make the growth of the fish very effective. Sensors and artificial intelligence are used in smart feeding systems to feed determined amounts of feed (based on fish behavior and external conditions) while ensuring higher efficiency and cost-savings.
The Monitoring and Control Systems segment is anticipated to grow at the fastest CAGR from 2024-2032. The increasing demand for real-time water quality monitoring, automated environmental control, and data-driven farm management is driving this growth. The capabilities offered by the development of IoT-powered sensors, intelligence (AI) analytics, and remote monitoring platforms are driving the adoption of systems that provide aquaculture operators with not only decision support but also precision aquaculture.
By Application
Feed Optimization held the largest share of the precision aquaculture market in 2023, accounting for 52.6% of the total market. The need for automated feeding solutions that help increase fish growth, minimize feed wastage, and improve total farm efficacy was chiefly responsible for this dominance. Using powerful sensors and artificial intelligence (AI) algorithms, feed optimization systems enable accurate feeding schedules and management, allowing aquaculture operators to achieve better resource use and cost savings.
The Monitoring & Surveillance segment is expected to grow at the fastest CAGR during 2024-2032. Increasing demand for real-time monitoring of water quality, fish behavior, and environmental management is contributing to this growth. In aquaculture, it is progressively turning to direct IoT empower gadgets, submerged cameras, and AI-empower investigation to validate the presence of the ranch, keep up the perfect condition, and avoid dangers.
The precision aquaculture market in the Asia Pacific region held the highest share of 34.5% in 2023. The reason for this dominance is comprehensive aquaculture in the region (China, India, Vietnam, and Indonesia). They have been focusing on advanced feeding systems, water quality monitoring, and automated farm management systems for their seas to optimize seafood production for several decades. A good example is the fishery in Indonesia, which has recently made a huge success By Component smart feeding that can increase feed efficiency and fish growth. Likewise, in China, IoT sensors and AI-based monitoring platforms are being implemented on large-scale aquaculture farms for sustainable seafood production to meet the growing need for protein-rich diets.
From 2024 to 2032, Europe will grow the fastest with a CAGR, thanks to rising investments in sustainable aquaculture practices, along with superior monitoring solutions. Norway, Scotland, and Denmark, for example, are harnessing new technologies to improve fish welfare and environmental management. Consider Bluegrove in Norway, which has developed AI-assisted monitoring tools that follow fish behavior, feeding habits, and environmental conditions for ideal conditions at farms. Furthermore, European regulations encouraging environmentally sustainable aquaculture management practices continue to drive precision aquaculture technology adoption in this region.
Get Customized Report as per Your Business Requirement - Enquiry Now
Some of the major players in the Precision Aquaculture Market are:
AKVA group (Polarcirkel Cages)
InnovaSea Systems (AquaMesh Monitoring System)
Steinsvik (ScaleAQ) (iFarm Fish Welfare System)
Deep Trekker (DTG3 Underwater Drone)
Aquabyte (Fish Health Monitoring Platform)
Eruvaka Technologies (Smart Feeder)
Akuakare (Smart Feeding Technology)
CPI Equipment (Aquaculture Feed Systems)
Lifegard Aquatics (Water Quality Test Kits)
Bluegrove (Sensory Monitoring Solutions)
Imenco AS (Subsea Camera Systems)
In-situ (Aqua TROLL Water Quality Sensors)
Signify (Aquaculture LED Lighting)
Jala Tech (Water Quality Monitoring Device)
Planet Lighting (Submersible LED Lights)
In January 2025, AKVA Group unveiled its next-generation air dome for the Nautilus concept, enhancing deep-sea farming efficiency by improving oxygen supply and fish welfare.
| Report Attributes | Details |
|---|---|
| Market Size in 2023 | USD 529.47 Million |
| Market Size by 2032 | USD 1767.15 Million |
| CAGR | CAGR of 14.38% From 2024 to 2032 |
| Base Year | 2023 |
| Forecast Period | 2024-2032 |
| Historical Data | 2020-2022 |
| Report Scope & Coverage | Market Size, Segments Analysis, Competitive Landscape, Regional Analysis, DROC & SWOT Analysis, Forecast Outlook |
| Key Segments | • By Component (Hardware, Software, Service) • By System (Smart Feeding Systems, Monitoring and Control Systems, Underwater ROV Systems) • By Application (Feed Optimization, Monitoring & Surveillance, Yield Analysis) |
| Regional Analysis/Coverage | North America (US, Canada, Mexico), Europe (Eastern Europe [Poland, Romania, Hungary, Turkey, Rest of Eastern Europe] Western Europe] Germany, France, UK, Italy, Spain, Netherlands, Switzerland, Austria, Rest of Western Europe]), Asia Pacific (China, India, Japan, South Korea, Vietnam, Singapore, Australia, Rest of Asia Pacific), Middle East & Africa (Middle East [UAE, Egypt, Saudi Arabia, Qatar, Rest of Middle East], Africa [Nigeria, South Africa, Rest of Africa], Latin America (Brazil, Argentina, Colombia, Rest of Latin America) |
| Company Profiles | AKVA group, InnovaSea Systems, Steinsvik (ScaleAQ), Deep Trekker, Aquabyte, Eruvaka Technologies, Akuakare, CPI Equipment, Lifegard Aquatics, Bluegrove, Imenco AS, In-Situ, Signify, Jala Tech, Planet Lighting. |
Ans: The Precision Aquaculture Market is expected to grow at a CAGR of 14.38% during 2024-2032.
Ans: Precision Aquaculture Market size was USD 529.47 million in 2023 and is expected to Reach USD 1767.15 million by 2032.
Ans: The major growth factor of the Precision Aquaculture Market is the increasing adoption of IoT-enabled sensors, AI-driven monitoring systems, and automated feeding solutions to enhance fish health, optimize resource utilization, and improve farm productivity.
Ans: The Hardware segment dominated the Precision Aquaculture Market in 2023.
Ans: Asia Pacific dominated the Precision Aquaculture Market in 2023.
1. Introduction
1.1 Market Definition
1.2 Scope (Inclusion and Exclusions)
1.3 Research Assumptions
2. Executive Summary
2.1 Market Overview
2.2 Regional Synopsis
2.3 Competitive Summary
3. Research Methodology
3.1 Top-Down Approach
3.2 Bottom-up Approach
3.3. Data Validation
3.4 Primary Interviews
4. Market Dynamics Impact Analysis
4.1 Market Driving Factors Analysis
4.1.1 Drivers
4.1.2 Restraints
4.1.3 Opportunities
4.1.4 Challenges
4.2 PESTLE Analysis
4.3 Porter’s Five Forces Model
5. Statistical Insights and Trends Reporting
5.1 Adoption & Technology
5.2 Operational & Performance
5.3 Fish Health & Welfare
5.4 System Performance
6. Competitive Landscape
6.1 List of Major Companies, By Region
6.2 Market Share Analysis, By Region
6.3 Product Benchmarking
6.3.1 Product specifications and features
6.3.2 Pricing
6.4 Strategic Initiatives
6.4.1 Marketing and Promotional Activities
6.4.2 Distribution and Supply Chain Strategies
6.4.3 Expansion plans and new product launches
6.4.4 Strategic partnerships and collaborations
6.5 Technological Advancements
6.6 Market Positioning and Branding
7. Precision Aquaculture Market Segmentation, By Component
7.1 Chapter Overview
7.2 Hardware
7.2.1 Hardware Market Trends Analysis (2020-2032)
7.2.2 Hardware Market Size Estimates and Forecasts to 2032 (USD Million)
7.3 Software
7.3.1 Software Market Trends Analysis (2020-2032)
7.3.2 Software Market Size Estimates and Forecasts to 2032 (USD Million)
7.4 Service
7.4.1 Service Market Trends Analysis (2020-2032)
7.4.2 Service Market Size Estimates and Forecasts to 2032 (USD Million)
8. Precision Aquaculture Market Segmentation, By System
8.1 Chapter Overview
8.2 Smart Feeding Systems
8.2.1 Smart Feeding Systems Market Trends Analysis (2020-2032)
8.2.2 Smart Feeding Systems Market Size Estimates and Forecasts to 2032 (USD Million)
8.3 Monitoring and Control Systems
8.3.1 Monitoring and Control Systems Market Trends Analysis (2020-2032)
8.3.2 Monitoring and Control Systems Market Size Estimates and Forecasts to 2032 (USD Million)
8.4 Underwater ROV Systems
8.4.1 Underwater ROV Systems Market Trends Analysis (2020-2032)
8.4.2 Underwater ROV Systems Market Size Estimates and Forecasts to 2032 (USD Million)
9. Precision Aquaculture Market Segmentation, By Application
9.1 Chapter Overview
9.2 Feed Optimization
9.2.1 Feed Optimization Market Trends Analysis (2020-2032)
9.2.2 Feed Optimization Market Size Estimates and Forecasts to 2032 (USD Million)
9.3 Monitoring & Surveillance
9.3.1 Monitoring & Surveillance Market Trends Analysis (2020-2032)
9.3.2 Monitoring & Surveillance Market Size Estimates and Forecasts to 2032 (USD Million)
9.4 Yield Analysis
9.4.1 Yield Analysis Market Trends Analysis (2020-2032)
9.4.2 Yield Analysis Market Size Estimates and Forecasts to 2032 (USD Million)
10. Regional Analysis
10.1 Chapter Overview
10.2 North America
10.2.1 Trends Analysis
10.2.2 North America Precision Aquaculture Market Estimates and Forecasts, by Country (2020-2032) (USD Million)
10.2.3 North America Precision Aquaculture Market Estimates and Forecasts, By Component (2020-2032) (USD Million)
10.2.4 North America Precision Aquaculture Market Estimates and Forecasts, By System (2020-2032) (USD Million)
10.2.5 North America Precision Aquaculture Market Estimates and Forecasts, By Application (2020-2032) (USD Million)
10.2.6 USA
10.2.6.1 USA Precision Aquaculture Market Estimates and Forecasts, By Component (2020-2032) (USD Million)
10.2.6.2 USA Precision Aquaculture Market Estimates and Forecasts, By System (2020-2032) (USD Million)
10.2.6.3 USA Precision Aquaculture Market Estimates and Forecasts, By Application (2020-2032) (USD Million)
10.2.7 Canada
10.2.7.1 Canada Precision Aquaculture Market Estimates and Forecasts, By Component (2020-2032) (USD Million)
10.2.7.2 Canada Precision Aquaculture Market Estimates and Forecasts, By System (2020-2032) (USD Million)
10.2.7.3 Canada Precision Aquaculture Market Estimates and Forecasts, By Application (2020-2032) (USD Million)
10.2.8 Mexico
10.2.8.1 Mexico Precision Aquaculture Market Estimates and Forecasts, By Component (2020-2032) (USD Million)
10.2.8.2 Mexico Precision Aquaculture Market Estimates and Forecasts, By System (2020-2032) (USD Million)
10.2.8.3 Mexico Precision Aquaculture Market Estimates and Forecasts, By Application (2020-2032) (USD Million)
10.3 Europe
10.3.1 Eastern Europe
10.3.1.1 Trends Analysis
10.3.1.2 Eastern Europe Precision Aquaculture Market Estimates and Forecasts, by Country (2020-2032) (USD Million)
10.3.1.3 Eastern Europe Precision Aquaculture Market Estimates and Forecasts, By Component (2020-2032) (USD Million)
10.3.1.4 Eastern Europe Precision Aquaculture Market Estimates and Forecasts, By System (2020-2032) (USD Million)
10.3.1.5 Eastern Europe Precision Aquaculture Market Estimates and Forecasts, By Application (2020-2032) (USD Million)
10.3.1.6 Poland
10.3.1.6.1 Poland Precision Aquaculture Market Estimates and Forecasts, By Component (2020-2032) (USD Million)
10.3.1.6.2 Poland Precision Aquaculture Market Estimates and Forecasts, By System (2020-2032) (USD Million)
10.3.1.6.3 Poland Precision Aquaculture Market Estimates and Forecasts, By Application (2020-2032) (USD Million)
10.3.1.7 Romania
10.3.1.7.1 Romania Precision Aquaculture Market Estimates and Forecasts, By Component (2020-2032) (USD Million)
10.3.1.7.2 Romania Precision Aquaculture Market Estimates and Forecasts, By System (2020-2032) (USD Million)
10.3.1.7.3 Romania Precision Aquaculture Market Estimates and Forecasts, By Application (2020-2032) (USD Million)
10.3.1.8 Hungary
10.3.1.8.1 Hungary Precision Aquaculture Market Estimates and Forecasts, By Component (2020-2032) (USD Million)
10.3.1.8.2 Hungary Precision Aquaculture Market Estimates and Forecasts, By System (2020-2032) (USD Million)
10.3.1.8.3 Hungary Precision Aquaculture Market Estimates and Forecasts, By Application (2020-2032) (USD Million)
10.3.1.9 Turkey
10.3.1.9.1 Turkey Precision Aquaculture Market Estimates and Forecasts, By Component (2020-2032) (USD Million)
10.3.1.9.2 Turkey Precision Aquaculture Market Estimates and Forecasts, By System (2020-2032) (USD Million)
10.3.1.9.3 Turkey Precision Aquaculture Market Estimates and Forecasts, By Application (2020-2032) (USD Million)
10.3.1.10 Rest of Eastern Europe
10.3.1.10.1 Rest of Eastern Europe Precision Aquaculture Market Estimates and Forecasts, By Component (2020-2032) (USD Million)
10.3.1.10.2 Rest of Eastern Europe Precision Aquaculture Market Estimates and Forecasts, By System (2020-2032) (USD Million)
10.3.1.10.3 Rest of Eastern Europe Precision Aquaculture Market Estimates and Forecasts, By Application (2020-2032) (USD Million)
10.3.2 Western Europe
10.3.2.1 Trends Analysis
10.3.2.2 Western Europe Precision Aquaculture Market Estimates and Forecasts, by Country (2020-2032) (USD Million)
10.3.2.3 Western Europe Precision Aquaculture Market Estimates and Forecasts, By Component (2020-2032) (USD Million)
10.3.2.4 Western Europe Precision Aquaculture Market Estimates and Forecasts, By System (2020-2032) (USD Million)
10.3.2.5 Western Europe Precision Aquaculture Market Estimates and Forecasts, By Application (2020-2032) (USD Million)
10.3.2.6 Germany
10.3.2.6.1 Germany Precision Aquaculture Market Estimates and Forecasts, By Component (2020-2032) (USD Million)
10.3.2.6.2 Germany Precision Aquaculture Market Estimates and Forecasts, By System (2020-2032) (USD Million)
10.3.2.6.3 Germany Precision Aquaculture Market Estimates and Forecasts, By Application (2020-2032) (USD Million)
10.3.2.7 France
10.3.2.7.1 France Precision Aquaculture Market Estimates and Forecasts, By Component (2020-2032) (USD Million)
10.3.2.7.2 France Precision Aquaculture Market Estimates and Forecasts, By System (2020-2032) (USD Million)
10.3.2.7.3 France Precision Aquaculture Market Estimates and Forecasts, By Application (2020-2032) (USD Million)
10.3.2.8 UK
10.3.2.8.1 UK Precision Aquaculture Market Estimates and Forecasts, By Component (2020-2032) (USD Million)
10.3.2.8.2 UK Precision Aquaculture Market Estimates and Forecasts, By System (2020-2032) (USD Million)
10.3.2.8.3 UK Precision Aquaculture Market Estimates and Forecasts, By Application (2020-2032) (USD Million)
10.3.2.9 Italy
10.3.2.9.1 Italy Precision Aquaculture Market Estimates and Forecasts, By Component (2020-2032) (USD Million)
10.3.2.9.2 Italy Precision Aquaculture Market Estimates and Forecasts, By System (2020-2032) (USD Million)
10.3.2.9.3 Italy Precision Aquaculture Market Estimates and Forecasts, By Application (2020-2032) (USD Million)
10.3.2.10 Spain
10.3.2.10.1 Spain Precision Aquaculture Market Estimates and Forecasts, By Component (2020-2032) (USD Million)
10.3.2.10.2 Spain Precision Aquaculture Market Estimates and Forecasts, By System (2020-2032) (USD Million)
10.3.2.10.3 Spain Precision Aquaculture Market Estimates and Forecasts, By Application (2020-2032) (USD Million)
10.3.2.11 Netherlands
10.3.2.11.1 Netherlands Precision Aquaculture Market Estimates and Forecasts, By Component (2020-2032) (USD Million)
10.3.2.11.2 Netherlands Precision Aquaculture Market Estimates and Forecasts, By System (2020-2032) (USD Million)
10.3.2.11.3 Netherlands Precision Aquaculture Market Estimates and Forecasts, By Application (2020-2032) (USD Million)
10.3.2.12 Switzerland
10.3.2.12.1 Switzerland Precision Aquaculture Market Estimates and Forecasts, By Component (2020-2032) (USD Million)
10.3.2.12.2 Switzerland Precision Aquaculture Market Estimates and Forecasts, By System (2020-2032) (USD Million)
10.3.2.12.3 Switzerland Precision Aquaculture Market Estimates and Forecasts, By Application (2020-2032) (USD Million)
10.3.2.13 Austria
10.3.2.13.1 Austria Precision Aquaculture Market Estimates and Forecasts, By Component (2020-2032) (USD Million)
10.3.2.13.2 Austria Precision Aquaculture Market Estimates and Forecasts, By System (2020-2032) (USD Million)
10.3.2.13.3 Austria Precision Aquaculture Market Estimates and Forecasts, By Application (2020-2032) (USD Million)
10.3.2.14 Rest of Western Europe
10.3.2.14.1 Rest of Western Europe Precision Aquaculture Market Estimates and Forecasts, By Component (2020-2032) (USD Million)
10.3.2.14.2 Rest of Western Europe Precision Aquaculture Market Estimates and Forecasts, By System (2020-2032) (USD Million)
10.3.2.14.3 Rest of Western Europe Precision Aquaculture Market Estimates and Forecasts, By Application (2020-2032) (USD Million)
10.4 Asia Pacific
10.4.1 Trends Analysis
10.4.2 Asia Pacific Precision Aquaculture Market Estimates and Forecasts, by Country (2020-2032) (USD Million)
10.4.3 Asia Pacific Precision Aquaculture Market Estimates and Forecasts, By Component (2020-2032) (USD Million)
10.4.4 Asia Pacific Precision Aquaculture Market Estimates and Forecasts, By System (2020-2032) (USD Million)
10.4.5 Asia Pacific Precision Aquaculture Market Estimates and Forecasts, By Application (2020-2032) (USD Million)
10.4.6 China
10.4.6.1 China Precision Aquaculture Market Estimates and Forecasts, By Component (2020-2032) (USD Million)
10.4.6.2 China Precision Aquaculture Market Estimates and Forecasts, By System (2020-2032) (USD Million)
10.4.6.3 China Precision Aquaculture Market Estimates and Forecasts, By Application (2020-2032) (USD Million)
10.4.7 India
10.4.7.1 India Precision Aquaculture Market Estimates and Forecasts, By Component (2020-2032) (USD Million)
10.4.7.2 India Precision Aquaculture Market Estimates and Forecasts, By System (2020-2032) (USD Million)
10.4.7.3 India Precision Aquaculture Market Estimates and Forecasts, By Application (2020-2032) (USD Million)
10.4.8 Japan
10.4.8.1 Japan Precision Aquaculture Market Estimates and Forecasts, By Component (2020-2032) (USD Million)
10.4.8.2 Japan Precision Aquaculture Market Estimates and Forecasts, By System (2020-2032) (USD Million)
10.4.8.3 Japan Precision Aquaculture Market Estimates and Forecasts, By Application (2020-2032) (USD Million)
10.4.9 South Korea
10.4.9.1 South Korea Precision Aquaculture Market Estimates and Forecasts, By Component (2020-2032) (USD Million)
10.4.9.2 South Korea Precision Aquaculture Market Estimates and Forecasts, By System (2020-2032) (USD Million)
10.4.9.3 South Korea Precision Aquaculture Market Estimates and Forecasts, By Application (2020-2032) (USD Million)
10.4.10 Vietnam
10.4.10.1 Vietnam Precision Aquaculture Market Estimates and Forecasts, By Component (2020-2032) (USD Million)
10.4.10.2 Vietnam Precision Aquaculture Market Estimates and Forecasts, By System (2020-2032) (USD Million)
10.4.10.3 Vietnam Precision Aquaculture Market Estimates and Forecasts, By Application (2020-2032) (USD Million)
10.4.11 Singapore
10.4.11.1 Singapore Precision Aquaculture Market Estimates and Forecasts, By Component (2020-2032) (USD Million)
10.4.11.2 Singapore Precision Aquaculture Market Estimates and Forecasts, By System (2020-2032) (USD Million)
10.4.11.3 Singapore Precision Aquaculture Market Estimates and Forecasts, By Application (2020-2032) (USD Million)
10.4.12 Australia
10.4.12.1 Australia Precision Aquaculture Market Estimates and Forecasts, By Component (2020-2032) (USD Million)
10.4.12.2 Australia Precision Aquaculture Market Estimates and Forecasts, By System (2020-2032) (USD Million)
10.4.12.3 Australia Precision Aquaculture Market Estimates and Forecasts, By Application (2020-2032) (USD Million)
10.4.13 Rest of Asia Pacific
10.4.13.1 Rest of Asia Pacific Precision Aquaculture Market Estimates and Forecasts, By Component (2020-2032) (USD Million)
10.4.13.2 Rest of Asia Pacific Precision Aquaculture Market Estimates and Forecasts, By System (2020-2032) (USD Million)
10.4.13.3 Rest of Asia Pacific Precision Aquaculture Market Estimates and Forecasts, By Application (2020-2032) (USD Million)
10.5 Middle East and Africa
10.5.1 Middle East
10.5.1.1 Trends Analysis
10.5.1.2 Middle East Precision Aquaculture Market Estimates and Forecasts, by Country (2020-2032) (USD Million)
10.5.1.3 Middle East Precision Aquaculture Market Estimates and Forecasts, By Component (2020-2032) (USD Million)
10.5.1.4 Middle East Precision Aquaculture Market Estimates and Forecasts, By System (2020-2032) (USD Million)
10.5.1.5 Middle East Precision Aquaculture Market Estimates and Forecasts, By Application (2020-2032) (USD Million)
10.5.1.6 UAE
10.5.1.6.1 UAE Precision Aquaculture Market Estimates and Forecasts, By Component (2020-2032) (USD Million)
10.5.1.6.2 UAE Precision Aquaculture Market Estimates and Forecasts, By System (2020-2032) (USD Million)
10.5.1.6.3 UAE Precision Aquaculture Market Estimates and Forecasts, By Application (2020-2032) (USD Million)
10.5.1.7 Egypt
10.5.1.7.1 Egypt Precision Aquaculture Market Estimates and Forecasts, By Component (2020-2032) (USD Million)
10.5.1.7.2 Egypt Precision Aquaculture Market Estimates and Forecasts, By System (2020-2032) (USD Million)
10.5.1.7.3 Egypt Precision Aquaculture Market Estimates and Forecasts, By Application (2020-2032) (USD Million)
10.5.1.8 Saudi Arabia
10.5.1.8.1 Saudi Arabia Precision Aquaculture Market Estimates and Forecasts, By Component (2020-2032) (USD Million)
10.5.1.8.2 Saudi Arabia Precision Aquaculture Market Estimates and Forecasts, By System (2020-2032) (USD Million)
10.5.1.8.3 Saudi Arabia Precision Aquaculture Market Estimates and Forecasts, By Application (2020-2032) (USD Million)
10.5.1.9 Qatar
10.5.1.9.1 Qatar Precision Aquaculture Market Estimates and Forecasts, By Component (2020-2032) (USD Million)
10.5.1.9.2 Qatar Precision Aquaculture Market Estimates and Forecasts, By System (2020-2032) (USD Million)
10.5.1.9.3 Qatar Precision Aquaculture Market Estimates and Forecasts, By Application (2020-2032) (USD Million)
10.5.1.10 Rest of Middle East
10.5.1.10.1 Rest of Middle East Precision Aquaculture Market Estimates and Forecasts, By Component (2020-2032) (USD Million)
10.5.1.10.2 Rest of Middle East Precision Aquaculture Market Estimates and Forecasts, By System (2020-2032) (USD Million)
10.5.1.10.3 Rest of Middle East Precision Aquaculture Market Estimates and Forecasts, By Application (2020-2032) (USD Million)
10.5.2 Africa
10.5.2.1 Trends Analysis
10.5.2.2 Africa Precision Aquaculture Market Estimates and Forecasts, by Country (2020-2032) (USD Million)
10.5.2.3 Africa Precision Aquaculture Market Estimates and Forecasts, By Component (2020-2032) (USD Million)
10.5.2.4 Africa Precision Aquaculture Market Estimates and Forecasts, By System (2020-2032) (USD Million)
10.5.2.5 Africa Precision Aquaculture Market Estimates and Forecasts, By Application (2020-2032) (USD Million)
10.5.2.6 South Africa
10.5.2.6.1 South Africa Precision Aquaculture Market Estimates and Forecasts, By Component (2020-2032) (USD Million)
10.5.2.6.2 South Africa Precision Aquaculture Market Estimates and Forecasts, By System (2020-2032) (USD Million)
10.5.2.6.3 South Africa Precision Aquaculture Market Estimates and Forecasts, By Application (2020-2032) (USD Million)
10.5.2.7 Nigeria
10.5.2.7.1 Nigeria Precision Aquaculture Market Estimates and Forecasts, By Component (2020-2032) (USD Million)
10.5.2.7.2 Nigeria Precision Aquaculture Market Estimates and Forecasts, By System (2020-2032) (USD Million)
10.5.2.7.3 Nigeria Precision Aquaculture Market Estimates and Forecasts, By Application (2020-2032) (USD Million)
10.5.2.8 Rest of Africa
10.5.2.8.1 Rest of Africa Precision Aquaculture Market Estimates and Forecasts, By Component (2020-2032) (USD Million)
10.5.2.8.2 Rest of Africa Precision Aquaculture Market Estimates and Forecasts, By System (2020-2032) (USD Million)
10.5.2.8.3 Rest of Africa Precision Aquaculture Market Estimates and Forecasts, By Application (2020-2032) (USD Million)
10.6 Latin America
10.6.1 Trends Analysis
10.6.2 Latin America Precision Aquaculture Market Estimates and Forecasts, by Country (2020-2032) (USD Million)
10.6.3 Latin America Precision Aquaculture Market Estimates and Forecasts, By Component (2020-2032) (USD Million)
10.6.4 Latin America Precision Aquaculture Market Estimates and Forecasts, By System (2020-2032) (USD Million)
10.6.5 Latin America Precision Aquaculture Market Estimates and Forecasts, By Application (2020-2032) (USD Million)
10.6.6 Brazil
10.6.6.1 Brazil Precision Aquaculture Market Estimates and Forecasts, By Component (2020-2032) (USD Million)
10.6.6.2 Brazil Precision Aquaculture Market Estimates and Forecasts, By System (2020-2032) (USD Million)
10.6.6.3 Brazil Precision Aquaculture Market Estimates and Forecasts, By Application (2020-2032) (USD Million)
10.6.7 Argentina
10.6.7.1 Argentina Precision Aquaculture Market Estimates and Forecasts, By Component (2020-2032) (USD Million)
10.6.7.2 Argentina Precision Aquaculture Market Estimates and Forecasts, By System (2020-2032) (USD Million)
10.6.7.3 Argentina Precision Aquaculture Market Estimates and Forecasts, By Application (2020-2032) (USD Million)
10.6.8 Colombia
10.6.8.1 Colombia Precision Aquaculture Market Estimates and Forecasts, By Component (2020-2032) (USD Million)
10.6.8.2 Colombia Precision Aquaculture Market Estimates and Forecasts, By System (2020-2032) (USD Million)
10.6.8.3 Colombia Precision Aquaculture Market Estimates and Forecasts, By Application (2020-2032) (USD Million)
10.6.9 Rest of Latin America
10.6.9.1 Rest of Latin America Precision Aquaculture Market Estimates and Forecasts, By Component (2020-2032) (USD Million)
10.6.9.2 Rest of Latin America Precision Aquaculture Market Estimates and Forecasts, By System (2020-2032) (USD Million)
10.6.9.3 Rest of Latin America Precision Aquaculture Market Estimates and Forecasts, By Application (2020-2032) (USD Million)
11. Company Profiles
11.1 AKVA group
11.1.1 Company Overview
11.1.2 Financial
11.1.3 Products/ Services Offered
11.1.4 SWOT Analysis
11.2 InnovaSea Systems.
11.2.1 Company Overview
11.2.2 Financial
11.2.3 Products/ Services Offered
11.2.4 SWOT Analysis
11.3 Steinsvik (ScaleAQ)
11.3.1 Company Overview
11.3.2 Financial
11.3.3 Products/ Services Offered
11.3.4 SWOT Analysis
11.4 Deep Trekker
11.4.1 Company Overview
11.4.2 Financial
11.4.3 Products/ Services Offered
11.4.4 SWOT Analysis
11.5 Aquabyte
11.5.1 Company Overview
11.5.2 Financial
11.5.3 Products/ Services Offered
11.5.4 SWOT Analysis
11.6 Eruvaka Technologies
11.6.1 Company Overview
11.6.2 Financial
11.6.3 Products/ Services Offered
11.6.4 SWOT Analysis
11.7 Akuakare.
11.7.1 Company Overview
11.7.2 Financial
11.7.3 Products/ Services Offered
11.7.4 SWOT Analysis
11.8 CPI Equipment
11.8.1 Company Overview
11.8.2 Financial
11.8.3 Products/ Services Offered
11.8.4 SWOT Analysis
11.9 Lifegard Aquatics.
11.9.1 Company Overview
11.9.2 Financial
11.9.3 Products/ Services Offered
11.9.4 SWOT Analysis
11.10 Bluegrove.
11.10.1 Company Overview
11.10.2 Financial
11.10.3 Products/ Services Offered
11.10.4 SWOT Analysis
12. Use Cases and Best Practices
13. Conclusion
An accurate research report requires proper strategizing as well as implementation. There are multiple factors involved in the completion of good and accurate research report and selecting the best methodology to compete the research is the toughest part. Since the research reports we provide play a crucial role in any company’s decision-making process, therefore we at SNS Insider always believe that we should choose the best method which gives us results closer to reality. This allows us to reach at a stage wherein we can provide our clients best and accurate investment to output ratio.
Each report that we prepare takes a timeframe of 350-400 business hours for production. Starting from the selection of titles through a couple of in-depth brain storming session to the final QC process before uploading our titles on our website we dedicate around 350 working hours. The titles are selected based on their current market cap and the foreseen CAGR and growth.
The 5 steps process:
Step 1: Secondary Research:
Secondary Research or Desk Research is as the name suggests is a research process wherein, we collect data through the readily available information. In this process we use various paid and unpaid databases which our team has access to and gather data through the same. This includes examining of listed companies’ annual reports, Journals, SEC filling etc. Apart from this our team has access to various associations across the globe across different industries. Lastly, we have exchange relationships with various university as well as individual libraries.

Step 2: Primary Research
When we talk about primary research, it is a type of study in which the researchers collect relevant data samples directly, rather than relying on previously collected data. This type of research is focused on gaining content specific facts that can be sued to solve specific problems. Since the collected data is fresh and first hand therefore it makes the study more accurate and genuine.
We at SNS Insider have divided Primary Research into 2 parts.
Part 1 wherein we interview the KOLs of major players as well as the upcoming ones across various geographic regions. This allows us to have their view over the market scenario and acts as an important tool to come closer to the accurate market numbers. As many as 45 paid and unpaid primary interviews are taken from both the demand and supply side of the industry to make sure we land at an accurate judgement and analysis of the market.
This step involves the triangulation of data wherein our team analyses the interview transcripts, online survey responses and observation of on filed participants. The below mentioned chart should give a better understanding of the part 1 of the primary interview.

Part 2: In this part of primary research the data collected via secondary research and the part 1 of the primary research is validated with the interviews from individual consultants and subject matter experts.
Consultants are those set of people who have at least 12 years of experience and expertise within the industry whereas Subject Matter Experts are those with at least 15 years of experience behind their back within the same space. The data with the help of two main processes i.e., FGDs (Focused Group Discussions) and IDs (Individual Discussions). This gives us a 3rd party nonbiased primary view of the market scenario making it a more dependable one while collation of the data pointers.
Step 3: Data Bank Validation
Once all the information is collected via primary and secondary sources, we run that information for data validation. At our intelligence centre our research heads track a lot of information related to the market which includes the quarterly reports, the daily stock prices, and other relevant information. Our data bank server gets updated every fortnight and that is how the information which we collected using our primary and secondary information is revalidated in real time.

Step 4: QA/QC Process
After all the data collection and validation our team does a final level of quality check and quality assurance to get rid of any unwanted or undesired mistakes. This might include but not limited to getting rid of the any typos, duplication of numbers or missing of any important information. The people involved in this process include technical content writers, research heads and graphics people. Once this process is completed the title gets uploader on our platform for our clients to read it.
Step 5: Final QC/QA Process:
This is the last process and comes when the client has ordered the study. In this process a final QA/QC is done before the study is emailed to the client. Since we believe in giving our clients a good experience of our research studies, therefore, to make sure that we do not lack at our end in any way humanly possible we do a final round of quality check and then dispatch the study to the client.
By Component
Hardware
Software
Service
By System
Smart Feeding Systems
Monitoring and Control Systems
By Application
Feed Optimization
Monitoring & Surveillance
Yield Analysis
Request for Segment Customization as per your Business Requirement: Segment Customization Request
Regional Coverage:
North America
US
Canada
Mexico
Europe
Eastern Europe
Poland
Romania
Hungary
Turkey
Rest of Eastern Europe
Western Europe
Germany
France
UK
Italy
Spain
Netherlands
Switzerland
Austria
Rest of Western Europe
Asia Pacific
China
India
Japan
South Korea
Vietnam
Singapore
Australia
Rest of Asia Pacific
Middle East & Africa
Middle East
UAE
Egypt
Saudi Arabia
Qatar
Rest of Middle East
Africa
Nigeria
South Africa
Rest of Africa
Latin America
Brazil
Argentina
Colombia
Rest of Latin America
Request for Country Level Research Report: Country Level Customization Request
Available Customization
With the given market data, SNS Insider offers customization as per the company’s specific needs. The following customization options are available for the report:
Detailed Volume Analysis
Criss-Cross segment analysis (e.g. Product X Application)
Competitive Product Benchmarking
Geographic Analysis
Additional countries in any of the regions
Customized Data Representation
Detailed analysis and profiling of additional market players
The Graphics Card Market was valued at 31.84 Billion in 2023 and is projected to reach USD 457.96 Billion by 2032, growing at a CAGR of 34.48% from 2024 to 2032.
The Humanoid Robot Market Size was valued at USD 2.21 Billion in 2023 and is expected to grow at a CAGR of 48.36% to reach USD 76.97 Billion by 2032.
The People Counting System Market Size was valued at USD 1.0 billion in 2023 and is expected to reach USD 3.101 billion by 2032 and grow at a CAGR of 13.4 % over the forecast period 2024-2032.
The Nuclear Robots Market was valued at USD 1.82 billion in 2023 and is expected to reach USD 5.23 billion by 2032, growing at a CAGR of 12.48% over the forecast period 2024-2032.
The Laser Printer Market Size was valued at USD 10.2 Billion in 2023 and It is expected to grow at a CAGR of 5.79% to reach USD 16.8 Billion by 2032.
The Hermetic Packaging Market was valued at USD 3.84 billion in 2023 and is projected to reach USD 7.36 billion by 2032, growing at a CAGR of 7.49% from 2024 to 2032.

Hi! Click one of our member below to chat on Phone
© 2025 All Rights Reserved by SNS Insider Pvt Ltd


