image

Power Sport Vehicle Tire Market Key Insights:
Power Sport Vehicle Tire Market Revenue Analysis

Get More Information on Power Sport Vehicle Tire Market - Request Sample Report

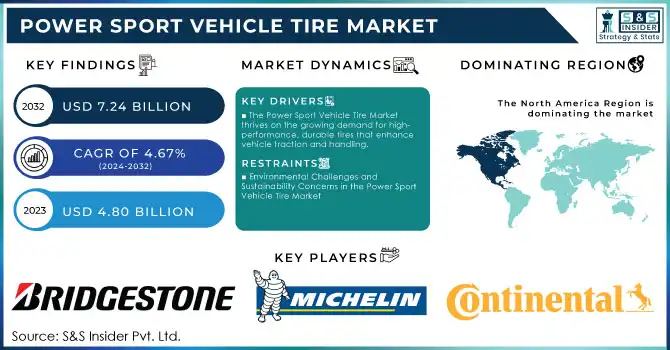
The Power Sport Vehicle Tire Market Size was valued at USD 4.80 billion in 2023 and is expected to reach USD 7.24 billion by 2032, and grow at a CAGR of 4.67% over the forecast period 2024-2032.

The Power Sport Vehicle Tire Market is experiencing significant growth, fueled by rising disposable incomes globally, particularly in emerging economies like India and developed regions such as the U.S. and China. Increased purchasing power is driving investments in power sport vehicles like ATVs, motorcycles, and snowmobiles, which in turn is creating higher demand for durable, high-performance tires. Being replacements, underscoring a sustained demand for tires in both consumer and power sport segments.

The Asia-Pacific region stands out as the fastest-growing market, significantly contributing to global expansion. Economic challenges, such as inflation and rising living costs in regions like South Africa, are exerting pressure on consumer spending, yet the growth in power sports vehicles remains robust. The demand for performance-oriented tires continues to thrive as recreational vehicles gain popularity.

Technological advancements in tire design and a growing trend toward eco-friendly power sports vehicles present new opportunities for innovation, further stimulating market growth. Between 2020 and 2023, global unit sales of tires increased from 56.63 million to 69.72 million, with passenger vehicles contributing to 46.3% of the global tire market’s revenue share as of 2024. The combination of rising disposable incomes, increased leisure vehicle ownership, and a growing global population are key factors driving this expansion. As a result, the market is expected to maintain its upward trajectory in the coming years.

Power Sport Vehicle Tire Market Dynamics

Drivers

  • The Power Sport Vehicle Tire Market thrives on the growing demand for high-performance, durable tires that enhance vehicle traction and handling.

The growing demand for vehicle customization and performance upgrades is a key driver for the Power Sport Vehicle Tire Market. As more enthusiasts seek to personalize their ATVs, motorcycles, and other power sports vehicles, the need for specialized tires designed for high performance, durability, and enhanced handling has surged. This trend is evident as consumers opt for tires that can withstand extreme terrain conditions like mud, snow, and sand. Tire manufacturers are responding to this demand with products that offer superior traction and control. Notably, Michelin’s collaboration with Ford to create custom-engineered tires for performance vehicles illustrates the tire industry’s commitment to meeting the evolving needs of power sports enthusiasts. Additionally, the tire modification trend, once primarily seen in passenger vehicles, is becoming more prevalent in power sports. Enthusiasts are increasingly focused on performance-oriented upgrades to optimize their vehicles for off-road and extreme driving experiences. As this market continues to grow, the demand for high-quality, customized tires designed to enhance overall driving performance is expected to rise steadily, positioning the power sport vehicle tire market for substantial expansion in the coming years.

Restraints

  • Environmental Challenges and Sustainability Concerns in the Power Sport Vehicle Tire Market

Environmental concerns present a key restraint to the Power Sport Vehicle Tire Market, as tire production and disposal contribute significantly to pollution and resource depletion. In 2023, 331.9 million tires were produced for vehicles, with the number expected to rise to 335.7 million in 2024. Tire manufacturing involves carbon-intensive processes, releasing approximately 367 tons of CO2 equivalent per tire, alongside particulate matter and toxic chemicals that contaminate air and water. Additionally, tire wear generates micro plastic particles, further harming ecosystems. The sourcing of natural rubber for tire production also results in deforestation, particularly in tropical regions, disrupting biodiversity. For power sport vehicles tire market, which demand specialized, high-performance tires, these environmental impacts are significant. As tires wear down, they release particulate matter into the environment, contributing to pollution. The production of heavier tires for electric vehicles, such as the Tesla Model Y and Ford F-150 Lightning, further exacerbates the environmental burden, as they generate more wear due to the increased weight. These factors pose challenges for the power sport vehicle tire market. Which must innovate toward more sustainable materials and manufacturing methods. Rising consumer demand for eco-friendly products and stricter regulations on tire waste management will require manufacturers to adapt, thus influencing market growth. Sustainable tire technologies and improved recycling practices will play a critical role in mitigating these environmental issues while supporting the continued growth of the power sport vehicle tire market.

Power Sport Vehicle Tire Market Segment Analysis

By Product Type

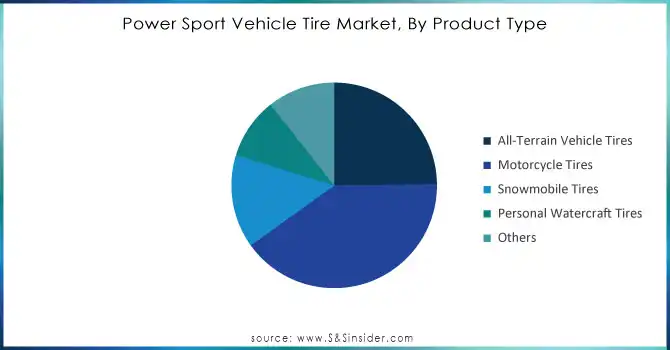
In 2023, motorcycle tires accounted for approximately 41% of the revenue share in the Power Sport Vehicle Tire Market, making them the largest product category. This dominance is driven by the widespread popularity of motorcycles across various regions, including emerging markets like Asia-Pacific and established markets such as North America and Europe. The increasing demand for high-performance tires, designed for both road and off-road conditions, contributes to this growth. As consumer interest in motorcycles for both recreational and commuting purposes rises, tire manufacturers are focused on improving durability, grip, and performance, further boosting the segment's share in the market.
Power-Sport-Vehicle-Tire-Market-By-Product-Type

Need Any Customization Research On Power Sport Vehicle Tire Market - Inquiry Now

By Distribution Channel

In 2023, the aftermarket segment captured the largest revenue share of around 52% in the Power Sport Vehicle Tire Market. This dominance is primarily driven by the growing trend of tire replacements and upgrades, as enthusiasts seek to enhance the performance and durability of their vehicles. The aftermarket offers a wide range of specialized tires for various power sports vehicles, including motorcycles and ATVs. As consumers increasingly demand tires that can handle extreme terrains or provide better handling, the aftermarket is well-positioned to meet these needs. Additionally, the rise of online platforms and specialized retailers has further fueled the growth of the aftermarket segment.

Power Sport Vehicle Tire Market Regional Overview

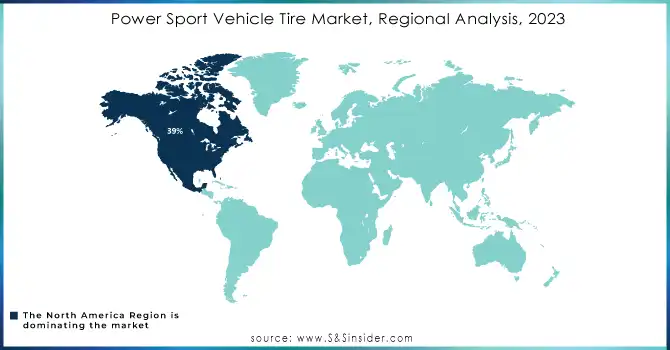
In 2023, North America held the largest revenue share of around 39% in the Power Sport Vehicle Tire Market, driven by the region's strong demand for motorcycles, ATVs, and other power sports vehicles. The U.S. and Canada are key markets, supported by a large consumer base that values outdoor recreation and sports, including off-roading and racing. The rising trend of vehicle customization and performance upgrades further boosts tire demand. Moreover, the well-established aftermarket distribution channels and increasing focus on high-performance tires contribute to North America's market dominance. The region's commitment to innovation and expanding recreational activities also supports sustained growth.

Asia-Pacific is the fastest-growing region in the Power Sport Vehicle Tire Market in 2023, driven by a surge in demand for power sports vehicles, particularly motorcycles and ATVs. The region benefits from increasing disposable incomes, rising urbanization, and growing interest in recreational activities. Countries like China, India, and Japan are key players, where the popularity of outdoor adventures and motorsports is contributing to higher tire consumption. Additionally, the expanding middle class and improvements in infrastructure further support market growth, making Asia-Pacific a significant driver in the global power sports vehicle tire market.
Power-Sport-Vehicle-Tire-Market-Regional-Analysis-2023.

Key Players in Power Sport Vehicle Tire Market

Some of the major key Players in Power Sport Vehicle Tire Market with product:

  • Bridgestone Corporation (Motorcycle Tires, ATV/UTV Tires)

  • Michelin (Snowmobile Tires, Motorcycle Tires)

  • Dunlop Tires (Performance Motorcycle Tires, Sport ATV Tires)

  • Pirelli (High-Performance Motorcycle Tires, Enduro Tires)

  • Continental AG (Adventure Motorcycle Tires, Touring Motorcycle Tires)

  • Goodyear Tire & Rubber Co. (ATV Tires, UTV Tires)

  • Maxxis International (Off-Road ATV/UTV Tires, Motorcycle Tires)

  • Yokohama Rubber Co., Ltd. (Adventure Motorcycle Tires, Sports Motorcycle Tires)

  • Kenda Tires (ATV Tires, Personal Watercraft Tires)

  • Carlisle Companies Inc. (ATV/UTV Tires, Snowmobile Tires)

  • BFGoodrich (All-Terrain ATV Tires, UTV Tires)

  • Metzeler (Touring Motorcycle Tires, Sports Motorcycle Tires)

  • Shinko Tires (Budget-Friendly Motorcycle Tires, Cruiser Tires)

  • CST Tires (Dirt Bike Tires, ATV/UTV Tires)

  • ITP Tires (Off-Road ATV Tires, Mud Tires for UTVs)

  • Interco Tire Corporation (Specialized Off-Road Tires, ATV/UTV Mud Tires)

  • Vee Rubber Group (Motorcycle Tires, Snowmobile Tires)

  • Hoosier Racing Tire (Racing Tires for Motorcycles, ATV Tires)

  • Avon Tyres (Performance Motorcycle Tires, Touring Tires)

  • Trelleborg AB (ATV/UTV Tires, Personal Watercraft Tires)

  • MRF(Motorcycle Tires, Radial and Bias Ply Tires, Cross Ply Tires)

List of suppliers of raw materials for vehicle tires:

  • Lanxess AG

  • Bridgestone Corporation

  • Goodyear Tire & Rubber Co.

  • Kraton Polymers

  • China National Petroleum Corporation (CNPC)

  • Michelin

  • SABIC (Saudi Basic Industries Corporation)

  • Solvay

  • ExxonMobil Chemical

  • TSRC Corporation

  • Reliance Industries Limited

  • Cabot Corporation

  • Arkema

  • Dow Chemical Company

  • JSR Corporation

  • PolyOne (Now Avient)

  • Bridgestone BSE (Bridgestone Synthetic Elastomer)

  • Indian Oil Corporation

  • Shandong Hitech Rubber Co., Ltd.

  • Nokian Tyres

Recent Development

  • August 22, 2024: Bridgestone has been named the exclusive tire partner for Lamborghini’s hybrid supercar, the Temerario, set to launch in 2025. The company has engineered three custom tires—Potenza Sport, Potenza Race, and Blizzak LM005—using its Virtual Tire Development technology to ensure high performance across summer, track, and winter conditions, while improving sustainability.

  • March 25, 2024: Michelin has surpassed 100 J.D. Power Awards, marking a historic milestone as the first tire company to achieve this. The brand received top rankings in the 2024 U.S. Original Equipment Tire Customer Satisfaction Study for Luxury, Passenger Car, and Performance Sport Vehicles, earning 102 awards in total.

  • August 9, 2024: The Continental Extreme Contact DWS06 Plus tires have been tested extensively on a Honda Civic Si, showcasing their performance across various road types and weather conditions. While not the most aggressive tire for high-performance handling, they proved to be a versatile, reliable choice for everyday and track use, providing solid value despite being on the pricier side.

Power Sport Vehicle Tire Market Report Scope:

Report Attributes Details
Market Size in 2023 USD 4.80  Billion
Market Size by 2032 USD 7.24 Billion
CAGR CAGR of 4.67% From 2024 to 2032
Base Year 2023
Forecast Period 2024-2032
Historical Data 2020-2022
Report Scope & Coverage Market Size, Segments Analysis, Competitive  Landscape, Regional Analysis, DROC & SWOT Analysis, Forecast Outlook
Key Segments • By Product Type (All-Terrain Vehicle Tires, Motorcycle Tires, Personal Watercraft Tires, Personal Watercraft Tires, Others)
• By Application (Racing, Recreational, Others)
• By Distribution Channel (OEM, Aftermarket)
Regional Analysis/Coverage North America (US, Canada, Mexico), Europe (Eastern Europe [Poland, Romania, Hungary, Turkey, Rest of Eastern Europe] Western Europe] Germany, France, UK, Italy, Spain, Netherlands, Switzerland, Austria, Rest of Western Europe]), Asia Pacific (China, India, Japan, South Korea, Vietnam, Singapore, Australia, Rest of Asia Pacific), Middle East & Africa (Middle East [UAE, Egypt, Saudi Arabia, Qatar, Rest of Middle East], Africa [Nigeria, South Africa, Rest of Africa], Latin America (Brazil, Argentina, Colombia, Rest of Latin America)
Company Profiles Bridgestone Corporation, Michelin, Dunlop Tires, Pirelli, Continental AG, Goodyear Tire & Rubber Co., Maxxis International, Yokohama Rubber Co., Ltd., Kenda Tires, Carlisle Companies Inc., BFGoodrich, Metzeler, Shinko Tires, CST Tires, ITP Tires, Interco Tire Corporation, Vee Rubber Group, Hoosier Racing Tire, Avon Tyres, and Trelleborg AB,MRFare key players in the Power Sport Vehicle Tire Market.
Key Drivers • The Power Sport Vehicle Tire Market thrives on the growing demand for high-performance, durable tires that enhance vehicle traction and handling.
Restraints • Environmental Challenges and Sustainability Concerns in the Power Sport Vehicle Tire Market

Frequently Asked Questions

Ans: Power Sport Vehicle Tire Market is anticipated to expand by 4.67% from 2024 to 2032.

Ans:  The Power Sport Vehicle Tire Market Size was valued at USD 4.80 billion in 2023 and is expected to reach USD 7.24 billion by 2032.

Ans: Increasing demand for high-performance tires from the growing number of power sports vehicle enthusiasts.

Ans: North America is dominating in Power Sport Vehicle Tire market

Ans: Motorcycle Tires is the dominating segment in Power Sport Vehicle Tire market

Table of Contents

1. Introduction

1.1 Market Definition

1.2 Scope (Inclusion and Exclusions)

1.3 Research Assumptions

2. Executive Summary

2.1 Market Overview

2.2 Regional Synopsis

2.3 Competitive Summary

3. Research Methodology

3.1 Top-Down Approach

3.2 Bottom-up Approach

3.3. Data Validation

3.4 Primary Interviews

4. Market Dynamics Impact Analysis

4.1 Market Driving Factors Analysis

4.1.1 Drivers

4.1.2 Restraints

4.1.3 Opportunities

4.1.4 Challenges

4.2 PESTLE Analysis

4.3 Porter’s Five Forces Model

5. Statistical Insights and Trends Reporting

5.1 Technological Adoption Rates

5.2 Consumer Preference Data

5.3 Production Capacity

5.4 Environmental Impact Data

5.5 Tire Performance Metrics

6. Competitive Landscape

6.1 List of Major Companies, By Region

6.2 Market Share Analysis, By Region

6.3 Product Benchmarking

6.3.1 Product specifications and features

6.3.2 Pricing

6.4 Strategic Initiatives

6.4.1 Marketing and promotional activities

6.4.2 Distribution and supply chain strategies

6.4.3 Expansion plans and new product launches

6.4.4 Strategic partnerships and collaborations

6.5 Technological Advancements

6.6 Market Positioning and Branding

7. Power Sport Vehicle Tire Market Segmentation, by Product Type

7.1 Chapter Overview

7.2 All-Terrain Vehicle Tires

7.2.1 All-Terrain Vehicle Tires Market Trends Analysis (2020-2032)

7.2.2 All-Terrain Vehicle Tires Market Size Estimates and Forecasts to 2032 (USD Billion)

7.3 Motorcycle Tires

7.3.1 Motorcycle Tires Market Trends Analysis (2020-2032)

7.3.2 Motorcycle Tires Market Size Estimates and Forecasts to 2032 (USD Billion)

7.4 Personal Watercraft Tires

7.4.1 Personal Watercraft Tires Market Trends Analysis (2020-2032)

7.4.2 Personal Watercraft Tires Market Size Estimates and Forecasts to 2032 (USD Billion)

7.5 Others

7.5.1 Others Market Trends Analysis (2020-2032)

7.5.2 Others Market Size Estimates and Forecasts to 2032 (USD Billion)

8. Power Sport Vehicle Tire Market Segmentation, by Application

8.1 Chapter Overview

8.2 Racing

8.2.1 Racing Market Trends Analysis (2020-2032)

8.2.2 Racing Market Size Estimates and Forecasts to 2032 (USD Billion)

8.3 Recreational

8.3.1 Recreational Market Trends Analysis (2020-2032)

8.3.2 Recreational Market Size Estimates and Forecasts to 2032 (USD Billion)

8.4 Others

8.4.1 Others Market Trends Analysis (2020-2032)

8.4.2 Others Market Size Estimates and Forecasts to 2032 (USD Billion)


9. Power Sport Vehicle Tire Market Segmentation, by Distribution Channel

9.1 Chapter Overview

9.2 OEM

9.2.1 OEM Market Trends Analysis (2020-2032)

9.2.2 OEM Market Size Estimates and Forecasts to 2032 (USD Billion)

9.3 Aftermarket

9.3.1 Aftermarket Market Trends Analysis (2020-2032)

9.3.2 Aftermarket Market Size Estimates and Forecasts to 2032 (USD Billion)

10. Regional Analysis

10.1 Chapter Overview

10.2 North America

10.2.1 Trends Analysis

10.2.2 North America Power Sport Vehicle Tire Market Estimates and Forecasts, by Country (2020-2032) (USD Billion)

10.2.3 North America Power Sport Vehicle Tire Market Estimates and Forecasts, by Product Type (2020-2032) (USD Billion)  

10.2.4 North America Power Sport Vehicle Tire Market Estimates and Forecasts, by Application  (2020-2032) (USD Billion)

10.2.5 North America Power Sport Vehicle Tire Market Estimates and Forecasts, by Distribution Channel  (2020-2032) (USD Billion)

10.2.6 USA

10.2.6.1 USA Power Sport Vehicle Tire Market Estimates and Forecasts, by Product Type (2020-2032) (USD Billion)

10.2.6.2 USA Power Sport Vehicle Tire Market Estimates and Forecasts, by Application  (2020-2032) (USD Billion)

10.2.6.3 USA Power Sport Vehicle Tire Market Estimates and Forecasts, by Distribution Channel  (2020-2032) (USD Billion)

10.2.7 Canada

10.2.7.1 Canada Power Sport Vehicle Tire Market Estimates and Forecasts, by Product Type (2020-2032) (USD Billion)

10.2.7.2 Canada Power Sport Vehicle Tire Market Estimates and Forecasts, by Application  (2020-2032) (USD Billion)

10.2.7.3 Canada Power Sport Vehicle Tire Market Estimates and Forecasts, by Distribution Channel  (2020-2032) (USD Billion)

10.2.8 Mexico

10.2.8.1 Mexico Power Sport Vehicle Tire Market Estimates and Forecasts, by Product Type (2020-2032) (USD Billion)

10.2.8.2 Mexico Power Sport Vehicle Tire Market Estimates and Forecasts, by Application  (2020-2032) (USD Billion)

10.2.8.3 Mexico Power Sport Vehicle Tire Market Estimates and Forecasts, by Distribution Channel  (2020-2032) (USD Billion)

10.3 Europe

10.3.1 Eastern Europe

10.3.1.1 Trends Analysis

10.3.1.2 Eastern Europe Power Sport Vehicle Tire Market Estimates and Forecasts, by Country (2020-2032) (USD Billion)

10.3.1.3 Eastern Europe Power Sport Vehicle Tire Market Estimates and Forecasts, by Product Type (2020-2032) (USD Billion)  

10.3.1.4 Eastern Europe Power Sport Vehicle Tire Market Estimates and Forecasts, by Application  (2020-2032) (USD Billion)

10.3.1.5 Eastern Europe Power Sport Vehicle Tire Market Estimates and Forecasts, by Distribution Channel  (2020-2032) (USD Billion)

10.3.1.6 Poland

10.3.1.6.1 Poland Power Sport Vehicle Tire Market Estimates and Forecasts, by Product Type (2020-2032) (USD Billion)

10.3.1.6.2 Poland Power Sport Vehicle Tire Market Estimates and Forecasts, by Application  (2020-2032) (USD Billion)

10.3.1.6.3 Poland Power Sport Vehicle Tire Market Estimates and Forecasts, by Distribution Channel  (2020-2032) (USD Billion)

10.3.1.7 Romania

10.3.1.7.1 Romania Power Sport Vehicle Tire Market Estimates and Forecasts, by Product Type (2020-2032) (USD Billion)

10.3.1.7.2 Romania Power Sport Vehicle Tire Market Estimates and Forecasts, by Application  (2020-2032) (USD Billion)

10.3.1.7.3 Romania Power Sport Vehicle Tire Market Estimates and Forecasts, by Distribution Channel  (2020-2032) (USD Billion)

10.3.1.8 Hungary

10.3.1.8.1 Hungary Power Sport Vehicle Tire Market Estimates and Forecasts, by Product Type (2020-2032) (USD Billion)

10.3.1.8.2 Hungary Power Sport Vehicle Tire Market Estimates and Forecasts, by Application  (2020-2032) (USD Billion)

10.3.1.8.3 Hungary Power Sport Vehicle Tire Market Estimates and Forecasts, by Distribution Channel  (2020-2032) (USD Billion)

10.3.1.9 Turkey

10.3.1.9.1 Turkey Power Sport Vehicle Tire Market Estimates and Forecasts, by Product Type (2020-2032) (USD Billion)

10.3.1.9.2 Turkey Power Sport Vehicle Tire Market Estimates and Forecasts, by Application  (2020-2032) (USD Billion)

10.3.1.9.3 Turkey Power Sport Vehicle Tire Market Estimates and Forecasts, by Distribution Channel  (2020-2032) (USD Billion)

10.3.1.10 Rest of Eastern Europe

10.3.1.10.1 Rest of Eastern Europe Power Sport Vehicle Tire Market Estimates and Forecasts, by Product Type (2020-2032) (USD Billion)

10.3.1.10.2 Rest of Eastern Europe Power Sport Vehicle Tire Market Estimates and Forecasts, by Application  (2020-2032) (USD Billion)

10.3.1.10.3 Rest of Eastern Europe Power Sport Vehicle Tire Market Estimates and Forecasts, by Distribution Channel  (2020-2032) (USD Billion)

10.3.2 Western Europe

10.3.2.1 Trends Analysis

10.3.2.2 Western Europe Power Sport Vehicle Tire Market Estimates and Forecasts, by Country (2020-2032) (USD Billion)

10.3.2.3 Western Europe Power Sport Vehicle Tire Market Estimates and Forecasts, by Product Type (2020-2032) (USD Billion)  

10.3.2.4 Western Europe Power Sport Vehicle Tire Market Estimates and Forecasts, by Application  (2020-2032) (USD Billion)

10.3.2.5 Western Europe Power Sport Vehicle Tire Market Estimates and Forecasts, by Distribution Channel  (2020-2032) (USD Billion)

10.3.2.6 Germany

10.3.2.6.1 Germany Power Sport Vehicle Tire Market Estimates and Forecasts, by Product Type (2020-2032) (USD Billion)

10.3.2.6.2 Germany Power Sport Vehicle Tire Market Estimates and Forecasts, by Application  (2020-2032) (USD Billion)

10.3.2.6.3 Germany Power Sport Vehicle Tire Market Estimates and Forecasts, by Distribution Channel  (2020-2032) (USD Billion)

10.3.2.7 France

10.3.2.7.1 France Power Sport Vehicle Tire Market Estimates and Forecasts, by Product Type (2020-2032) (USD Billion)

10.3.2.7.2 France Power Sport Vehicle Tire Market Estimates and Forecasts, by Application  (2020-2032) (USD Billion)

10.3.2.7.3 France Power Sport Vehicle Tire Market Estimates and Forecasts, by Distribution Channel  (2020-2032) (USD Billion)

10.3.2.8 UK

10.3.2.8.1 UK Power Sport Vehicle Tire Market Estimates and Forecasts, by Product Type (2020-2032) (USD Billion)

10.3.2.8.2 UK Power Sport Vehicle Tire Market Estimates and Forecasts, by Application  (2020-2032) (USD Billion)

10.3.2.8.3 UK Power Sport Vehicle Tire Market Estimates and Forecasts, by Distribution Channel  (2020-2032) (USD Billion)

10.3.2.9 Italy

10.3.2.9.1 Italy Power Sport Vehicle Tire Market Estimates and Forecasts, by Product Type (2020-2032) (USD Billion)

10.3.2.9.2 Italy Power Sport Vehicle Tire Market Estimates and Forecasts, by Application  (2020-2032) (USD Billion)

10.3.2.9.3 Italy Power Sport Vehicle Tire Market Estimates and Forecasts, by Distribution Channel  (2020-2032) (USD Billion)

10.3.2.10 Spain

10.3.2.10.1 Spain Power Sport Vehicle Tire Market Estimates and Forecasts, by Product Type (2020-2032) (USD Billion)

10.3.2.10.2 Spain Power Sport Vehicle Tire Market Estimates and Forecasts, by Application  (2020-2032) (USD Billion)

10.3.2.10.3 Spain Power Sport Vehicle Tire Market Estimates and Forecasts, by Distribution Channel  (2020-2032) (USD Billion)

10.3.2.11 Netherlands

10.3.2.11.1 Netherlands Power Sport Vehicle Tire Market Estimates and Forecasts, by Product Type (2020-2032) (USD Billion)

10.3.2.11.2 Netherlands Power Sport Vehicle Tire Market Estimates and Forecasts, by Application  (2020-2032) (USD Billion)

10.3.2.11.3 Netherlands Power Sport Vehicle Tire Market Estimates and Forecasts, by Distribution Channel  (2020-2032) (USD Billion)

10.3.2.12 Switzerland

10.3.2.12.1 Switzerland Power Sport Vehicle Tire Market Estimates and Forecasts, by Product Type (2020-2032) (USD Billion)

10.3.2.12.2 Switzerland Power Sport Vehicle Tire Market Estimates and Forecasts, by Application  (2020-2032) (USD Billion)

10.3.2.12.3 Switzerland Power Sport Vehicle Tire Market Estimates and Forecasts, by Distribution Channel  (2020-2032) (USD Billion)

10.3.2.13 Austria

10.3.2.13.1 Austria Power Sport Vehicle Tire Market Estimates and Forecasts, by Product Type (2020-2032) (USD Billion)

10.3.2.13.2 Austria Power Sport Vehicle Tire Market Estimates and Forecasts, by Application  (2020-2032) (USD Billion)

10.3.2.13.3 Austria Power Sport Vehicle Tire Market Estimates and Forecasts, by Distribution Channel  (2020-2032) (USD Billion)

10.3.2.14 Rest of Western Europe

10.3.2.14.1 Rest of Western Europe Power Sport Vehicle Tire Market Estimates and Forecasts, by Product Type (2020-2032) (USD Billion)

10.3.2.14.2 Rest of Western Europe Power Sport Vehicle Tire Market Estimates and Forecasts, by Application  (2020-2032) (USD Billion)

10.3.2.14.3 Rest of Western Europe Power Sport Vehicle Tire Market Estimates and Forecasts, by Distribution Channel  (2020-2032) (USD Billion)

10.4 Asia Pacific

10.4.1 Trends Analysis

10.4.2 Asia Pacific Power Sport Vehicle Tire Market Estimates and Forecasts, by Country (2020-2032) (USD Billion)

10.4.3 Asia Pacific Power Sport Vehicle Tire Market Estimates and Forecasts, by Product Type (2020-2032) (USD Billion)  

10.4.4 Asia Pacific Power Sport Vehicle Tire Market Estimates and Forecasts, by Application  (2020-2032) (USD Billion)

10.4.5 Asia Pacific Power Sport Vehicle Tire Market Estimates and Forecasts, by Distribution Channel  (2020-2032) (USD Billion)

10.4.6 China

10.4.6.1 China Power Sport Vehicle Tire Market Estimates and Forecasts, by Product Type (2020-2032) (USD Billion)

10.4.6.2 China Power Sport Vehicle Tire Market Estimates and Forecasts, by Application  (2020-2032) (USD Billion)

10.4.6.3 China Power Sport Vehicle Tire Market Estimates and Forecasts, by Distribution Channel  (2020-2032) (USD Billion)

10.4.7 India

10.4.7.1 India Power Sport Vehicle Tire Market Estimates and Forecasts, by Product Type (2020-2032) (USD Billion)

10.4.7.2 India Power Sport Vehicle Tire Market Estimates and Forecasts, by Application  (2020-2032) (USD Billion)

10.4.7.3 India Power Sport Vehicle Tire Market Estimates and Forecasts, by Distribution Channel  (2020-2032) (USD Billion)

10.4.8 Japan

10.4.8.1 Japan Power Sport Vehicle Tire Market Estimates and Forecasts, by Product Type (2020-2032) (USD Billion)

10.4.8.2 Japan Power Sport Vehicle Tire Market Estimates and Forecasts, by Application  (2020-2032) (USD Billion)

10.4.8.3 Japan Power Sport Vehicle Tire Market Estimates and Forecasts, by Distribution Channel  (2020-2032) (USD Billion)

10.4.9 South Korea

10.4.9.1 South Korea Power Sport Vehicle Tire Market Estimates and Forecasts, by Product Type (2020-2032) (USD Billion)

10.4.9.2 South Korea Power Sport Vehicle Tire Market Estimates and Forecasts, by Application  (2020-2032) (USD Billion)

10.4.9.3 South Korea Power Sport Vehicle Tire Market Estimates and Forecasts, by Distribution Channel  (2020-2032) (USD Billion)

10.4.10 Vietnam

10.4.10.1 Vietnam Power Sport Vehicle Tire Market Estimates and Forecasts, by Product Type (2020-2032) (USD Billion)

10.4.10.2 Vietnam Power Sport Vehicle Tire Market Estimates and Forecasts, by Application  (2020-2032) (USD Billion)

10.4.10.3 Vietnam Power Sport Vehicle Tire Market Estimates and Forecasts, by Distribution Channel  (2020-2032) (USD Billion)

10.4.11 Singapore

10.4.11.1 Singapore Power Sport Vehicle Tire Market Estimates and Forecasts, by Product Type (2020-2032) (USD Billion)

10.4.11.2 Singapore Power Sport Vehicle Tire Market Estimates and Forecasts, by Application  (2020-2032) (USD Billion)

10.4.11.3 Singapore Power Sport Vehicle Tire Market Estimates and Forecasts, by Distribution Channel  (2020-2032) (USD Billion)

10.4.12 Australia

10.4.12.1 Australia Power Sport Vehicle Tire Market Estimates and Forecasts, by Product Type (2020-2032) (USD Billion)

10.4.12.2 Australia Power Sport Vehicle Tire Market Estimates and Forecasts, by Application  (2020-2032) (USD Billion)

10.4.12.3 Australia Power Sport Vehicle Tire Market Estimates and Forecasts, by Distribution Channel  (2020-2032) (USD Billion)

10.4.13 Rest of Asia Pacific

10.4.13.1 Rest of Asia Pacific Power Sport Vehicle Tire Market Estimates and Forecasts, by Product Type (2020-2032) (USD Billion)

10.4.13.2 Rest of Asia Pacific Power Sport Vehicle Tire Market Estimates and Forecasts, by Application  (2020-2032) (USD Billion)

10.4.13.3 Rest of Asia Pacific Power Sport Vehicle Tire Market Estimates and Forecasts, by Distribution Channel  (2020-2032) (USD Billion)

10.5 Middle East and Africa

10.5.1 Middle East

10.5.1.1 Trends Analysis

10.5.1.2 Middle East Power Sport Vehicle Tire Market Estimates and Forecasts, by Country (2020-2032) (USD Billion)

10.5.1.3 Middle East Power Sport Vehicle Tire Market Estimates and Forecasts, by Product Type (2020-2032) (USD Billion)  

10.5.1.4 Middle East Power Sport Vehicle Tire Market Estimates and Forecasts, by Application  (2020-2032) (USD Billion)

10.5.1.5 Middle East Power Sport Vehicle Tire Market Estimates and Forecasts, by Distribution Channel  (2020-2032) (USD Billion)

10.5.1.6 UAE

10.5.1.6.1 UAE Power Sport Vehicle Tire Market Estimates and Forecasts, by Product Type (2020-2032) (USD Billion)

10.5.1.6.2 UAE Power Sport Vehicle Tire Market Estimates and Forecasts, by Application  (2020-2032) (USD Billion)

10.5.1.6.3 UAE Power Sport Vehicle Tire Market Estimates and Forecasts, by Distribution Channel  (2020-2032) (USD Billion)

10.5.1.7 Egypt

10.5.1.7.1 Egypt Power Sport Vehicle Tire Market Estimates and Forecasts, by Product Type (2020-2032) (USD Billion)

10.5.1.7.2 Egypt Power Sport Vehicle Tire Market Estimates and Forecasts, by Application  (2020-2032) (USD Billion)

10.5.1.7.3 Egypt Power Sport Vehicle Tire Market Estimates and Forecasts, by Distribution Channel  (2020-2032) (USD Billion)

10.5.1.8 Saudi Arabia

10.5.1.8.1 Saudi Arabia Power Sport Vehicle Tire Market Estimates and Forecasts, by Product Type (2020-2032) (USD Billion)

10.5.1.8.2 Saudi Arabia Power Sport Vehicle Tire Market Estimates and Forecasts, by Application  (2020-2032) (USD Billion)

10.5.1.8.3 Saudi Arabia Power Sport Vehicle Tire Market Estimates and Forecasts, by Distribution Channel  (2020-2032) (USD Billion)

10.5.1.9 Qatar

10.5.1.9.1 Qatar Power Sport Vehicle Tire Market Estimates and Forecasts, by Product Type (2020-2032) (USD Billion)

10.5.1.9.2 Qatar Power Sport Vehicle Tire Market Estimates and Forecasts, by Application  (2020-2032) (USD Billion)

10.5.1.9.3 Qatar Power Sport Vehicle Tire Market Estimates and Forecasts, by Distribution Channel  (2020-2032) (USD Billion)

10.5.1.10 Rest of Middle East

10.5.1.10.1 Rest of Middle East Power Sport Vehicle Tire Market Estimates and Forecasts, by Product Type (2020-2032) (USD Billion)

10.5.1.10.2 Rest of Middle East Power Sport Vehicle Tire Market Estimates and Forecasts, by Application  (2020-2032) (USD Billion)

10.5.1.10.3 Rest of Middle East Power Sport Vehicle Tire Market Estimates and Forecasts, by Distribution Channel  (2020-2032) (USD Billion)

10.5.2 Africa

10.5.2.1 Trends Analysis

10.5.2.2 Africa Power Sport Vehicle Tire Market Estimates and Forecasts, by Country (2020-2032) (USD Billion)

10.5.2.3 Africa Power Sport Vehicle Tire Market Estimates and Forecasts, by Product Type (2020-2032) (USD Billion)  

10.5.2.4 Africa Power Sport Vehicle Tire Market Estimates and Forecasts, by Application  (2020-2032) (USD Billion)

10.5.2.5 Africa Power Sport Vehicle Tire Market Estimates and Forecasts, by Distribution Channel  (2020-2032) (USD Billion)

10.5.2.6 South Africa

10.5.2.6.1 South Africa Power Sport Vehicle Tire Market Estimates and Forecasts, by Product Type (2020-2032) (USD Billion)

10.5.2.6.2 South Africa Power Sport Vehicle Tire Market Estimates and Forecasts, by Application  (2020-2032) (USD Billion)

10.5.2.6.3 South Africa Power Sport Vehicle Tire Market Estimates and Forecasts, by Distribution Channel  (2020-2032) (USD Billion)

10.5.2.7 Nigeria

10.5.2.7.1 Nigeria Power Sport Vehicle Tire Market Estimates and Forecasts, by Product Type (2020-2032) (USD Billion)

10.5.2.7.2 Nigeria Power Sport Vehicle Tire Market Estimates and Forecasts, by Application  (2020-2032) (USD Billion)

10.5.2.7.3 Nigeria Power Sport Vehicle Tire Market Estimates and Forecasts, by Distribution Channel  (2020-2032) (USD Billion)

10.5.2.8 Rest of Africa

10.5.2.8.1 Rest of Africa Power Sport Vehicle Tire Market Estimates and Forecasts, by Product Type (2020-2032) (USD Billion)

10.5.2.8.2 Rest of Africa Power Sport Vehicle Tire Market Estimates and Forecasts, by Application  (2020-2032) (USD Billion)

10.5.2.8.3 Rest of Africa Power Sport Vehicle Tire Market Estimates and Forecasts, by Distribution Channel  (2020-2032) (USD Billion)

10.6 Latin America

10.6.1 Trends Analysis

10.6.2 Latin America Power Sport Vehicle Tire Market Estimates and Forecasts, by Country (2020-2032) (USD Billion)

10.6.3 Latin America Power Sport Vehicle Tire Market Estimates and Forecasts, by Product Type (2020-2032) (USD Billion)  

10.6.4 Latin America Power Sport Vehicle Tire Market Estimates and Forecasts, by Application  (2020-2032) (USD Billion)

10.6.5 Latin America Power Sport Vehicle Tire Market Estimates and Forecasts, by Distribution Channel  (2020-2032) (USD Billion)

10.6.6 Brazil

10.6.6.1 Brazil Power Sport Vehicle Tire Market Estimates and Forecasts, by Product Type (2020-2032) (USD Billion)

10.6.6.2 Brazil Power Sport Vehicle Tire Market Estimates and Forecasts, by Application  (2020-2032) (USD Billion)

10.6.6.3 Brazil Power Sport Vehicle Tire Market Estimates and Forecasts, by Distribution Channel  (2020-2032) (USD Billion)

10.6.7 Argentina

10.6.7.1 Argentina Power Sport Vehicle Tire Market Estimates and Forecasts, by Product Type (2020-2032) (USD Billion)

10.6.7.2 Argentina Power Sport Vehicle Tire Market Estimates and Forecasts, by Application  (2020-2032) (USD Billion)

10.6.7.3 Argentina Power Sport Vehicle Tire Market Estimates and Forecasts, by Distribution Channel  (2020-2032) (USD Billion)

10.6.8 Colombia

10.6.8.1 Colombia Power Sport Vehicle Tire Market Estimates and Forecasts, by Product Type (2020-2032) (USD Billion)

10.6.8.2 Colombia Power Sport Vehicle Tire Market Estimates and Forecasts, by Application  (2020-2032) (USD Billion)

10.6.8.3 Colombia Power Sport Vehicle Tire Market Estimates and Forecasts, by Distribution Channel  (2020-2032) (USD Billion)

10.6.9 Rest of Latin America

10.6.9.1 Rest of Latin America Power Sport Vehicle Tire Market Estimates and Forecasts, by Product Type (2020-2032) (USD Billion)

10.6.9.2 Rest of Latin America Power Sport Vehicle Tire Market Estimates and Forecasts, by Application  (2020-2032) (USD Billion)

10.6.9.3 Rest of Latin America Power Sport Vehicle Tire Market Estimates and Forecasts, by Distribution Channel  (2020-2032) (USD Billion)

11. Company Profiles

11.1 Bridgestone Corporation

11.1.1 Company Overview

11.1.2 Financial

11.1.3 Products/ Services Offered

11.1.4 SWOT Analysis

11.2 Michelin

11.2.1 Company Overview

11.2.2 Financial

11.2.3 Products/ Services Offered

11.2.4 SWOT Analysis

11.3 Dunlop Tires

11.3.1 Company Overview

11.3.2 Financial

11.3.3 Products/ Services Offered

11.3.4 SWOT Analysis

11.4 Pirelli

11.4.1 Company Overview

11.4.2 Financial

11.4.3 Products/ Services Offered

11.4.4 SWOT Analysis

11.5 Continental AG

11.5.1 Company Overview

11.5.2 Financial

11.5.3 Products/ Services Offered

11.5.4 SWOT Analysis

11.6 Goodyear Tire & Rubber Co

11.6.1 Company Overview

11.6.2 Financial

11.6.3 Products/ Services Offered

11.6.4 SWOT Analysis

11.7 Maxxis International

11.7.1 Company Overview

11.7.2 Financial

11.7.3 Products/ Services Offered

11.7.4 SWOT Analysis

11.8 Yokohama Rubber Co., Ltd.

11.8.1 Company Overview

11.8.2 Financial

11.8.3 Products/ Services Offered

11.8.4 SWOT Analysis

11.9 Kenda Tires

11.9.1 Company Overview

11.9.2 Financial

11.9.3 Products/ Services Offered

11.9.4 SWOT Analysis

11.10 Carlisle Companies Inc.

11.10.1 Company Overview

11.10.2 Financial

11.10.3 Products/ Services Offered

11.10.4 SWOT Analysis

12. Use Cases and Best Practices

13. Conclusion

An accurate research report requires proper strategizing as well as implementation. There are multiple factors involved in the completion of good and accurate research report and selecting the best methodology to compete the research is the toughest part. Since the research reports we provide play a crucial role in any company’s decision-making process, therefore we at SNS Insider always believe that we should choose the best method which gives us results closer to reality. This allows us to reach at a stage wherein we can provide our clients best and accurate investment to output ratio.

Each report that we prepare takes a timeframe of 350-400 business hours for production. Starting from the selection of titles through a couple of in-depth brain storming session to the final QC process before uploading our titles on our website we dedicate around 350 working hours. The titles are selected based on their current market cap and the foreseen CAGR and growth.


The 5 steps process:

Step 1: Secondary Research:

Secondary Research or Desk Research is as the name suggests is a research process wherein, we collect data through the readily available information. In this process we use various paid and unpaid databases which our team has access to and gather data through the same. This includes examining of listed companies’ annual reports, Journals, SEC filling etc. Apart from this our team has access to various associations across the globe across different industries. Lastly, we have exchange relationships with various university as well as individual libraries.

Secondary Research

Step 2: Primary Research

When we talk about primary research, it is a type of study in which the researchers collect relevant data samples directly, rather than relying on previously collected data.  This type of research is focused on gaining content specific facts that can be sued to solve specific problems. Since the collected data is fresh and first hand therefore it makes the study more accurate and genuine.

We at SNS Insider have divided Primary Research into 2 parts.

Part 1 wherein we interview the KOLs of major players as well as the upcoming ones across various geographic regions. This allows us to have their view over the market scenario and acts as an important tool to come closer to the accurate market numbers. As many as 45 paid and unpaid primary interviews are taken from both the demand and supply side of the industry to make sure we land at an accurate judgement and analysis of the market.

This step involves the triangulation of data wherein our team analyses the interview transcripts, online survey responses and observation of on filed participants. The below mentioned chart should give a better understanding of the part 1 of the primary interview.

Primary Research

Part 2: In this part of primary research the data collected via secondary research and the part 1 of the primary research is validated with the interviews from individual consultants and subject matter experts.

Consultants are those set of people who have at least 12 years of experience and expertise within the industry whereas Subject Matter Experts are those with at least 15 years of experience behind their back within the same space. The data with the help of two main processes i.e., FGDs (Focused Group Discussions) and IDs (Individual Discussions). This gives us a 3rd party nonbiased primary view of the market scenario making it a more dependable one while collation of the data pointers.

Step 3: Data Bank Validation

Once all the information is collected via primary and secondary sources, we run that information for data validation. At our intelligence centre our research heads track a lot of information related to the market which includes the quarterly reports, the daily stock prices, and other relevant information. Our data bank server gets updated every fortnight and that is how the information which we collected using our primary and secondary information is revalidated in real time.

Data Bank Validation

Step 4: QA/QC Process

After all the data collection and validation our team does a final level of quality check and quality assurance to get rid of any unwanted or undesired mistakes. This might include but not limited to getting rid of the any typos, duplication of numbers or missing of any important information. The people involved in this process include technical content writers, research heads and graphics people. Once this process is completed the title gets uploader on our platform for our clients to read it.

Step 5: Final QC/QA Process:

This is the last process and comes when the client has ordered the study. In this process a final QA/QC is done before the study is emailed to the client. Since we believe in giving our clients a good experience of our research studies, therefore, to make sure that we do not lack at our end in any way humanly possible we do a final round of quality check and then dispatch the study to the client.

Key Segmentation

By Product Type

  • All-Terrain Vehicle Tires

  • Motorcycle Tires

  • Snowmobile Tires

  • Personal Watercraft Tires

  • Others

By Application

  • Racing

  • Recreational

  • Others

By Distribution Channel

  • OEM

  • Aftermarket

Request for Segment Customization as per your Business Requirement: Segment Customization Request

REGIONAL COVERAGE:

North America

  • US

  • Canada

  • Mexico

Europe

  • Eastern Europe

    • Poland

    • Romania

    • Hungary

    • Turkey

    • Rest of Eastern Europe

  • Western Europe

    • Germany

    • France

    • UK

    • Italy

    • Spain

    • Netherlands

    • Switzerland

    • Austria

    • Rest of Western Europe

Asia-Pacific

  • China

  • India

  • Japan

  • South Korea

  • Vietnam

  • Singapore

  • Australia

  • Rest of Asia Pacific

Middle East & Africa

  • Middle East

    • UAE

    • Egypt

    • Saudi Arabia

    • Qatar

    • Rest of the Middle East

  • Africa

    • Nigeria

    • South Africa

    • Rest of Africa

Latin America

  • Brazil

  • Argentina

  • Colombia

  • Rest of Latin America

Request for Country Level Research Report: Country Level Customization Request

Available Customization

With the given market data, SNS Insider offers customization as per the company’s specific needs. The following customization options are available for the report:

  • Product Analysis

  • Criss-Cross segment analysis (e.g. Product X Application)

  • Product Matrix which gives a detailed comparison of the product portfolio of each company

  • Geographic Analysis

  • Additional countries in any of the regions

  • Company Information

  • Detailed analysis and profiling of additional market players (Up to five)


  •            5000 (33% Discount)


  •            8950 (40% Discount)


  •            3050 (23% Discount)

Start a Conversation

Hi! Click one of our member below to chat on Phone