image

Power Semiconductor Market Size & Growth Trends:

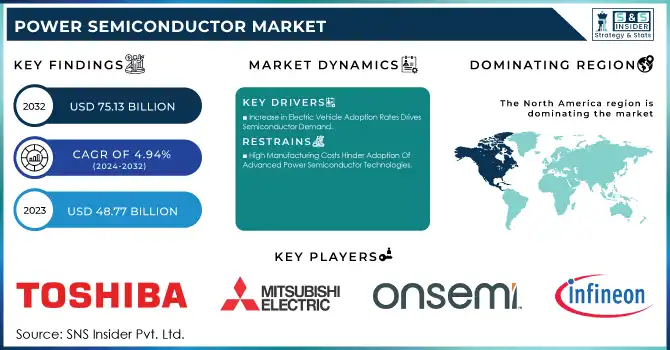
The Power Semiconductor Market Size was valued at USD 48.77 Billion in 2023 and is expected to reach USD 75.13 Billion by 2032 and grow at a CAGR of 4.94% over the forecast period 2024-2032.

Significant momentum has been experienced in the Power Semiconductors Market during 2023 and 2024 as more global pressure is created in energy efficiency, adoption of renewable energy, and industrial electrification. Japan, China, the USA, France, Germany, and India have spearheaded such growth with the adoption of high-end technologies and pro-government policies.

Power Semiconductor Market Revenue Analysis

Get more information on Power Semiconductor Market - Request Sample Report

For example, China, which has placed strategic emphases on clean energy, focusing on subsidies for electric vehicle (EV) manufacturers and renewable energy schemes, has emerged as a world leader. In the USA, the Inflation Reduction Act (IRA) presents further incentives for investment in such clean energy technologies. Japan takes the lead through its green growth strategy by emphasizing investments in energy-efficient power semiconductors for industrial as well as automotive applications.

Technological advancements are taking their forefront, and at the helm of this development stands the commercialization of silicon carbide (SiC) and gallium nitride (GaN) semiconductors. Israeli semiconductor manufacturer VisIC Technologies and AVL are also cooperating in the field of gallium nitride inverters for electric cars. There, they are developing new inverters that are going to outperform silicon-carbide-based inverters both in terms of performance as well as cost. Such semiconductor developments offer better energy efficiency, higher power density, and reduced energy losses. All of these features are of interest for applications in electric vehicles, renewable energy systems, and 5G telecommunications. Some of the notable launches during 2023 and 2024 include next-generation SiC MOSFETs and GaN-based power devices designed for high-demand applications like EV fast chargers and industrial automation.

Increasing penetration of EVs remains a key driver of the market growth. Global EV sales increased by more than 33% in 2023, according to reports from the International Energy Agency (IEA). Countries such as Germany and India are expanding their EV infrastructure at a lightning pace, driving demand for power semiconductors. In this space, renewable energy has also grown incredibly well, with solar capacity increasing 27% across the world in 2023. Advanced power semiconductors are thus the need of the hour to improve the efficiency of solar inverters, wind turbines, and battery storage systems.

Power Semiconductor Market Dynamics

KEY DRIVERS:  

  • Increase in Electric Vehicle Adoption Rates Drives Semiconductor Demand.

The growing penetration of electric vehicles (EVs) around the world has resulted in a strong demand for power semiconductors. These devices are critical to the efficient operation of EV powertrains, battery management systems, and charging infrastructure. According to the International Energy Agency (IEA), global EV cars rose by more than 55% in 2023, with countries like China and the USA leading the charge.

Power semiconductors, especially SiC and GaN devices, make it possible to charge more efficiently and save energy. Governments can also encourage the use of electric vehicles by offering incentives like the Indian FAME scheme or the German tax breaks for buying EVs. In short, the automotive industry is likely to focus on becoming an all-electric power vehicle segment for years to come, ensuring a continued market for these power semiconductors.

  • Growth In Renewable Energy Installations Accelerates Semiconductor Adoption.

Renewable energy expansion, driven by global decarbonization efforts, is the primary factor fueling the power semiconductors market. Advanced semiconductors are the backbone of optimal performance for solar inverters, wind turbines, and energy storage systems. According to the International Renewable Energy Agency, global solar capacity increased by 27% in 2023, with China, India, and the USA among the major contributors.

SiC-based semiconductors are significantly important in solar and wind power systems where efficiency is high, and the energy loss is less. The governments has also promoted renewable projects; for example, Germany wants to ensure 80% of the energy will be produced through renewable sources by 2030. Due to such commitment towards clean energy, power semiconductors have been integrated with an objective of long-term market growth and innovation.

RESTRAIN:

  • High Manufacturing Costs Hinder Adoption Of Advanced Power Semiconductor Technologies.

The high cost of manufacturing advanced power semiconductors, such as SiC and GaN devices, is a major barrier to widespread adoption. These materials are more expensive to produce than traditional silicon-based components, primarily because of complex fabrication processes and limited supply chains. For example, SiC wafers are about 40% more expensive than the conventional silicon wafers, according to industry sources in 2023. Furthermore, the global manufacturing capacity for these advanced materials is still inadequate.

Most manufacturers are struggling to scale up their production because of the high capital investment needed for state-of-the-art facilities. This cost constraint affects pricing, as the penetration of advanced devices is not possible in cost-sensitive markets such as India and Southeast Asia. Although government subsidies and R&D initiatives are aimed at solving these issues, the high initial costs remain a significant hindrance to rapid adoption. Thus, solving these barriers would be a key enabler of unlocking the full potential of the power semiconductors market.

Power Semiconductor Market Key Segments

by Component

The Discrete segment dominated in 2023 with 53% of market share due to its widespread use in automotive and consumer electronics. Such components are crucial in applications that demand high efficiency and reliability, such as inverters and motor drives.

On the other hand, the Module segment is expected to expand with the highest CAGR of 5.50% over the forecast period 2024-2032 due to their increasing applications in renewable energy systems and industrial automation.

Power ICs, which integrate various functions within compact designs, are in high demand in portable consumer products and IoT applications. Technological advancements in SiC and GaN materials are enhancing the efficiency of these components, thus making them indispensable for energy-intensive applications. This segment explains the diverse and constantly changing power semiconductors market.

by Application

The IT & Telecommunication segment dominated in 2023 with 29.67% of market share, driven by the rapid growth of 5G infrastructure and data centers across the globe. These applications demand high-performance power semiconductors to effectively manage energy efficiency and heat dissipation.

The Automotive segment is expected to grow with the fastest CAGR of 5.59% during the forecast period 2024-2032, driven by the accelerated adoption of electric vehicles and autonomous driving technologies. Industrial applications are also substantial, where advanced power semiconductors are used for automation and smart manufacturing processes.

The growing incorporation of these components in various sectors underlines their critical role in attaining operational efficiency and sustainability, further propelling the growth of the market.

Power Semiconductor Market Regional Overview

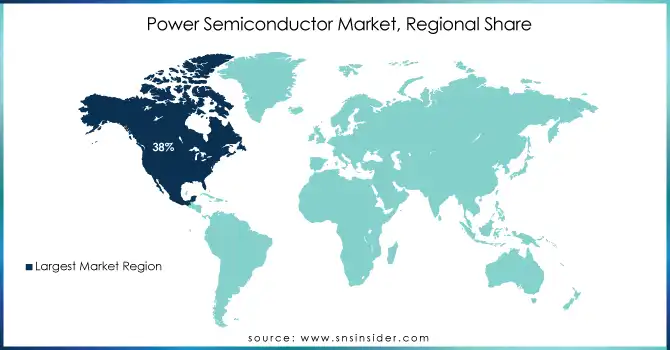
North America dominated in 2023 with 38% market share, driven by strong investments in renewable energy projects and electric vehicle infrastructure, particularly in the USA. Government incentives, such as tax credits for clean energy technologies, have further boosted market demand.

Asia Pacific is expected to grow the fastest with a CAGR of 6.07% during the forecast period 2024-2032, driven by rapid industrialization and urbanization in countries like China and India. Significant government initiatives, such as China's 2060 carbon neutrality goal and India's solar energy expansion, are catalyzing the adoption of advanced power semiconductor technologies.

Power-Semiconductor-Market-Regional-Share

Get Customized Report as per your Business Requirement - Ask For Customized Report

Key Players 

Some of the major players in the Power Semiconductors Market are  

  • Infineon Technologies (IGBT Modules, MOSFETs)

  • ON Semiconductor (Power MOSFETs, Gate Drivers)

  • Mitsubishi Electric (Power Modules, SiC Devices)

  • Toshiba Corporation (Power Transistors, Diodes)

  • STMicroelectronics (SiC MOSFETs, Power ICs)

  • Texas Instruments (Power Amplifiers, Voltage Regulators)

  • Vishay Intertechnology (Rectifiers, Optoelectronics)

  • Fuji Electric (IGBT Modules, Inverters)

  • NXP Semiconductors (Power Management ICs, RF Power Devices)

  • Renesas Electronics (Power MOSFETs, Gate Drivers)

  • ABB Ltd (Power Converters, HVDC Systems)

  • Broadcom Inc. (Optoelectronic Devices, Power Amplifiers)

  • Wolfspeed (SiC Substrates, GaN Devices)

  • Rohm Semiconductor (SiC Power Devices, ICs)

  • Hitachi Energy (IGBT Modules, SiC Diodes)

  • Semikron (IGBT Modules, Power Assemblies)

  • Littelfuse (Protection Relays, Fuses)

  • Microchip Technology (Gate Drivers, Power Modules)

  • Analog Devices (Power Management ICs, Signal Chains)

  • Delta Electronics (Power Converters, UPS Systems)

Major Suppliers (Components, Technologies)

  • Sumitomo Electric Industries (SiC Wafers, GaN Materials)

  • Dow Chemical (Silicon Materials, Epoxy Resins)

  • Cree Inc. (SiC Substrates, GaN Materials)

  • Shin-Etsu Chemical (Silicon Wafers, Polycrystalline Silicon)

  • Heraeus Electronics (Bonding Wires, Solder Pastes)

  • II-VI Incorporated (SiC Substrates, Epitaxial Wafers)

  • Applied Materials (Semiconductor Equipment, Deposition Systems)

  • Linde Group (Electronic Specialty Gases, Chemicals)

  • BASF SE (Electronic Chemicals, Advanced Polymers)

  • Sumco Corporation (Silicon Wafers, Epitaxial Substrates)

Major Clients

  • Tesla

  • General Electric

  • Siemens

  • Samsung Electronics

  • Huawei Technologies

  • Apple Inc.

  • LG Electronics

  • Boeing

  • Toyota Motor Corporation

  • Schneider Electric

Recent Trends

  • December 2024: ON Semi has announced the acquisition plans for Qorvo's Silicon Carbide (SiC) JFET business, enhancing its power semiconductor portfolio in the high and mid-voltage space. The deal is valued at USD 115 million and encompasses Qorvo's subsidiary United Silicon Carbide and is to be completed by Q1 2025.

  • December 2024: ROHM and TSMC will join forces in a strategic collaboration to develop and manufacture volume for gallium nitride power devices for electric vehicle applications. It will combine ROHM's device development technology with TSMC's GaN-on-silicon industry-leading process technology to keep up with the increasing demand of power devices that have more excellent high-voltage and high-frequency properties than those provided by silicon.

Power Semiconductor Market Report Scope:

Report Attributes Details
Market Size in 2023 USD 48.77 Billion
Market Size by 2032 USD 75.13 Billion
CAGR CAGR of 4.94 % From 2024 to 2032
Base Year 2023
Forecast Period 2024-2032
Historical Data 2020-2022
Report Scope & Coverage Market Size, Segments Analysis, Competitive  Landscape, Regional Analysis, DROC & SWOT Analysis, Forecast Outlook
Key Segments • By Component (Discrete, Module, Power Integrated Circuits),
• By Application (Automotive, Consumer Electronics, IT & Telecommunications, Military & Aerospace, Power, Industrial, and Other),
• By Material (SILICON CARBIDE, Gan SILICON, Other)
Regional Analysis/Coverage North America (US, Canada, Mexico), Europe (Eastern Europe [Poland, Romania, Hungary, Turkey, Rest of Eastern Europe] Western Europe] Germany, France, UK, Italy, Spain, Netherlands, Switzerland, Austria, Rest of Western Europe]), Asia Pacific (China, India, Japan, South Korea, Vietnam, Singapore, Australia, Rest of Asia Pacific), Middle East & Africa (Middle East [UAE, Egypt, Saudi Arabia, Qatar, Rest of Middle East], Africa [Nigeria, South Africa, Rest of Africa], Latin America (Brazil, Argentina, Colombia, Rest of Latin America)
Company Profiles Infineon Technologies, ON Semiconductor, Mitsubishi Electric, Toshiba Corporation, STMicroelectronics, Texas Instruments, Vishay Intertechnology, Fuji Electric, NXP Semiconductors, Renesas Electronics, ABB Ltd, Broadcom Inc., Wolfspeed, Rohm Semiconductor, Hitachi Energy, Semikron, Littelfuse, Microchip Technology, Analog Devices, Delta Electronics.
Key Drivers • Increase in Electric Vehicle Adoption Rates Drives Semiconductor Demand.
• Growth In Renewable Energy Installations Accelerates Semiconductor Adoption.
Restraints • High Manufacturing Costs Hinder Adoption Of Advanced Power Semiconductor Technologies.

Frequently Asked Questions

Ans: Power Semiconductor Market size was USD 48.77 Billion in 2023 and is expected to Reach USD 75.13 Billion by 2032.


Ans: The major growth factors of the Power Semiconductor Market are Increase in Electric Vehicle Adoption Rates and Growth In Renewable Energy Installations.

Ans: The Power Semiconductor Market is expected to grow at a CAGR of 4.94% during 2024-2032.

Ans: North America dominated the Power Semiconductor Market in 2023.

Ans: The Discrete segment dominated the Power Semiconductor Market.

TABLE OF CONTENT

1. Introduction

1.1 Market Definition

1.2 Scope (Inclusion and Exclusions)

1.3 Research Assumptions

2. Executive Summary

2.1 Market Overview

2.2 Regional Synopsis

2.3 Competitive Summary

3. Research Methodology

3.1 Top-Down Approach

3.2 Bottom-up Approach

3.3. Data Validation

3.4 Primary Interviews

4. Market Dynamics Impact Analysis

4.1 Market Driving Factors Analysis

4.1.1 Drivers

4.1.2 Restraints

4.1.3 Opportunities

4.1.4 Challenges

4.2 PESTLE Analysis

4.3 Porter’s Five Forces Model

5. Statistical Insights and Trends Reporting

5.1 Wafer Production Volumes, by Region (2023)

5.2 Chip Design Trends (Historic and Future)

5.3 Fab Capacity Utilization (2023)

5.4 Supply Chain Metrics

6. Competitive Landscape

6.1 List of Major Companies, by Region

6.2 Market Share Analysis, by Region

6.3 Product Benchmarking

6.3.1 Product specifications and features

6.3.2 Pricing

6.4 Strategic Initiatives

6.4.1 Marketing and promotional activities

6.4.2 Distribution and Supply Chain Strategies

6.4.3 Expansion plans and new product launches

6.4.4 Strategic partnerships and collaborations

6.5 Technological Advancements

6.6 Market Positioning and Branding

7. Power Semiconductor Market Segmentation, by Component

7.1 Chapter Overview

7.2 Discrete

7.2.1 Discrete Market Trends Analysis (2020-2032)

7.2.2 Discrete Market Size Estimates and Forecasts to 2032 (USD Billion)

7.3 Module

7.3.1 Module Market Trends Analysis (2020-2032)

7.3.2 Module Market Size Estimates and Forecasts to 2032 (USD Billion)

7.4 Power Integrated Circuits

7.4.1 Power Integrated Circuits Market Trends Analysis (2020-2032)

7.4.2 Power Integrated Circuits Market Size Estimates and Forecasts to 2032 (USD Billion)

8. Power Semiconductor Market Segmentation, by Application

     8.1 Chapter Overview

8.2 Automotive

8.2.1 Automotive Market Trends Analysis (2020-2032)

8.2.2 Automotive Market Size Estimates and Forecasts to 2032 (USD Billion)

8.3 Consumer Electronics

8.3.1 Consumer Electronics Market Trends Analysis (2020-2032)

8.3.2 Consumer Electronics Market Size Estimates and Forecasts to 2032 (USD Billion)

8.4 IT & Telecommunications

8.4.1 IT & Telecommunications Market Trends Analysis (2020-2032)

8.4.2 IT & Telecommunications Market Size Estimates and Forecasts to 2032 (USD Billion)

8.5 Military & Aerospace

8.5.1 Military & Aerospace Market Trends Analysis (2020-2032)

8.5.2 Military & Aerospace Market Size Estimates and Forecasts to 2032 (USD Billion)

8.6 Power

8.6.1 Power Market Trends Analysis (2020-2032)

8.6.2 Power Market Size Estimates and Forecasts to 2032 (USD Billion)

8.7 Industrial

8.7.1 Industrial Market Trends Analysis (2020-2032)

8.7.2 Industrial Market Size Estimates and Forecasts to 2032 (USD Billion)

8.8 Others

8.8.1 Others Market Trends Analysis (2020-2032)

8.8.2 Others Market Size Estimates and Forecasts to 2032 (USD Billion)

9. Power Semiconductor Market Segmentation, by Material

     9.1 Chapter Overview

9.2 SILICON CARBIDE

9.2.1 SILICON CARBIDE Market Trends Analysis (2020-2032)

9.2.2 SILICON CARBIDE Search Market Size Estimates and Forecasts to 2032 (USD Billion)

9.3 Gan SILICON

9.3.1 Gan SILICON Market Trends Analysis (2020-2032)

9.3.2 Gan SILICON Market Size Estimates and Forecasts to 2032 (USD Billion)

9.4 Other

9.4.1 Other Market Trends Analysis (2020-2032)

9.4.2 Other Market Size Estimates and Forecasts to 2032 (USD Billion)

10. Regional Analysis

10.1 Chapter Overview

10.2 North America

10.2.1 Trends Analysis

10.2.2 North America Power Semiconductor Market Estimates and Forecasts, by Country (2020-2032) (USD Billion)

10.2.3 North America Power Semiconductor Market Estimates and Forecasts, by Material (2020-2032) (USD Billion)  

10.2.4 North America Power Semiconductor Market Estimates and Forecasts, by Component (2020-2032) (USD Billion)

10.2.5 North America Power Semiconductor Market Estimates and Forecasts, by Application (2020-2032) (USD Billion)

10.2.6 USA

10.2.6.1 USA Power Semiconductor Market Estimates and Forecasts, by Material (2020-2032) (USD Billion)

10.2.6.2 USA Power Semiconductor Market Estimates and Forecasts, by Component (2020-2032) (USD Billion)

10.2.6.3 USA Power Semiconductor Market Estimates and Forecasts, by Application (2020-2032) (USD Billion)

10.2.7 Canada

10.2.7.1 Canada Power Semiconductor Market Estimates and Forecasts, by Material (2020-2032) (USD Billion)

10.2.7.2 Canada Power Semiconductor Market Estimates and Forecasts, by Component (2020-2032) (USD Billion)

10.2.7.3 Canada Power Semiconductor Market Estimates and Forecasts, by Application (2020-2032) (USD Billion)

10.2.8 Mexico

10.2.8.1 Mexico Power Semiconductor Market Estimates and Forecasts, by Material (2020-2032) (USD Billion)

10.2.8.2 Mexico Power Semiconductor Market Estimates and Forecasts, by Component (2020-2032) (USD Billion)

10.2.8.3 Mexico Power Semiconductor Market Estimates and Forecasts, by Application (2020-2032) (USD Billion)

10.3 Europe

10.3.1 Eastern Europe

10.3.1.1 Trends Analysis

10.3.1.2 Eastern Europe Power Semiconductor Market Estimates and Forecasts, by Country (2020-2032) (USD Billion)

10.3.1.3 Eastern Europe Power Semiconductor Market Estimates and Forecasts, by Material (2020-2032) (USD Billion)  

10.3.1.4 Eastern Europe Power Semiconductor Market Estimates and Forecasts, by Component (2020-2032) (USD Billion)

10.3.1.5 Eastern Europe Power Semiconductor Market Estimates and Forecasts, by Application (2020-2032) (USD Billion)

10.3.1.6 Poland

10.3.1.6.1 Poland Power Semiconductor Market Estimates and Forecasts, by Material (2020-2032) (USD Billion)

10.3.1.6.2 Poland Power Semiconductor Market Estimates and Forecasts, by Component (2020-2032) (USD Billion)

10.3.1.6.3 Poland Power Semiconductor Market Estimates and Forecasts, by Application (2020-2032) (USD Billion)

10.3.1.7 Romania

10.3.1.7.1 Romania Power Semiconductor Market Estimates and Forecasts, by Material (2020-2032) (USD Billion)

10.3.1.7.2 Romania Power Semiconductor Market Estimates and Forecasts, by Component (2020-2032) (USD Billion)

10.3.1.7.3 Romania Power Semiconductor Market Estimates and Forecasts, by Application (2020-2032) (USD Billion)

10.3.1.8 Hungary

10.3.1.8.1 Hungary Power Semiconductor Market Estimates and Forecasts, by Material (2020-2032) (USD Billion)

10.3.1.8.2 Hungary Power Semiconductor Market Estimates and Forecasts, by Component (2020-2032) (USD Billion)

10.3.1.8.3 Hungary Power Semiconductor Market Estimates and Forecasts, by Application (2020-2032) (USD Billion)

10.3.1.9 Turkey

10.3.1.9.1 Turkey Power Semiconductor Market Estimates and Forecasts, by Material (2020-2032) (USD Billion)

10.3.1.9.2 Turkey Power Semiconductor Market Estimates and Forecasts, by Component (2020-2032) (USD Billion)

10.3.1.9.3 Turkey Power Semiconductor Market Estimates and Forecasts, by Application (2020-2032) (USD Billion)

10.3.1.10 Rest of Eastern Europe

10.3.1.10.1 Rest of Eastern Europe Power Semiconductor Market Estimates and Forecasts, by Material (2020-2032) (USD Billion)

10.3.1.10.2 Rest of Eastern Europe Power Semiconductor Market Estimates and Forecasts, by Component (2020-2032) (USD Billion)

10.3.1.10.3 Rest of Eastern Europe Power Semiconductor Market Estimates and Forecasts, by Application (2020-2032) (USD Billion)

10.3.2 Western Europe

10.3.2.1 Trends Analysis

10.3.2.2 Western Europe Power Semiconductor Market Estimates and Forecasts, by Country (2020-2032) (USD Billion)

10.3.2.3 Western Europe Power Semiconductor Market Estimates and Forecasts, by Material (2020-2032) (USD Billion)  

10.3.2.4 Western Europe Power Semiconductor Market Estimates and Forecasts, by Component (2020-2032) (USD Billion)

10.3.2.5 Western Europe Power Semiconductor Market Estimates and Forecasts, by Application (2020-2032) (USD Billion)

10.3.2.6 Germany

10.3.2.6.1 Germany Power Semiconductor Market Estimates and Forecasts, by Material (2020-2032) (USD Billion)

10.3.2.6.2 Germany Power Semiconductor Market Estimates and Forecasts, by Component (2020-2032) (USD Billion)

10.3.2.6.3 Germany Power Semiconductor Market Estimates and Forecasts, by Application (2020-2032) (USD Billion)

10.3.2.7 France

10.3.2.7.1 France Power Semiconductor Market Estimates and Forecasts, by Material (2020-2032) (USD Billion)

10.3.2.7.2 France Power Semiconductor Market Estimates and Forecasts, by Component (2020-2032) (USD Billion)

10.3.2.7.3 France Power Semiconductor Market Estimates and Forecasts, by Application (2020-2032) (USD Billion)

10.3.2.8 UK

10.3.2.8.1 UK Power Semiconductor Market Estimates and Forecasts, by Material (2020-2032) (USD Billion)

10.3.2.8.2 UK Power Semiconductor Market Estimates and Forecasts, by Component (2020-2032) (USD Billion)

10.3.2.8.3 UK Power Semiconductor Market Estimates and Forecasts, by Application (2020-2032) (USD Billion)

10.3.2.9 Italy

10.3.2.9.1 Italy Power Semiconductor Market Estimates and Forecasts, by Material (2020-2032) (USD Billion)

10.3.2.9.2 Italy Power Semiconductor Market Estimates and Forecasts, by Component (2020-2032) (USD Billion)

10.3.2.9.3 Italy Power Semiconductor Market Estimates and Forecasts, by Application (2020-2032) (USD Billion)

10.3.2.10 Spain

10.3.2.10.1 Spain Power Semiconductor Market Estimates and Forecasts, by Material (2020-2032) (USD Billion)

10.3.2.10.2 Spain Power Semiconductor Market Estimates and Forecasts, by Component (2020-2032) (USD Billion)

10.3.2.10.3 Spain Power Semiconductor Market Estimates and Forecasts, by Application (2020-2032) (USD Billion)

10.3.2.11 Netherlands

10.3.2.11.1 Netherlands Power Semiconductor Market Estimates and Forecasts, by Material (2020-2032) (USD Billion)

10.3.2.11.2 Netherlands Power Semiconductor Market Estimates and Forecasts, by Component (2020-2032) (USD Billion)

10.3.2.11.3 Netherlands Power Semiconductor Market Estimates and Forecasts, by Application (2020-2032) (USD Billion)

10.3.2.12 Switzerland

10.3.2.12.1 Switzerland Power Semiconductor Market Estimates and Forecasts, by Material (2020-2032) (USD Billion)

10.3.2.12.2 Switzerland Power Semiconductor Market Estimates and Forecasts, by Component (2020-2032) (USD Billion)

10.3.2.12.3 Switzerland Power Semiconductor Market Estimates and Forecasts, by Application (2020-2032) (USD Billion)

10.3.2.13 Austria

10.3.2.13.1 Austria Power Semiconductor Market Estimates and Forecasts, by Material (2020-2032) (USD Billion)

10.3.2.13.2 Austria Power Semiconductor Market Estimates and Forecasts, by Component (2020-2032) (USD Billion)

10.3.2.13.3 Austria Power Semiconductor Market Estimates and Forecasts, by Application (2020-2032) (USD Billion)

10.3.2.14 Rest of Western Europe

10.3.2.14.1 Rest of Western Europe Power Semiconductor Market Estimates and Forecasts, by Material (2020-2032) (USD Billion)

10.3.2.14.2 Rest of Western Europe Power Semiconductor Market Estimates and Forecasts, by Component (2020-2032) (USD Billion)

10.3.2.14.3 Rest of Western Europe Power Semiconductor Market Estimates and Forecasts, by Application (2020-2032) (USD Billion)

10.4 Asia Pacific

10.4.1 Trends Analysis

10.4.2 Asia Pacific Power Semiconductor Market Estimates and Forecasts, by Country (2020-2032) (USD Billion)

10.4.3 Asia Pacific Power Semiconductor Market Estimates and Forecasts, by Material (2020-2032) (USD Billion)  

10.4.4 Asia Pacific Power Semiconductor Market Estimates and Forecasts, by Component (2020-2032) (USD Billion)

10.4.5 Asia Pacific Power Semiconductor Market Estimates and Forecasts, by Application (2020-2032) (USD Billion)

10.4.6 China

10.4.6.1 China Power Semiconductor Market Estimates and Forecasts, by Material (2020-2032) (USD Billion)

10.4.6.2 China Power Semiconductor Market Estimates and Forecasts, by Component (2020-2032) (USD Billion)

10.4.6.3 China Power Semiconductor Market Estimates and Forecasts, by Application (2020-2032) (USD Billion)

10.4.7 India

10.4.7.1 India Power Semiconductor Market Estimates and Forecasts, by Material (2020-2032) (USD Billion)

10.4.7.2 India Power Semiconductor Market Estimates and Forecasts, by Component (2020-2032) (USD Billion)

10.4.7.3 India Power Semiconductor Market Estimates and Forecasts, by Application (2020-2032) (USD Billion)

10.4.8 Japan

10.4.8.1 Japan Power Semiconductor Market Estimates and Forecasts, by Material (2020-2032) (USD Billion)

10.4.8.2 Japan Power Semiconductor Market Estimates and Forecasts, by Component (2020-2032) (USD Billion)

10.4.8.3 Japan Power Semiconductor Market Estimates and Forecasts, by Application (2020-2032) (USD Billion)

10.4.9 South Korea

10.4.9.1 South Korea Power Semiconductor Market Estimates and Forecasts, by Material (2020-2032) (USD Billion)

10.4.9.2 South Korea Power Semiconductor Market Estimates and Forecasts, by Component (2020-2032) (USD Billion)

10.4.9.3 South Korea Power Semiconductor Market Estimates and Forecasts, by Application (2020-2032) (USD Billion)

10.4.10 Vietnam

10.4.10.1 Vietnam Power Semiconductor Market Estimates and Forecasts, by Material (2020-2032) (USD Billion)

10.4.10.2 Vietnam Power Semiconductor Market Estimates and Forecasts, by Component (2020-2032) (USD Billion)

10.4.10.3 Vietnam Power Semiconductor Market Estimates and Forecasts, by Application (2020-2032) (USD Billion)

10.4.11 Singapore

10.4.11.1 Singapore Power Semiconductor Market Estimates and Forecasts, by Material (2020-2032) (USD Billion)

10.4.11.2 Singapore Power Semiconductor Market Estimates and Forecasts, by Component (2020-2032) (USD Billion)

10.4.11.3 Singapore Power Semiconductor Market Estimates and Forecasts, by Application (2020-2032) (USD Billion)

10.4.12 Australia

10.4.12.1 Australia Power Semiconductor Market Estimates and Forecasts, by Material (2020-2032) (USD Billion)

10.4.12.2 Australia Power Semiconductor Market Estimates and Forecasts, by Component (2020-2032) (USD Billion)

10.4.12.3 Australia Power Semiconductor Market Estimates and Forecasts, by Application (2020-2032) (USD Billion)

10.4.13 Rest of Asia Pacific

10.4.13.1 Rest of Asia Pacific Power Semiconductor Market Estimates and Forecasts, by Material (2020-2032) (USD Billion)

10.4.13.2 Rest of Asia Pacific Power Semiconductor Market Estimates and Forecasts, by Component (2020-2032) (USD Billion)

10.4.13.3 Rest of Asia Pacific Power Semiconductor Market Estimates and Forecasts, by Application (2020-2032) (USD Billion)

10.5 Middle East and Africa

10.5.1 Middle East

10.5.1.1 Trends Analysis

10.5.1.2 Middle East Power Semiconductor Market Estimates and Forecasts, by Country (2020-2032) (USD Billion)

10.5.1.3 Middle East Power Semiconductor Market Estimates and Forecasts, by Material (2020-2032) (USD Billion)  

10.5.1.4 Middle East Power Semiconductor Market Estimates and Forecasts, by Component (2020-2032) (USD Billion)

10.5.1.5 Middle East Power Semiconductor Market Estimates and Forecasts, by Application (2020-2032) (USD Billion)

10.5.1.6 UAE

10.5.1.6.1 UAE Power Semiconductor Market Estimates and Forecasts, by Material (2020-2032) (USD Billion)

10.5.1.6.2 UAE Power Semiconductor Market Estimates and Forecasts, by Component (2020-2032) (USD Billion)

10.5.1.6.3 UAE Power Semiconductor Market Estimates and Forecasts, by Application (2020-2032) (USD Billion)

10.5.1.7 Egypt

10.5.1.7.1 Egypt Power Semiconductor Market Estimates and Forecasts, by Material (2020-2032) (USD Billion)

10.5.1.7.2 Egypt Power Semiconductor Market Estimates and Forecasts, by Component (2020-2032) (USD Billion)

10.5.1.7.3 Egypt Power Semiconductor Market Estimates and Forecasts, by Application (2020-2032) (USD Billion)

10.5.1.8 Saudi Arabia

10.5.1.8.1 Saudi Arabia Power Semiconductor Market Estimates and Forecasts, by Material (2020-2032) (USD Billion)

10.5.1.8.2 Saudi Arabia Power Semiconductor Market Estimates and Forecasts, by Component (2020-2032) (USD Billion)

10.5.1.8.3 Saudi Arabia Power Semiconductor Market Estimates and Forecasts, by Application (2020-2032) (USD Billion)

10.5.1.9 Qatar

10.5.1.9.1 Qatar Power Semiconductor Market Estimates and Forecasts, by Material (2020-2032) (USD Billion)

10.5.1.9.2 Qatar Power Semiconductor Market Estimates and Forecasts, by Component (2020-2032) (USD Billion)

10.5.1.9.3 Qatar Power Semiconductor Market Estimates and Forecasts, by Application (2020-2032) (USD Billion)

10.5.1.10 Rest of Middle East

10.5.1.10.1 Rest of Middle East Power Semiconductor Market Estimates and Forecasts, by Material (2020-2032) (USD Billion)

10.5.1.10.2 Rest of Middle East Power Semiconductor Market Estimates and Forecasts, by Component (2020-2032) (USD Billion)

10.5.1.10.3 Rest of Middle East Power Semiconductor Market Estimates and Forecasts, by Application (2020-2032) (USD Billion)

10.5.2 Africa

10.5.2.1 Trends Analysis

10.5.2.2 Africa Power Semiconductor Market Estimates and Forecasts, by Country (2020-2032) (USD Billion)

10.5.2.3 Africa Power Semiconductor Market Estimates and Forecasts, by Material (2020-2032) (USD Billion)  

10.5.2.4 Africa Power Semiconductor Market Estimates and Forecasts, by Component (2020-2032) (USD Billion)

10.5.2.5 Africa Power Semiconductor Market Estimates and Forecasts, by Application (2020-2032) (USD Billion)

10.5.2.6 South Africa

10.5.2.6.1 South Africa Power Semiconductor Market Estimates and Forecasts, by Material (2020-2032) (USD Billion)

10.5.2.6.2 South Africa Power Semiconductor Market Estimates and Forecasts, by Component (2020-2032) (USD Billion)

10.5.2.6.3 South Africa Power Semiconductor Market Estimates and Forecasts, by Application (2020-2032) (USD Billion)

10.5.2.7 Nigeria

10.5.2.7.1 Nigeria Power Semiconductor Market Estimates and Forecasts, by Material (2020-2032) (USD Billion)

10.5.2.7.2 Nigeria Power Semiconductor Market Estimates and Forecasts, by Component (2020-2032) (USD Billion)

10.5.2.7.3 Nigeria Power Semiconductor Market Estimates and Forecasts, by Application (2020-2032) (USD Billion)

10.5.2.8 Rest of Africa

10.5.2.8.1 Rest of Africa Power Semiconductor Market Estimates and Forecasts, by Material (2020-2032) (USD Billion)

10.5.2.8.2 Rest of Africa Power Semiconductor Market Estimates and Forecasts, by Component (2020-2032) (USD Billion)

10.5.2.8.3 Rest of Africa Power Semiconductor Market Estimates and Forecasts, by Application (2020-2032) (USD Billion)

10.6 Latin America

10.6.1 Trends Analysis

10.6.2 Latin America Power Semiconductor Market Estimates and Forecasts, by Country (2020-2032) (USD Billion)

10.6.3 Latin America Power Semiconductor Market Estimates and Forecasts, by Material (2020-2032) (USD Billion)  

10.6.4 Latin America Power Semiconductor Market Estimates and Forecasts, by Component (2020-2032) (USD Billion)

10.6.5 Latin America Power Semiconductor Market Estimates and Forecasts, by Application (2020-2032) (USD Billion)

10.6.6 Brazil

10.6.6.1 Brazil Power Semiconductor Market Estimates and Forecasts, by Material (2020-2032) (USD Billion)

10.6.6.2 Brazil Power Semiconductor Market Estimates and Forecasts, by Component (2020-2032) (USD Billion)

10.6.6.3 Brazil Power Semiconductor Market Estimates and Forecasts, by Application (2020-2032) (USD Billion)

10.6.7 Argentina

10.6.7.1 Argentina Power Semiconductor Market Estimates and Forecasts, by Material (2020-2032) (USD Billion)

10.6.7.2 Argentina Power Semiconductor Market Estimates and Forecasts, by Component (2020-2032) (USD Billion)

10.6.7.3 Argentina Power Semiconductor Market Estimates and Forecasts, by Application (2020-2032) (USD Billion)

10.6.8 Colombia

10.6.8.1 Colombia Power Semiconductor Market Estimates and Forecasts, by Material (2020-2032) (USD Billion)

10.6.8.2 Colombia Power Semiconductor Market Estimates and Forecasts, by Component (2020-2032) (USD Billion)

10.6.8.3 Colombia Power Semiconductor Market Estimates and Forecasts, by Application (2020-2032) (USD Billion)

10.6.9 Rest of Latin America

10.6.9.1 Rest of Latin America Power Semiconductor Market Estimates and Forecasts, by Material (2020-2032) (USD Billion)

10.6.9.2 Rest of Latin America Power Semiconductor Market Estimates and Forecasts, by Component (2020-2032) (USD Billion)

10.6.9.3 Rest of Latin America Power Semiconductor Market Estimates and Forecasts, by Application (2020-2032) (USD Billion)

11. Company Profiles

11.1 Infineon Technologies

11.1.1 Company Overview

11.1.2 Financial

11.1.3 Products/ Services Offered

11.1.4 SWOT Analysis

11.2 ON Semiconductor

11.2.1 Company Overview

11.2.2 Financial

11.2.3 Products/ Services Offered

11.2.4 SWOT Analysis

11.3 Mitsubishi Electric

11.3.1 Company Overview

11.3.2 Financial

11.3.3 Products/ Services Offered

11.3.4 SWOT Analysis

11.4 Toshiba Corporation

11.4.1 Company Overview

11.4.2 Financial

11.4.3 Products/ Services Offered

11.4.4 SWOT Analysis

11.5 STMicroelectronics

11.5.1 Company Overview

11.5.2 Financial

11.5.3 Products/ Services Offered

11.5.4 SWOT Analysis

11.6 Texas Instruments

11.6.1 Company Overview

11.6.2 Financial

11.6.3 Products/ Services Offered

11.6.4 SWOT Analysis

11.7 Vishay Intertechnology

11.7.1 Company Overview

11.7.2 Financial

11.7.3 Products/ Services Offered

11.7.4 SWOT Analysis

11.8 Fuji Electric

11.8.1 Company Overview

11.8.2 Financial

11.8.3 Products/ Services Offered

11.8.4 SWOT Analysis

11.9 NXP Semiconductors

11.9.1 Company Overview

11.9.2 Financial

11.9.3 Products/ Services Offered

11.9.4 SWOT Analysis

11.10 Renesas Electronics

11.10.1 Company Overview

11.10.2 Financial

11.10.3 Products/ Services Offered

11.10.4 SWOT Analysis

12. Use Cases and Best Practices

13. Conclusion

An accurate research report requires proper strategizing as well as implementation. There are multiple factors involved in the completion of good and accurate research report and selecting the best methodology to compete the research is the toughest part. Since the research reports we provide play a crucial role in any company’s decision-making process, therefore we at SNS Insider always believe that we should choose the best method which gives us results closer to reality. This allows us to reach at a stage wherein we can provide our clients best and accurate investment to output ratio.

Each report that we prepare takes a timeframe of 350-400 business hours for production. Starting from the selection of titles through a couple of in-depth brain storming session to the final QC process before uploading our titles on our website we dedicate around 350 working hours. The titles are selected based on their current market cap and the foreseen CAGR and growth.


The 5 steps process:

Step 1: Secondary Research:

Secondary Research or Desk Research is as the name suggests is a research process wherein, we collect data through the readily available information. In this process we use various paid and unpaid databases which our team has access to and gather data through the same. This includes examining of listed companies’ annual reports, Journals, SEC filling etc. Apart from this our team has access to various associations across the globe across different industries. Lastly, we have exchange relationships with various university as well as individual libraries.

Secondary Research

Step 2: Primary Research

When we talk about primary research, it is a type of study in which the researchers collect relevant data samples directly, rather than relying on previously collected data.  This type of research is focused on gaining content specific facts that can be sued to solve specific problems. Since the collected data is fresh and first hand therefore it makes the study more accurate and genuine.

We at SNS Insider have divided Primary Research into 2 parts.

Part 1 wherein we interview the KOLs of major players as well as the upcoming ones across various geographic regions. This allows us to have their view over the market scenario and acts as an important tool to come closer to the accurate market numbers. As many as 45 paid and unpaid primary interviews are taken from both the demand and supply side of the industry to make sure we land at an accurate judgement and analysis of the market.

This step involves the triangulation of data wherein our team analyses the interview transcripts, online survey responses and observation of on filed participants. The below mentioned chart should give a better understanding of the part 1 of the primary interview.

Primary Research

Part 2: In this part of primary research the data collected via secondary research and the part 1 of the primary research is validated with the interviews from individual consultants and subject matter experts.

Consultants are those set of people who have at least 12 years of experience and expertise within the industry whereas Subject Matter Experts are those with at least 15 years of experience behind their back within the same space. The data with the help of two main processes i.e., FGDs (Focused Group Discussions) and IDs (Individual Discussions). This gives us a 3rd party nonbiased primary view of the market scenario making it a more dependable one while collation of the data pointers.

Step 3: Data Bank Validation

Once all the information is collected via primary and secondary sources, we run that information for data validation. At our intelligence centre our research heads track a lot of information related to the market which includes the quarterly reports, the daily stock prices, and other relevant information. Our data bank server gets updated every fortnight and that is how the information which we collected using our primary and secondary information is revalidated in real time.

Data Bank Validation

Step 4: QA/QC Process

After all the data collection and validation our team does a final level of quality check and quality assurance to get rid of any unwanted or undesired mistakes. This might include but not limited to getting rid of the any typos, duplication of numbers or missing of any important information. The people involved in this process include technical content writers, research heads and graphics people. Once this process is completed the title gets uploader on our platform for our clients to read it.

Step 5: Final QC/QA Process:

This is the last process and comes when the client has ordered the study. In this process a final QA/QC is done before the study is emailed to the client. Since we believe in giving our clients a good experience of our research studies, therefore, to make sure that we do not lack at our end in any way humanly possible we do a final round of quality check and then dispatch the study to the client.

Market Segmentation

By Component

  • Discrete

  • Module

  • Power Integrated Circuits

By Application

  • Automotive

  • Consumer Electronics

  • IT & Telecommunications

  • Military & Aerospace

  • Power

  • Industrial

  • Other

By Material

  • Silicon Carbide

  • GaN Silicon

  • Other

Request for Segment Customization as per your Business Requirement: Segment Customization Request

Regional Coverage:

North America

  • US

  • Canada

  • Mexico

Europe

  • Eastern Europe

    • Poland

    • Romania

    • Hungary

    • Turkey

    • Rest of Eastern Europe

  • Western Europe

    • Germany

    • France

    • UK

    • Italy

    • Spain

    • Netherlands

    • Switzerland

    • Austria

    • Rest of Western Europe

Asia Pacific

  • China

  • India

  • Japan

  • South Korea

  • Vietnam

  • Singapore

  • Australia

  • Rest of Asia Pacific

Middle East & Africa

  • Middle East

    • UAE

    • Egypt

    • Saudi Arabia

    • Qatar

    • Rest of the Middle East

  • Africa

    • Nigeria

    • South Africa

    • Rest of Africa

Latin America

  • Brazil

  • Argentina

  • Colombia

  • Rest of Latin America

Request for Country Level Research Report: Country Level Customization Request

Available Customization

With the given market data, SNS Insider offers customization as per the company’s specific needs. The following customization options are available for the report:

  • Product Analysis

  • Criss-Cross segment analysis (e.g. Product X Application)

  • Product Matrix which gives a detailed comparison of product portfolio of each company

  • Geographic Analysis

  • Additional countries in any of the regions

  • Company Information

  • Detailed analysis and profiling of additional market players (Up to five)


  •            5000 (33% Discount)


  •            8950 (40% Discount)


  •            3050 (23% Discount)

Start a Conversation

Hi! Click one of our member below to chat on Phone