Power Quality Equipment Market Size & Overview:
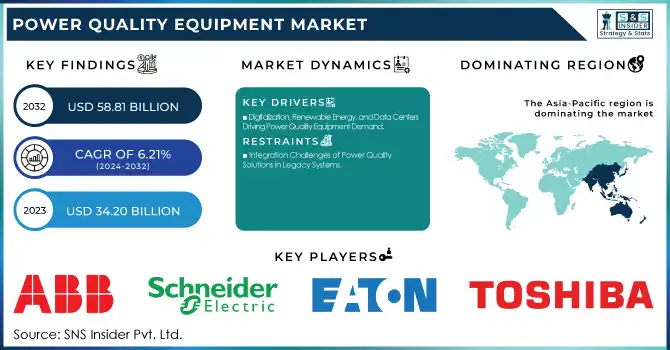
The Power Quality Equipment Market Size was valued at USD 34.20 billion in 2023 and is expected to reach USD 58.81 billion by 2032 and grow at a CAGR of 6.21% over the forecast period 2024-2032. Growing adoption of digital transformation and AI-based monitoring systems for real-time power quality analysis and predictive maintenance drive market growth. Demand is also driven by the growing penetration of renewable energy sources, increasing smart grid activity, and Also, regulatory policies enforced for the power factor correction and harmonic mitigation, and the increasing industrial automation and data center growth is expected to propel the market growth.
To Get more information on Power Quality Equipment Market - Request Free Sample Report
Improved voltage regulation technologies, along with the exigency of reducing energy losses and equipment downtime, drive adoption across industries. R&D and High-End Power Quality Solutions: Emerging Prominence In key sectors such as manufacturing, utilities, and commercial infrastructure, the market also reflects a strong investment in R&D and advanced power-quality solutions.
Power Quality Equipment Market Dynamics
Drivers:
-
Digitalization, Renewable Energy, and Data Centers Driving Power Quality Equipment Demand
This transformation of the power quality equipment market is driven by industrial digitalization, data center expansion, and renewable energy adoption. With the growth of Industry 4.0 and smart manufacturing, the demand for reliable power solutions has significantly increased, especially in high-tech industries such as South Korea’s semiconductor sector, which is set for a USD 451 billion investment over the next ten years. Meanwhile data centers consuming 3% of the global electricity require power monitoring & conditioning equipment to minimize losses and consequently, secure operational continuity. Moreover, the global shift towards renewable energy, including Saudi Arabia’s 27.3 GW solar and wind initiative, has increased the demand for harmonic filtration and the need for voltage regulation to stabilize the grid and integrate variable energy sources. The convergence of industrial automation, robust digital infrastructure, and clean energy is revolutionizing the power quality equipment space.
Restraints:
-
Integration Challenges of Power Quality Solutions in Legacy Systems
Compatibility with legacy infrastructure makes retrofitting power quality solutions into a power grid or industrial set up extremely challenging. News- Older systems are difficult to tailor to modern power quality device and require substantial customization and engineering efforts. This level of complexity results in a higher cost of ownership, and longer time to value. Moreover, the incorporation of distributed energy resources like rooftop solar panels and batteries creates two-way power flows, which are outside what traditional grids were intended to handle, complicating the integration process even further. Utilities must find innovative solutions to seamlessly incorporate these resources while maintaining reliable and efficient grid operations.
Opportunities:
-
Escalating Data Center Power Demand Fuels Growth in Power Quality Solutions
The rapid expansion of data centers, fueled by cloud computing, AI, and IoT, is significantly increasing the demand for power quality equipment to enhance energy efficiency and prevent downtime. Data centers classically ran at 20 megawatts in size, but the latest facilities can now accommodate 1,000 megawatts (1 gigawatt)—the equivalent of powering an entire major U.S. city. American Electric Power (AEP) announced a forecast for 9% annual retail load growth over the next three years, which could potentially facilitate 20 gigawatts of new load growth by 2030. With increasing demands for power, guaranteeing a stable and reliable power supply is essential, fueling investments in power quality solutions to enable around-the-clock operations in this just-in-time networked economy.
Challenges:
-
Impact of Raw Material Price Volatility on the Power Quality Equipment Market
The Power Quality Equipment manufacturers, like every other electronic manufacturers out there, such as semiconductor manufacturers and capacitor manufacturers; are not only facing high volatility in raw material prices due to inflation and supply-demand crisis, but some of them are also being affected by the fluctuating prices of critical components. Additionally, the rising cost of copper and rare earth materials used in transformers and capacitors has put pressure on manufacturers’ profit margins. These price fluctuations not only affect production costs but also lead to higher end-user prices, potentially limiting market adoption. To mitigate these risks, companies are increasingly exploring alternative materials, localized sourcing, and strategic inventory management to maintain cost efficiency and supply chain stability.
Power Quality Equipment Segment Analysis:
By Equipment
In 2023, the Uninterruptible Power Supply (UPS) segment held the largest market share, accounting for approximately 44% of total revenue. UPS systems are pivotal in delivering power stability across a spectrum of applications, including data centers, industrial automation, healthcare and IT infrastructure, which helps explain their dominance. Demand for UPS solutions to prevent outages and data loss has skyrocketed, due to the growing dependence on cloud computing, AI-enabled workloads, and IoT applications. Additionally, increasing concerns regarding power outages and grid instability particularly in developing countries are expected to contribute to UPS adoption. Market growth is likely to continue due to increasing adoption of advanced lithium-ion battery technologies and modular UPS designs, as businesses focus on energy efficiency and continuity.
The Surge Protection Devices (SPD) segment is projected to be the fastest-growing category in the Power Quality Equipment Market from 2024 to 2032. growing concerns regarding electrical surges due to lightning attack, power grid fluctuations, and industrial work activities are few of the factors for this growth. The increasing prevalence of IoT devices, automation, and renewable energy systems makes it imperative for SPDs to protect sensitive electronics and avoid expensive downtime. Further, stringent regulatory requirements focusing on electrical safety and reliability are propelling the market growth. The demand is particularly strong in data centers, manufacturing facilities, and commercial buildings, where uninterrupted power supply is critical.
By Phase
The Three-Phase segment held the largest revenue share of 72% in the Power Quality Equipment Market in 2023, due to the increasing usage of three-phase power quality equipment for use in industrial, commercial, and large-scale infrastructure. Compared to single-Phase systems, Three-Phase systems provide optimal system efficiency, stability and power distribution which makes them inevitable for industries operating heavy equipment, automation systems and high power loads. Installation of renewable energy, data centres and smart grids has also contributed to continued demand for three-Phase. Additionally, government initiatives promoting industrial automation and electrification continue to reinforce the segment’s dominance in the market.
The Single-Phase segment is projected to be the fastest-growing in the Power Quality Equipment Market from 2024 to 2032, owing to growing demand in residential, and small-scale commercial, and telecom applications. As we move toward smart homes, electric vehicle (EV) charging stations, and distributed energy resources, the demand for efficient voltage regulation, power backup, and surge protection in single-Phase systems is expanding significantly. Moreover, increasing rural electrification programs and rise of IoT-enabled devices will drive the adoption of single-Phase power solutions. New innovations in compact UPS systems, voltage stabilizers, and surge protection devices are further driving market growth in this segment and development.
By End Use
The Industrial & Manufacturing segment held the largest revenue share of approximately 46% in 2023, due to increasing adoption of automation, robotics, and Industry 4.0 technologies. As many aspects of the sector are digitally powered, sensitive electronic and high-power equipment and continuous production lines, the requirement of voltage regulation, harmonic filtering, and back-up power solutions has increased to avoid high downtime and equipment failures. Additionally, the increasing integration of renewable energy sources in industrial operations has created demand for advanced power conditioning equipment to maintain grid stability. As manufacturing hubs expand in Asia-Pacific and North America, investments in power quality solutions are expected to grow significantly.
The commercial segment is projected to be the fastest-growing end-use sector in the Power Quality Equipment Market from 2024 to 2032, driven to growing power requirements from data centers, offices, healthcare units, & retail establishments. With the boom towards cloud, AI and IoT, digital infrastructure has exploded and so have the demand for uninterruptible power supply (UPS) systems, voltage regulators and surge protection devices to ensure continuous supply of power. The increasing emphasis on energy efficiency and sustainability in commercial buildings is also fueling investments in power conditioning solution. With urbanization and commercial development accelerating globally, the segment is expected to witness substantial adoption of power quality equipment.
Power Quality Equipment Market Regional Analysis:
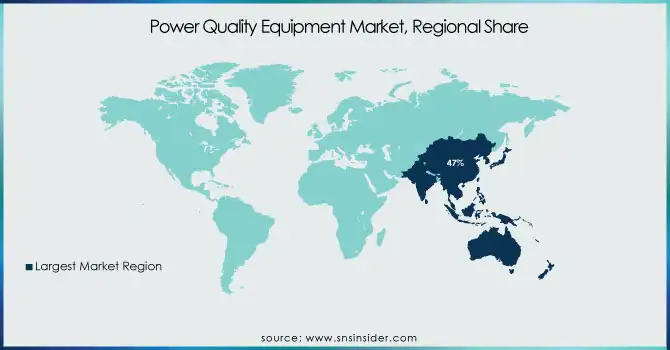
The Asia-Pacific region dominated the Power Quality Equipment Market in 2023, accounting for 47% of total revenue, driven by rapid industrialization, urbanization, and increasing electricity demand. Countries like China, India, and Japan are leading due to heavy investments in industrial automation, data centers, and renewable energy integration, which require advanced power quality solutions. China’s expanding manufacturing sector, India's smart grid initiatives, and Japan’s focus on energy efficiency and backup power solutions have significantly boosted demand. Additionally, the region's strong investments in commercial infrastructure and high-tech industries are further propelling the market. With continued economic growth and increasing electrification, Asia-Pacific is expected to maintain its leadership in power quality equipment adoption.
North America is the fastest-growing region in the Power Quality Equipment Market due to the increasing demand for data centers and the integration of renewable energy along with industrial automation. The US increasing demand investments in cloud computing, AI, and IoT which in turn impacts growth of UPS, voltage regulators, and surge protection devices. More grid modernization projects and an expansion of Canada’s renewable energy infrastructure are underway to drive demand even further. The proliferation of electric vehicles (EVs) and smart grids throughout the region has also amplified the demand for advanced power quality solutions. With technological advancements and strong government initiatives, North America is set to witness significant market expansion over the forecast period.
Get Customized Report as per Your Business Requirement - Enquiry Now
Key Players
Some of the major key Players in Power Quality Equipment Market along with their product:
-
ABB Ltd. (Switzerland) (UPS, Voltage Regulators, Surge Protection Devices)
-
General Electric Company (US) (Power Quality Meters, Voltage Regulators, UPS)
-
Schneider Electric (France) (Harmonic Filters, UPS, Surge Protection Devices)
-
Siemens AG (Germany) (Power Quality Meters, Voltage Regulators, UPS)
-
Emerson Electric Company (US) (UPS, Surge Protection Devices, Harmonic Filters)
-
Eaton Corporation Plc (Ireland) (UPS, Power Quality Meters, Surge Protection Devices)
-
Active Power Inc. (US) (UPS, Voltage Regulators)
-
MTE Corporation (US) (Harmonic Filters, Power Quality Meters)
-
Smiths Group plc. (UK) (Surge Protection Devices, Power Quality Meters)
-
Toshiba Corporation (Japan) (UPS, Voltage Regulators)
-
Honeywell International, Inc. (US) (Surge Protection Devices, Power Quality Meters)
-
Leviton Manufacturing Co., Inc. (US) (Surge Protection Devices, Voltage Regulators)
-
Legrand (France) (Surge Protection Devices, Harmonic Filters)
-
Piller Power Systems (Germany) (UPS, Voltage Regulators)
-
Vertiv Group Corp. (US) (UPS, Power Quality Meters, Harmonic Filters
List of Suppliers who provide raw material and component for Power Quality Equipment Market:
-
Electris
-
thyssenkrupp Materials NA
-
IRG Power Systems
-
Taiyo Yuden Co., Ltd.
-
Supreme Components International Pte. Ltd.
-
Megger Group Limited
Recent Development
-
Jan 10, 2025 – Emerson released the AVENTICS™ DS1 Dewpoint Sensor, an advanced power quality equipment that monitors dew point, temperature, humidity and air quality in real time. It prevents any loss of equipment due to moisture damage for a more reliable process and less maintenance downtime.
-
March 18, 2024 – GE Vernova’s Power Conversion business won a contract with ST Engineering Marine Limited to provide Integrated Full Electric Propulsion (IFEP) systems for six new Multi-Role Combat Vessels (MRCVs) for the Republic of Singapore Navy. As part of the contract, they will provide state-of-the-art power quality equipment to optimize power distribution and management within the fleet. The systems will be delivered over the next 10 years.
| Report Attributes | Details |
|---|---|
| Market Size in 2023 | USD 34.20 Billion |
| Market Size by 2032 | USD 58.81 Billion |
| CAGR | CAGR of 6.21 % From 2024 to 2032 |
| Base Year | 2023 |
| Forecast Period | 2024-2032 |
| Historical Data | 2020-2022 |
| Report Scope & Coverage | Market Size, Segments Analysis, Competitive Landscape, Regional Analysis, DROC & SWOT Analysis, Forecast Outlook |
| Key Segments | • By Equipment (Power Quality Meters, Surge Protection Devices, Harmonic Filters, Voltage Regulators, Uninterruptable Power Supply (UPS), Others) • By Phase (Single-Phase, Three Phase) • By End Use (Residential, Commercial, Industrial & Manufacturing, Utilities, Transportation) |
| Regional Analysis/Coverage | North America (US, Canada, Mexico), Europe (Eastern Europe [Poland, Romania, Hungary, Turkey, Rest of Eastern Europe] Western Europe] Germany, France, UK, Italy, Spain, Netherlands, Switzerland, Austria, Rest of Western Europe]), Asia Pacific (China, India, Japan, South Korea, Vietnam, Singapore, Australia, Rest of Asia Pacific), Middle East & Africa (Middle East [UAE, Egypt, Saudi Arabia, Qatar, Rest of Middle East], Africa [Nigeria, South Africa, Rest of Africa], Latin America (Brazil, Argentina, Colombia, Rest of Latin America) |
| Company Profiles | ABB Ltd. (Switzerland), General Electric Company (US), Schneider Electric (France), Siemens AG (Germany), Emerson Electric Company (US), Eaton Corporation Plc (Ireland), Active Power Inc. (US), MTE Corporation (US), Smiths Group plc. (UK), Toshiba Corporation (Japan), Honeywell International, Inc. (US), Leviton Manufacturing Co., Inc. (US), Legrand (France), Piller Power Systems (Germany), Vertiv Group Corp. (US). |
