image

Power over Ethernet Devices (PoE) Market Size & Overview:

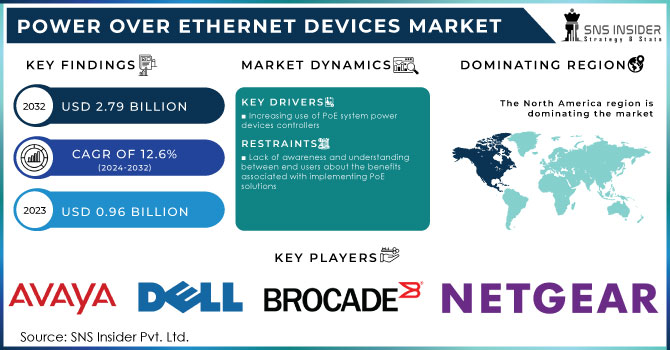
The Power Over Ethernet Devices Market was valued at USD 1.89 billion in 2023 and is expected to reach USD 10.52 billion by 2032, growing at a CAGR of 21.06% over the forecast period 2024-2032. The rapid adoption of Power over Ethernet devices for higher power applications is aiding the growth of advanced PoE standards, including 802.3bt. Demand for PoE solutions is robust in end-use verticals such as smart buildings, industrial automation, and telecommunications. Higher PoE port density in the application switches and injectors will facilitate increased scalability by adding more devices to a network. Furthermore, the rising IoT and smart infrastructure are driving device connectivity growth which makes PoE applications broader including in security, lighting, and wireless access systems.

Power Over Ethernet Devices Market Revenue Analysis

Get more information on Power over Ethernet Devices (PoE) Market - Request Sample Report

Market Dynamics

Key Drivers: 

  • Power Over Ethernet Devices Market Driven by IoT Growth Smart Infrastructure and Energy-Efficient Networking Solutions

The PoE devices market thrives on the growing adoption of efficient and cost-optimized approaches for network infrastructure installations. Power over Ethernet (PoE) allows both power and data to be carried on an Ethernet cable, so fewer wires and power sources are needed. This technology is important for enterprise, industrial, and home applications like network cameras, VoIP phones, wireless access points, and any other smart devices. The rise of the Internet of Things (IoT) and the rapid adoption of connected devices and smart buildings are driving the need for Power over Ethernet (PoE). Moreover, increasing demand for scalable, energy-efficient, and maintenance-friendly solutions in verticals such as security telecommunications, and lighting, is fuelling the growth of the market.

Restrain:

  • Power Over Ethernet Faces Challenges in Distance Limitations High-Power Transmission and Legacy System Integration

One of the major challenges is power delivery distance. This is where the distance of PoE is limited while transmitting power. In the case of higher power PoE usage like PoE++ (802.3bt), the transmission distance capable of delivering power is not that long, maximum of 100 meters (or less). While this limitation may not be an issue in a small office or close to the rack, in a larger deployment it will hinder PoE adoption or require more infrastructure, such as repeaters or mid-span devices, adding cost to the installation. Also, the use of PoE with current non-PoE network apparatuses and legacy systems may need costly improvements or adjustments.

Opportunity:

  • Power Over Ethernet Poised for Growth with High-Power Applications Smart Cities and IoT Expansion

As the demand for high-power applications increases, the opportunity for the PoE market is high. 802.3bt (PoE++) enables higher power to be delivered to devices like HD cameras, LED lighting, and premium wireless APs. The increasing adoption of smart cities, smart homes, and energy-efficient buildings is projected to offer numerous growth opportunities for PoE technologies in the lighting, automation, and surveillance transfer market. With the growth of the IoT ecosystem and enterprises' continued migration to high-performance networks, PoE will support day-to-day operations for simplified operations, lowered costs, and enhanced device connectivity, becoming an essential feature of smart infrastructure.

Challenges:

  • Power Over Ethernet Faces Challenges in Standardization Compatibility Thermal Management and Future-Proofing Technologies

The other issue concerns standardization and compatibility between different PoE devices. Though the PoE standards (802.3af, 802.3at, 802.3bt) are almost generally adopted, there are numerous devices where not all devices might be PoE compatible and this can still cause interoperability issues. In addition, manufacturers are required to provide PoE systems that are robust and reliable in harsh environments. Then some high-power devices have a significant heat of their own, such as high-definition cameras and advanced access points, so PoE systems must be able to accommodate higher thermal loads while maintaining performance and longevity. The world of standards is also a moving target that may lead to uncertainty in terms of being able to use it in the future.

Segment Analysis

By Type

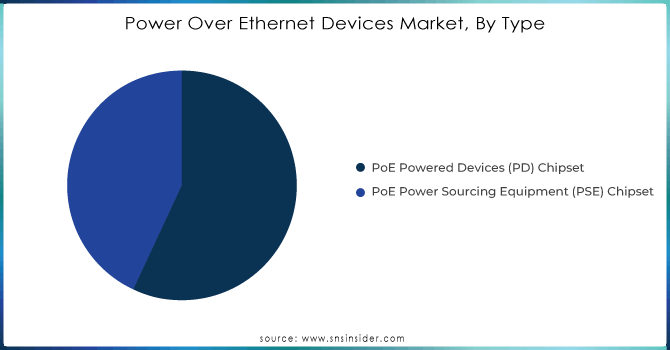
Power Sourcing Equipment (PSE) Controllers and ICs held the largest share of the market with 55.1% in 2023. Power Controllers are a fundamental tool to regulate power allocation to powered devices (PDs), are energy efficient, and operate under any network environment. The growing requirement of dependable and high-performance PoE systems for several applications like, security cameras, VoIP phones, and wireless access points has pushed the demand for PSE controllers.

Powered Device (PD) Controllers and ICs are projected to have the highest CAGR from 2024 to 2032. The surge in high-power PoE applications, including high-definition cameras, LED lighting, and advanced wireless devices, primarily drives GTM's growth. Due to the higher power delivery requirements of these devices, demand for PD controllers, which control power reception and regulation in PoE devices, will increase considerably, enabling sustained growth of the PoE ecosystem.

By Standard

The 802.3at standard commanded the largest share of the total PoE market in 2023, with a 48.4% share. The most common standard, this provides up to 25.5 watts of power over Ethernet cables and is used for low- to mid-power applications like VoIP phones, IP cameras, and wireless access points. Due to widespread enterprise usage of 802.3at since its inception, especially in surveillance and communication systems, this has been the master PoE from the beginning.

The 802.3bt standards are projected to grow at the fastest rate (CAGR) from 2024 to 2032. The 802.3bt standard defines power levels up to 60 watts (PoE++) and capabilities to 100 watts (PoE+++) to support high-power devices such as HD cameras, LED lighting, and IoT-connected wireless access points. However, as industries accelerate towards higher-power applications in IoT, smart buildings, and automation, we expect 802.3bt adoption to grow quickly. The growth of intelligent infrastructure and high-performing network devices will use 802.3bt to grow its footprint and be the future PoE key enabler.

By Device

Ethernet Switches and Injectors led the PoE market, accounting for 27.8% in 2023. These devices are essential in PoE network management as they transmit both power and data to connected devices like security cameras, access points, and VoIP phones. The availability of Ethernet switches and injectors is critical for enabling scalable, low-cost network infrastructures, and their market leadership across commercial, industrial, and residential segments reflects their broad adoption. Ethernet switches and injectors have remained crucial elements in the PoE ecosystem as the need for high-speed, reliable networking continues to grow.

Proximity Sensors are expected to experience the fastest growth in terms of CAGR from 2024 to 2032. The increasing role of IoT technologies in diverse industries such as manufacturing, smart buildings, automation, smart cities, and home automation is expected to stimulate market growth by inducing intelligent sensing in a wide range of applications, thereby driving demand for proximity sensors. The noncontact-kind capability of proximity sensors to detect an object or individual nearby provides an additional inspection approach by boosting operational productivity whilst enhancing safety as more smart devices and automation systems become embedded within vehicles. As per this, proximity sensors will become one of the most growing segments of the PoE market.

By End Use

In 2023, the industrial sector accounted for the largest share of 43.9% of the market. The significant uptake of PoE technology in this sector is driven by the proliferation of IoT devices, automation systems, and networked sensors in harsh environments, where reliable power delivery and good efficiency are needed. PoE is utilized in industrial applications such as manufacturing, security surveillance, and process automation to simplify installations, minimize cabling, and guarantee the effective functioning of powered devices. Its steadfast holding in the industrial sector has been driven in part by the consistent ramp-up of Power over Ethernet (PoE) in support of industrial IoT (IIoT) deployments.

The commercial segment is anticipated to grow with the fastest CAGR during the forecast period from 2024-2032. The commercial division comprised of offices, retail, and hospitality buildings is gradually going in for PoE with devices like VoIP phones, security cameras,  and wireless access points. With the progress of smart building technology and the increasing need for energy-efficient solutions in commercial settings, PoE is providing a space for easy installation, low energy consumption, and improved connectivity. PoE will grow strongly in this sector with the expansion of smart cities and the deployment of smart office solutions.

Power-Over-Ethernet-Devices-Market-By-Type

Get Customized Report as per your Business Requirement - Request For Customized Report

Regional Analysis

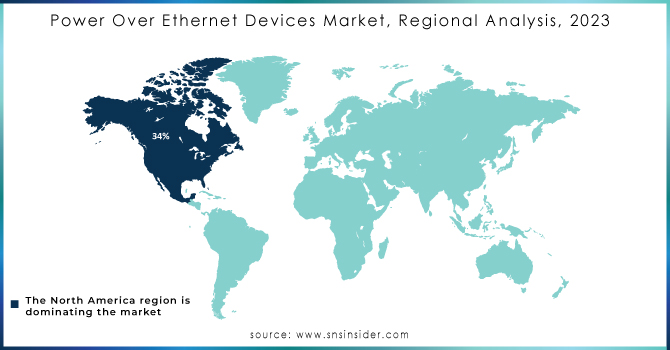
The Power Over Ethernet (PoE) market was led by North America in 2023 with a 34.6% share. The high adoption, smart infrastructure, and demand for PoE solutions, which penetrate industrial, commercial, and residential sectors, in the region holding the greatest share, can be owing to the dominance this region has. North America leverages PoE infrastructure across various industries including telecommunications, security, and healthcare for delivering both power and network with ease. Take the example of IP surveillance cameras widely deployed at office buildings, smart hospitals, and warehouses in the United States and Canada, PoE is pretty much a must. The emphasis on energy efficiency, smart buildings, and significant IoT device deployment in the region have stimulated the adoption of PoE.

The Asia Pacific region is expected to experience the fastest growth in terms of CAGR from 2024 to 2032. The rapid pace of urbanization, infrastructure development, and the need for smart technologies that provide solutions for the old problems of the region in a sustainable manner are key reasons driving this growth. Smart cities, IoT applications, and commercial spaces provide ample opportunities for PoE deployment, driving its effective adoption across certain countries, including China, India, and Japan. As an example, in China, PoE has been used in some smart city-related projects, such as smart street lighting, surveillance systems, etc. For instance, smart offices, as well as industrial automation, require power-over-ethernet (PoE) and India is witnessing an increased adoption of PoE in applications such as these, thus driving the power-over-ethernet market in India. Connected devices in rapidly growing sectors including manufacturing and retail in India are expected to benefit from the adoption of PoE, which delivers data and power over a single cable.

Power-Over-Ethernet-Devices-Market-Regional-Analysis-2023

Key players

Some of the major players in the Power Over Ethernet Devices Market are:

  • Cisco Systems (Catalyst 9300 Series, Aironet 4800 Series)

  • Ubiquiti Networks (UniFi Switch, UniFi AP)

  • TP-Link (TL-SG1008PE, EAP225)

  • NETGEAR (GS110TP, WAC510)

  • MikroTik (CSS610-8P-2S+IN, hAP ac³)

  • Juniper Networks (EX4300, EX3400)

  • Arista Networks (7100X Series, 720XP Series)

  • Huawei (S5720 Series, S5700 Series)

  • D-Link (DGS-1100-10MP, DAP-2610)

  • Belkin (F5U305, F1DN102E)

  • Allied Telesis (AT-AR2050V, AT-IE200)

  • CommScope (FlexWave Prism, Unipoint 1000 Series)

  • Trendnet (TPE-TG80g, TEW-840APBO)

  • Zyxel (GS1900-10HP, NWA1123-AC)

  • L-com (POE-UPS1000, POE-1000T)

Recent Trends

  • In February 2024, Ubiquiti launched the Ultra Cloud Gateway and Ultra PoE Switch, designed for unified network management with enhanced performance and scalability.

  • In April 2024, NETGEAR enhanced its GS305PP 5-Port PoE+ Gigabit Switch, now offering four PoE ports with an 83W power budget for efficient device management.

Power Over Ethernet Devices Market Report Scope:

Report Attributes Details
Market Size in 2023 USD 1.89 Billion
Market Size by 2032 USD 10.52 Billion
CAGR CAGR of 21.06% From 2024 to 2032
Base Year 2023
Forecast Period 2024-2032
Historical Data 2020-2022
Report Scope & Coverage Market Size, Segments Analysis, Competitive  Landscape, Regional Analysis, DROC & SWOT Analysis, Forecast Outlook
Key Segments • By Type (Power Sourcing Equipment Controllers and ICs, Powered Device Controllers and ICs)
• By Standard (802.3af standard, 802.3at standard, 802.3bt standard)
• By Device (Network Cameras, VoIP Phone, Ethernet Switch & Injector, Wireless Radio Access Point, Proximity Sensor, LED Lighting)
• By End Use (Commercial, Industrial, Residential)
Regional Analysis/Coverage North America (US, Canada, Mexico), Europe (Eastern Europe [Poland, Romania, Hungary, Turkey, Rest of Eastern Europe] Western Europe] Germany, France, UK, Italy, Spain, Netherlands, Switzerland, Austria, Rest of Western Europe]), Asia Pacific (China, India, Japan, South Korea, Vietnam, Singapore, Australia, Rest of Asia Pacific), Middle East & Africa (Middle East [UAE, Egypt, Saudi Arabia, Qatar, Rest of Middle East], Africa [Nigeria, South Africa, Rest of Africa], Latin America (Brazil, Argentina, Colombia, Rest of Latin America)
Company Profiles Cisco Systems, Ubiquiti Networks, TP-Link, NETGEAR, MikroTik, Juniper Networks, Arista Networks, Huawei, D-Link, Belkin, Allied Telesis, CommScope, Trendnet, Zyxel, L-com.

Frequently Asked Questions

Ans: The Power Over Ethernet Devices Market is expected to grow at a CAGR of 21.06% during 2024-2032.

Ans: Power Over Ethernet Devices Market size was USD 1.89 billion in 2023 and is expected to Reach USD 10.52 billion by 2032.

Ans: The major growth factor of the Power Over Ethernet Devices Market is the increasing adoption of IoT, smart building technologies, and high-power networked devices requiring efficient power and data transmission over a single cable.

Ans: The Power Sourcing Equipment Controllers and ICs segment dominated the Power Over Ethernet Devices Market in 2023.

Ans: North America dominated the Power Over Ethernet Devices Market in 2023.

Table of Content

1. Introduction

1.1 Market Definition

1.2 Scope (Inclusion and Exclusions)

1.3 Research Assumptions

2. Executive Summary

2.1 Market Overview

2.2 Regional Synopsis

2.3 Competitive Summary

3. Research Methodology

3.1 Top-Down Approach

3.2 Bottom-up Approach

3.3. Data Validation

3.4 Primary Interviews

4. Market Dynamics Impact Analysis

4.1 Market Driving Factors Analysis

4.1.1 Drivers

4.1.2 Restraints

4.1.3 Opportunity

4.1.4 Challenges

4.2 PESTLE Analysis

4.3 Porter’s Five Forces Model

5. Statistical Insights and Trends Reporting

      5.1 PoE Standard Adoption Rate

      5.2 PoE Port Density

      5.3 Device Connectivity Growth

6. Competitive Landscape

6.1 List of Major Companies, By Region

6.2 Market Share Analysis, By Region

6.3 Product Benchmarking

6.3.1 Product specifications and features

6.3.2 Pricing

6.4 Strategic Initiatives

6.4.1 Marketing and promotional activities

6.4.2 Distribution and Supply Chain Strategies

6.4.3 Expansion plans and new product launches

6.4.4 Strategic partnerships and collaborations

6.5 Technological Advancements

6.6 Market Positioning and Branding

7. Power Over Ethernet Devices Market Segmentation, By Type

7.1 Chapter Overview

7.2 Power Sourcing Equipment Controllers and ICs

7.2.1 Power Sourcing Equipment Controllers and ICs Market Trends Analysis (2020-2032)

7.2.2 Power Sourcing Equipment Controllers and ICs Market Size Estimates and Forecasts to 2032 (USD Billion)

7.3 Powered Device Controllers and ICs

7.3.1 Powered Device Controllers and ICs Market Trends Analysis (2020-2032)

7.3.2 Powered Device Controllers and ICs Market Size Estimates and Forecasts to 2032 (USD Billion)

8. Power Over Ethernet Devices Market Segmentation, By Standard

8.1 Chapter Overview

8.2 802.3af standard

8.2.1 802.3af Standard Market Trends Analysis (2020-2032)

8.2. 802.3af Standard Market Size Estimates and Forecasts to 2032 (USD Billion)

8.3 802.3at Standard

8.3.1 802.3at Standard Market Trends Analysis (2020-2032)

8.3.2 802.3at Standard Market Size Estimates and Forecasts to 2032 (USD Billion)

8.4 802.3bt standard

8.4.1 802.3bt Standard Market Trends Analysis (2020-2032)

8.4.2 802.3bt Standard Market Size Estimates and Forecasts to 2032 (USD Billion)

9. Power Over Ethernet Devices Market Segmentation, By Device

9.1 Chapter Overview

9.2 Network Cameras

9.2.1 Network Cameras Market Trends Analysis (2020-2032)

9.2. Network Cameras Market Size Estimates and Forecasts to 2032 (USD Billion)

9.3 VoIP Phone

9.3.1 VoIP Phone Market Trends Analysis (2020-2032)

9.3.2 VoIP Phone Market Size Estimates and Forecasts to 2032 (USD Billion)

9.4 Ethernet Switch & Injector

9.4.1 Ethernet Switch & Injector Market Trends Analysis (2020-2032)

9.4.2 Ethernet Switch & Injector Market Size Estimates and Forecasts to 2032 (USD Billion)

9.5 Wireless Radio Access Point

9.5.1 Wireless Radio Access Point Market Trends Analysis (2020-2032)

9.5.2 Wireless Radio Access Point Market Size Estimates and Forecasts to 2032 (USD Billion)

9.6 Proximity Sensor

9.6.1 Proximity Sensor Market Trends Analysis (2020-2032)

9.6.2 Proximity Sensor Market Size Estimates and Forecasts to 2032 (USD Billion)

9.7 LED Lighting

9.7.1 LED Lighting Market Trends Analysis (2020-2032)

9.7.2 LED Lighting Market Size Estimates and Forecasts to 2032 (USD Billion)

10. Power Over Ethernet Devices Market Segmentation, By End Use

10.1 Chapter Overview

10.2 Commercial

10.2.1 Commercial Market Trends Analysis (2020-2032)

10.2.2 Commercial Market Size Estimates and Forecasts to 2032 (USD Billion)

10.3 Industrial

10.3.1 Industrial Market Trends Analysis (2020-2032)

10.3.2 Industrial Market Size Estimates and Forecasts to 2032 (USD Billion)

10.4 Residential

10.4.1 Residential Market Trends Analysis (2020-2032)

10.4.2 Residential Market Size Estimates and Forecasts to 2032 (USD Billion)

11. Regional Analysis

11.1 Chapter Overview

11.2 North America

11.2.1 Trends Analysis

11.2.2 North America Power Over Ethernet Devices Market Estimates and Forecasts, by Country (2020-2032) (USD Billion)

11.2.3 North America Power Over Ethernet Devices Market Estimates and Forecasts, By Type (2020-2032) (USD Billion) 

11.2.4 North America Power Over Ethernet Devices Market Estimates and Forecasts, By Standard (2020-2032) (USD Billion)

11.2.5 North America Power Over Ethernet Devices Market Estimates and Forecasts, By Device (2020-2032) (USD Billion)

11.2.6 North America Power Over Ethernet Devices Market Estimates and Forecasts, By End Use (2020-2032) (USD Billion)

11.2.7 USA

11.2.7.1 USA Power Over Ethernet Devices Market Estimates and Forecasts, By Type (2020-2032) (USD Billion)

11.2.7.2 USA Power Over Ethernet Devices Market Estimates and Forecasts, By Standard (2020-2032) (USD Billion)

11.2.7.3 USA Power Over Ethernet Devices Market Estimates and Forecasts, By Device (2020-2032) (USD Billion)

11.2.7.4 USA Power Over Ethernet Devices Market Estimates and Forecasts, By End Use (2020-2032) (USD Billion)

11.2.8 Canada

11.2.8.1 Canada Power Over Ethernet Devices Market Estimates and Forecasts, By Type (2020-2032) (USD Billion)

11.2.8.2 Canada Power Over Ethernet Devices Market Estimates and Forecasts, By Standard (2020-2032) (USD Billion)

11.2.8.3 Canada Power Over Ethernet Devices Market Estimates and Forecasts, By Device (2020-2032) (USD Billion)

11.2.8.4 Canada Power Over Ethernet Devices Market Estimates and Forecasts, By End Use (2020-2032) (USD Billion)

11.2.9 Mexico

11.2.9.1 Mexico Power Over Ethernet Devices Market Estimates and Forecasts, By Type (2020-2032) (USD Billion)

11.2.9.2 Mexico Power Over Ethernet Devices Market Estimates and Forecasts, By Standard (2020-2032) (USD Billion)

11.2.9.3 Mexico Power Over Ethernet Devices Market Estimates and Forecasts, By Device (2020-2032) (USD Billion)

11.2.9.4 Mexico Power Over Ethernet Devices Market Estimates and Forecasts, By End Use (2020-2032) (USD Billion)

11.3 Europe

11.3.1 Eastern Europe

11.3.1.1 Trends Analysis

11.3.1.2 Eastern Europe Power Over Ethernet Devices Market Estimates and Forecasts, by Country (2020-2032) (USD Billion)

11.3.1.3 Eastern Europe Power Over Ethernet Devices Market Estimates and Forecasts, By Type (2020-2032) (USD Billion) 

11.3.1.4 Eastern Europe Power Over Ethernet Devices Market Estimates and Forecasts, By Standard (2020-2032) (USD Billion)

11.3.1.5 Eastern Europe Power Over Ethernet Devices Market Estimates and Forecasts, By Device (2020-2032) (USD Billion)

11.3.1.6 Eastern Europe Power Over Ethernet Devices Market Estimates and Forecasts, By End Use (2020-2032) (USD Billion)

11.3.1.7 Poland

11.3.1.7.1 Poland Power Over Ethernet Devices Market Estimates and Forecasts, By Type (2020-2032) (USD Billion)

11.3.1.7.2 Poland Power Over Ethernet Devices Market Estimates and Forecasts, By Standard (2020-2032) (USD Billion)

11.3.1.7.3 Poland Power Over Ethernet Devices Market Estimates and Forecasts, By Device (2020-2032) (USD Billion)

11.3.1.7.4 Poland Power Over Ethernet Devices Market Estimates and Forecasts, By End Use (2020-2032) (USD Billion)

11.3.1.8 Romania

11.3.1.8.1 Romania Power Over Ethernet Devices Market Estimates and Forecasts, By Type (2020-2032) (USD Billion)

11.3.1.8.2 Romania Power Over Ethernet Devices Market Estimates and Forecasts, By Standard (2020-2032) (USD Billion)

11.3.1.8.3 Romania Power Over Ethernet Devices Market Estimates and Forecasts, By Device (2020-2032) (USD Billion)

11.3.1.8.4 Romania Power Over Ethernet Devices Market Estimates and Forecasts, By End Use (2020-2032) (USD Billion)

11.3.1.9 Hungary

11.3.1.9.1 Hungary Power Over Ethernet Devices Market Estimates and Forecasts, By Type (2020-2032) (USD Billion)

11.3.1.9.2 Hungary Power Over Ethernet Devices Market Estimates and Forecasts, By Standard (2020-2032) (USD Billion)

11.3.1.9.3 Hungary Power Over Ethernet Devices Market Estimates and Forecasts, By Device (2020-2032) (USD Billion)

11.3.1.9.4 Hungary Power Over Ethernet Devices Market Estimates and Forecasts, By End Use (2020-2032) (USD Billion)

11.3.1.10 turkey

11.3.1.10.1 Turkey Power Over Ethernet Devices Market Estimates and Forecasts, By Type (2020-2032) (USD Billion)

11.3.1.10.2 Turkey Power Over Ethernet Devices Market Estimates and Forecasts, By Standard (2020-2032) (USD Billion)

11.3.1.10.3 Turkey Power Over Ethernet Devices Market Estimates and Forecasts, By Device (2020-2032) (USD Billion)

11.3.1.10.4 Turkey Power Over Ethernet Devices Market Estimates and Forecasts, By End Use (2020-2032) (USD Billion)

11.3.1.11 Rest of Eastern Europe

11.3.1.11.1 Rest of Eastern Europe Power Over Ethernet Devices Market Estimates and Forecasts, By Type (2020-2032) (USD Billion)

11.3.1.11.2 Rest of Eastern Europe Power Over Ethernet Devices Market Estimates and Forecasts, By Standard (2020-2032) (USD Billion)

11.3.1.11.3 Rest of Eastern Europe Power Over Ethernet Devices Market Estimates and Forecasts, By Device (2020-2032) (USD Billion)

11.3.1.11.4 Rest of Eastern Europe Power Over Ethernet Devices Market Estimates and Forecasts, By End Use (2020-2032) (USD Billion)

11.3.2 Western Europe

11.3.2.1 Trends Analysis

11.3.2.2 Western Europe Power Over Ethernet Devices Market Estimates and Forecasts, by Country (2020-2032) (USD Billion)

11.3.2.3 Western Europe Power Over Ethernet Devices Market Estimates and Forecasts, By Type (2020-2032) (USD Billion) 

11.3.2.4 Western Europe Power Over Ethernet Devices Market Estimates and Forecasts, By Standard (2020-2032) (USD Billion)

11.3.2.5 Western Europe Power Over Ethernet Devices Market Estimates and Forecasts, By Device (2020-2032) (USD Billion)

11.3.2.6 Western Europe Power Over Ethernet Devices Market Estimates and Forecasts, By End Use (2020-2032) (USD Billion)

11.3.2.7 Germany

11.3.2.7.1 Germany Power Over Ethernet Devices Market Estimates and Forecasts, By Type (2020-2032) (USD Billion)

11.3.2.7.2 Germany Power Over Ethernet Devices Market Estimates and Forecasts, By Standard (2020-2032) (USD Billion)

11.3.2.7.3 Germany Power Over Ethernet Devices Market Estimates and Forecasts, By Device (2020-2032) (USD Billion)

11.3.2.7.4 Germany Power Over Ethernet Devices Market Estimates and Forecasts, By End Use (2020-2032) (USD Billion)

11.3.2.8 France

11.3.2.8.1 France Power Over Ethernet Devices Market Estimates and Forecasts, By Type (2020-2032) (USD Billion)

11.3.2.8.2 France Power Over Ethernet Devices Market Estimates and Forecasts, By Standard (2020-2032) (USD Billion)

11.3.2.8.3 France Power Over Ethernet Devices Market Estimates and Forecasts, By Device (2020-2032) (USD Billion)

11.3.2.8.4 France Power Over Ethernet Devices Market Estimates and Forecasts, By End Use (2020-2032) (USD Billion)

11.3.2.9 UK

11.3.2.9.1 UK Power Over Ethernet Devices Market Estimates and Forecasts, By Type (2020-2032) (USD Billion)

11.3.2.9.2 UK Power Over Ethernet Devices Market Estimates and Forecasts, By Standard (2020-2032) (USD Billion)

11.3.2.9.3 UK Power Over Ethernet Devices Market Estimates and Forecasts, By Device (2020-2032) (USD Billion)

11.3.2.9.4 UK Power Over Ethernet Devices Market Estimates and Forecasts, By End Use (2020-2032) (USD Billion)

11.3.2.10 Italy

11.3.2.10.1 Italy Power Over Ethernet Devices Market Estimates and Forecasts, By Type (2020-2032) (USD Billion)

11.3.2.10.2 Italy Power Over Ethernet Devices Market Estimates and Forecasts, By Standard (2020-2032) (USD Billion)

11.3.2.10.3 Italy Power Over Ethernet Devices Market Estimates and Forecasts, By Device (2020-2032) (USD Billion)

11.3.2.10.4 Italy Power Over Ethernet Devices Market Estimates and Forecasts, By End Use (2020-2032) (USD Billion)

11.3.2.11 Spain

11.3.2.11.1 Spain Power Over Ethernet Devices Market Estimates and Forecasts, By Type (2020-2032) (USD Billion)

11.3.2.11.2 Spain Power Over Ethernet Devices Market Estimates and Forecasts, By Standard (2020-2032) (USD Billion)

11.3.2.11.3 Spain Power Over Ethernet Devices Market Estimates and Forecasts, By Device (2020-2032) (USD Billion)

11.3.2.11.4 Spain Power Over Ethernet Devices Market Estimates and Forecasts, By End Use (2020-2032) (USD Billion)

11.3.2.12 Netherlands

11.3.2.12.1 Netherlands Power Over Ethernet Devices Market Estimates and Forecasts, By Type (2020-2032) (USD Billion)

11.3.2.12.2 Netherlands Power Over Ethernet Devices Market Estimates and Forecasts, By Standard (2020-2032) (USD Billion)

11.3.2.12.3 Netherlands Power Over Ethernet Devices Market Estimates and Forecasts, By Device (2020-2032) (USD Billion)

11.3.2.12.4 Netherlands Power Over Ethernet Devices Market Estimates and Forecasts, By End Use (2020-2032) (USD Billion)

11.3.2.13 Switzerland

11.3.2.13.1 Switzerland Power Over Ethernet Devices Market Estimates and Forecasts, By Type (2020-2032) (USD Billion)

11.3.2.13.2 Switzerland Power Over Ethernet Devices Market Estimates and Forecasts, By Standard (2020-2032) (USD Billion)

11.3.2.13.3 Switzerland Power Over Ethernet Devices Market Estimates and Forecasts, By Device (2020-2032) (USD Billion)

11.3.2.13.4 Switzerland Power Over Ethernet Devices Market Estimates and Forecasts, By End Use (2020-2032) (USD Billion)

11.3.2.14 Austria

11.3.2.14.1 Austria Power Over Ethernet Devices Market Estimates and Forecasts, By Type (2020-2032) (USD Billion)

11.3.2.14.2 Austria Power Over Ethernet Devices Market Estimates and Forecasts, By Standard (2020-2032) (USD Billion)

11.3.2.14.3 Austria Power Over Ethernet Devices Market Estimates and Forecasts, By Device (2020-2032) (USD Billion)

11.3.2.14.4 Austria Power Over Ethernet Devices Market Estimates and Forecasts, By End Use (2020-2032) (USD Billion)

11.3.2.15 Rest of Western Europe

11.3.2.15.1 Rest of Western Europe Power Over Ethernet Devices Market Estimates and Forecasts, By Type (2020-2032) (USD Billion)

11.3.2.15.2 Rest of Western Europe Power Over Ethernet Devices Market Estimates and Forecasts, By Standard (2020-2032) (USD Billion)

11.3.2.15.3 Rest of Western Europe Power Over Ethernet Devices Market Estimates and Forecasts, By Device (2020-2032) (USD Billion)

11.3.2.15.4 Rest of Western Europe Power Over Ethernet Devices Market Estimates and Forecasts, By End Use (2020-2032) (USD Billion)

11.4 Asia Pacific

11.4.1 Trends Analysis

11.4.2 Asia Pacific Power Over Ethernet Devices Market Estimates and Forecasts, by Country (2020-2032) (USD Billion)

11.4.3 Asia Pacific Power Over Ethernet Devices Market Estimates and Forecasts, By Type (2020-2032) (USD Billion) 

11.4.4 Asia Pacific Power Over Ethernet Devices Market Estimates and Forecasts, By Standard (2020-2032) (USD Billion)

11.4.5 Asia Pacific Power Over Ethernet Devices Market Estimates and Forecasts, By Device (2020-2032) (USD Billion)

11.4.6 Asia Pacific Power Over Ethernet Devices Market Estimates and Forecasts, By End Use (2020-2032) (USD Billion)

11.4.7 China

11.4.7.1 China Power Over Ethernet Devices Market Estimates and Forecasts, By Type (2020-2032) (USD Billion)

11.4.7.2 China Power Over Ethernet Devices Market Estimates and Forecasts, By Standard (2020-2032) (USD Billion)

11.4.7.3 China Power Over Ethernet Devices Market Estimates and Forecasts, By Device (2020-2032) (USD Billion)

11.4.7.4 China Power Over Ethernet Devices Market Estimates and Forecasts, By End Use (2020-2032) (USD Billion)

11.4.8 India

11.4.8.1 India Power Over Ethernet Devices Market Estimates and Forecasts, By Type (2020-2032) (USD Billion)

11.4.8.2 India Power Over Ethernet Devices Market Estimates and Forecasts, By Standard (2020-2032) (USD Billion)

11.4.8.3 India Power Over Ethernet Devices Market Estimates and Forecasts, By Device (2020-2032) (USD Billion)

11.4.8.4 India Power Over Ethernet Devices Market Estimates and Forecasts, By End Use (2020-2032) (USD Billion)

11.4.9 Japan

11.4.9.1 Japan Power Over Ethernet Devices Market Estimates and Forecasts, By Type (2020-2032) (USD Billion)

11.4.9.2 Japan Power Over Ethernet Devices Market Estimates and Forecasts, By Standard (2020-2032) (USD Billion)

11.4.9.3 Japan Power Over Ethernet Devices Market Estimates and Forecasts, By Device (2020-2032) (USD Billion)

11.4.9.4 Japan Power Over Ethernet Devices Market Estimates and Forecasts, By End Use (2020-2032) (USD Billion)

11.4.10 South Korea

11.4.10.1 South Korea Power Over Ethernet Devices Market Estimates and Forecasts, By Type (2020-2032) (USD Billion)

11.4.10.2 South Korea Power Over Ethernet Devices Market Estimates and Forecasts, By Standard (2020-2032) (USD Billion)

11.4.10.3 South Korea Power Over Ethernet Devices Market Estimates and Forecasts, By Device (2020-2032) (USD Billion)

11.4.10.4 South Korea Power Over Ethernet Devices Market Estimates and Forecasts, By End Use (2020-2032) (USD Billion)

11.4.11 Vietnam

11.4.11.1 Vietnam Power Over Ethernet Devices Market Estimates and Forecasts, By Type (2020-2032) (USD Billion)

11.4.11.2 Vietnam Power Over Ethernet Devices Market Estimates and Forecasts, By Standard (2020-2032) (USD Billion)

11.4.11.3 Vietnam Power Over Ethernet Devices Market Estimates and Forecasts, By Device (2020-2032) (USD Billion)

11.4.11.4 Vietnam Power Over Ethernet Devices Market Estimates and Forecasts, By End Use (2020-2032) (USD Billion)

11.4.12 Singapore

11.4.12.1 Singapore Power Over Ethernet Devices Market Estimates and Forecasts, By Type (2020-2032) (USD Billion)

11.4.12.2 Singapore Power Over Ethernet Devices Market Estimates and Forecasts, By Standard (2020-2032) (USD Billion)

11.4.12.3 Singapore Power Over Ethernet Devices Market Estimates and Forecasts, By Device (2020-2032) (USD Billion)

11.4.12.4 Singapore Power Over Ethernet Devices Market Estimates and Forecasts, By End Use (2020-2032) (USD Billion)

11.4.13 Australia

11.4.13.1 Australia Power Over Ethernet Devices Market Estimates and Forecasts, By Type (2020-2032) (USD Billion)

11.4.13.2 Australia Power Over Ethernet Devices Market Estimates and Forecasts, By Standard (2020-2032) (USD Billion)

11.4.13.3 Australia Power Over Ethernet Devices Market Estimates and Forecasts, By Device (2020-2032) (USD Billion)

11.4.13.4 Australia Power Over Ethernet Devices Market Estimates and Forecasts, By End Use (2020-2032) (USD Billion)

11.4.14 Rest of Asia Pacific

11.4.14.1 Rest of Asia Pacific Power Over Ethernet Devices Market Estimates and Forecasts, By Type (2020-2032) (USD Billion)

11.4.14.2 Rest of Asia Pacific Power Over Ethernet Devices Market Estimates and Forecasts, By Standard (2020-2032) (USD Billion)

11.4.14.3 Rest of Asia Pacific Power Over Ethernet Devices Market Estimates and Forecasts, By Device (2020-2032) (USD Billion)

11.4.14.4 Rest of Asia Pacific Power Over Ethernet Devices Market Estimates and Forecasts, By End Use (2020-2032) (USD Billion)

11.5 Middle East and Africa

11.5.1 Middle East

11.5.1.1 Trends Analysis

11.5.1.2 Middle East Power Over Ethernet Devices Market Estimates and Forecasts, by Country (2020-2032) (USD Billion)

11.5.1.3 Middle East Power Over Ethernet Devices Market Estimates and Forecasts, By Type (2020-2032) (USD Billion) 

11.5.1.4 Middle East Power Over Ethernet Devices Market Estimates and Forecasts, By Standard (2020-2032) (USD Billion)

11.5.1.5 Middle East Power Over Ethernet Devices Market Estimates and Forecasts, By Device (2020-2032) (USD Billion)

11.5.1.6 Middle East Power Over Ethernet Devices Market Estimates and Forecasts, By End Use (2020-2032) (USD Billion)

11.5.1.7 UAE

11.5.1.7.1 UAE Power Over Ethernet Devices Market Estimates and Forecasts, By Type (2020-2032) (USD Billion)

11.5.1.7.2 UAE Power Over Ethernet Devices Market Estimates and Forecasts, By Standard (2020-2032) (USD Billion)

11.5.1.7.3 UAE Power Over Ethernet Devices Market Estimates and Forecasts, By Device (2020-2032) (USD Billion)

11.5.1.7.4 UAE Power Over Ethernet Devices Market Estimates and Forecasts, By End Use (2020-2032) (USD Billion)

11.5.1.8 Egypt

11.5.1.8.1 Egypt Power Over Ethernet Devices Market Estimates and Forecasts, By Type (2020-2032) (USD Billion)

11.5.1.8.2 Egypt Power Over Ethernet Devices Market Estimates and Forecasts, By Standard (2020-2032) (USD Billion)

11.5.1.8.3 Egypt Power Over Ethernet Devices Market Estimates and Forecasts, By Device (2020-2032) (USD Billion)

11.5.1.8.4 Egypt Power Over Ethernet Devices Market Estimates and Forecasts, By End Use (2020-2032) (USD Billion)

11.5.1.9 Saudi Arabia

11.5.1.9.1 Saudi Arabia Power Over Ethernet Devices Market Estimates and Forecasts, By Type (2020-2032) (USD Billion)

11.5.1.9.2 Saudi Arabia Power Over Ethernet Devices Market Estimates and Forecasts, By Standard (2020-2032) (USD Billion)

11.5.1.9.3 Saudi Arabia Power Over Ethernet Devices Market Estimates and Forecasts, By Device (2020-2032) (USD Billion)

11.5.1.9.4 Saudi Arabia Power Over Ethernet Devices Market Estimates and Forecasts, By End Use (2020-2032) (USD Billion)

11.5.1.10 Qatar

11.5.1.10.1 Qatar Power Over Ethernet Devices Market Estimates and Forecasts, By Type (2020-2032) (USD Billion)

11.5.1.10.2 Qatar Power Over Ethernet Devices Market Estimates and Forecasts, By Standard (2020-2032) (USD Billion)

11.5.1.10.3 Qatar Power Over Ethernet Devices Market Estimates and Forecasts, By Device (2020-2032) (USD Billion)

11.5.1.10.4 Qatar Power Over Ethernet Devices Market Estimates and Forecasts, By End Use (2020-2032) (USD Billion)

11.5.1.11 Rest of Middle East

11.5.1.11.1 Rest of Middle East Power Over Ethernet Devices Market Estimates and Forecasts, By Type (2020-2032) (USD Billion)

11.5.1.11.2 Rest of Middle East Power Over Ethernet Devices Market Estimates and Forecasts, By Standard (2020-2032) (USD Billion)

11.5.1.11.3 Rest of Middle East Power Over Ethernet Devices Market Estimates and Forecasts, By Device (2020-2032) (USD Billion)

11.5.1.11.4 Rest of Middle East Power Over Ethernet Devices Market Estimates and Forecasts, By End Use (2020-2032) (USD Billion)

11.5.2 Africa

11.5.2.1 Trends Analysis

11.5.2.2 Africa Power Over Ethernet Devices Market Estimates and Forecasts, by Country (2020-2032) (USD Billion)

11.5.2.3 Africa Power Over Ethernet Devices Market Estimates and Forecasts, By Type (2020-2032) (USD Billion) 

11.5.2.4 Africa Power Over Ethernet Devices Market Estimates and Forecasts, By Standard (2020-2032) (USD Billion)

11.5.2.5 Africa Power Over Ethernet Devices Market Estimates and Forecasts, By Device (2020-2032) (USD Billion)

11.5.2.6 Africa Power Over Ethernet Devices Market Estimates and Forecasts, By End Use (2020-2032) (USD Billion)

11.5.2.7 South Africa

11.5.2.7.1 South Africa Power Over Ethernet Devices Market Estimates and Forecasts, By Type (2020-2032) (USD Billion)

11.5.2.7.2 South Africa Power Over Ethernet Devices Market Estimates and Forecasts, By Standard (2020-2032) (USD Billion)

11.5.2.7.3 South Africa Power Over Ethernet Devices Market Estimates and Forecasts, By Device (2020-2032) (USD Billion)

11.5.2.7.4 South Africa Power Over Ethernet Devices Market Estimates and Forecasts, By End Use (2020-2032) (USD Billion)

11.5.2.8 Nigeria

11.5.2.8.1 Nigeria Power Over Ethernet Devices Market Estimates and Forecasts, By Type (2020-2032) (USD Billion)

11.5.2.8.2 Nigeria Power Over Ethernet Devices Market Estimates and Forecasts, By Standard (2020-2032) (USD Billion)

11.5.2.8.3 Nigeria Power Over Ethernet Devices Market Estimates and Forecasts, By Device (2020-2032) (USD Billion)

11.5.2.8.4 Nigeria Power Over Ethernet Devices Market Estimates and Forecasts, By End Use (2020-2032) (USD Billion)

11.5.2.9 Rest of Africa

11.5.2.9.1 Rest of Africa Power Over Ethernet Devices Market Estimates and Forecasts, By Type (2020-2032) (USD Billion)

11.5.2.9.2 Rest of Africa Power Over Ethernet Devices Market Estimates and Forecasts, By Standard (2020-2032) (USD Billion)

11.5.2.9.3 Rest of Africa Power Over Ethernet Devices Market Estimates and Forecasts, By Device (2020-2032) (USD Billion)

11.5.2.9.4 Rest of Africa Power Over Ethernet Devices Market Estimates and Forecasts, By End Use (2020-2032) (USD Billion)

11.6 Latin America

11.6.1 Trends Analysis

11.6.2 Latin America Power Over Ethernet Devices Market Estimates and Forecasts, by Country (2020-2032) (USD Billion)

11.6.3 Latin America Power Over Ethernet Devices Market Estimates and Forecasts, By Type (2020-2032) (USD Billion) 

11.6.4 Latin America Power Over Ethernet Devices Market Estimates and Forecasts, By Standard (2020-2032) (USD Billion)

11.6.5 Latin America Power Over Ethernet Devices Market Estimates and Forecasts, By Device (2020-2032) (USD Billion)

11.6.6 Latin America Power Over Ethernet Devices Market Estimates and Forecasts, By End Use (2020-2032) (USD Billion)

11.6.7 Brazil

11.6.7.1 Brazil Power Over Ethernet Devices Market Estimates and Forecasts, By Type (2020-2032) (USD Billion)

11.6.7.2 Brazil Power Over Ethernet Devices Market Estimates and Forecasts, By Standard (2020-2032) (USD Billion)

11.6.7.3 Brazil Power Over Ethernet Devices Market Estimates and Forecasts, By Device (2020-2032) (USD Billion)

11.6.7.4 Brazil Power Over Ethernet Devices Market Estimates and Forecasts, By End Use (2020-2032) (USD Billion)

11.6.8 Argentina

11.6.8.1 Argentina Power Over Ethernet Devices Market Estimates and Forecasts, By Type (2020-2032) (USD Billion)

11.6.8.2 Argentina Power Over Ethernet Devices Market Estimates and Forecasts, By Standard (2020-2032) (USD Billion)

11.6.8.3 Argentina Power Over Ethernet Devices Market Estimates and Forecasts, By Device (2020-2032) (USD Billion)

11.6.8.4 Argentina Power Over Ethernet Devices Market Estimates and Forecasts, By End Use (2020-2032) (USD Billion)

11.6.9 Colombia

11.6.9.1 Colombia Power Over Ethernet Devices Market Estimates and Forecasts, By Type (2020-2032) (USD Billion)

11.6.9.2 Colombia Power Over Ethernet Devices Market Estimates and Forecasts, By Standard (2020-2032) (USD Billion)

11.6.9.3 Colombia Power Over Ethernet Devices Market Estimates and Forecasts, By Device (2020-2032) (USD Billion)

11.6.9.4 Colombia Power Over Ethernet Devices Market Estimates and Forecasts, By End Use (2020-2032) (USD Billion)

11.6.10 Rest of Latin America

11.6.10.1 Rest of Latin America Power Over Ethernet Devices Market Estimates and Forecasts, By Type (2020-2032) (USD Billion)

11.6.10.2 Rest of Latin America Power Over Ethernet Devices Market Estimates and Forecasts, By Standard (2020-2032) (USD Billion)

11.6.10.3 Rest of Latin America Power Over Ethernet Devices Market Estimates and Forecasts, By Device (2020-2032) (USD Billion)

11.6.10.4 Rest of Latin America Power Over Ethernet Devices Market Estimates and Forecasts, By End Use (2020-2032) (USD Billion)

12. Company Profiles

12.1 Cisco Systems

12.1.1 Company Overview

12.1.2 Financial

12.1.3 Products/ Services Offered

12.1.4 SWOT Analysis

12.2 Ubiquiti Networks

12.2.1 Company Overview

12.2.2 Financial

12.2.3 Products/ Services Offered

12.2.4 SWOT Analysis

12.3 TP-Link.

12.3.1 Company Overview

12.3.2 Financial

12.3.3 Products/ Services Offered

12.3.4 SWOT Analysis

12.4 NETGEAR

12.4.1 Company Overview

12.4.2 Financial

12.4.3 Products/ Services Offered

12.4.4 SWOT Analysis

12.5 MikroTik

12.5.1 Company Overview

12.5.2 Financial

12.5.3 Products/ Services Offered

12.5.4 SWOT Analysis

12.6 Juniper Networks

12.6.1 Company Overview

12.6.2 Financial

12.6.3 Products/ Services Offered

12.6.4 SWOT Analysis

12.7 Arista Networks

12.7.1 Company Overview

12.7.2 Financial

12.7.3 Products/ Services Offered

12.7.4 SWOT Analysis

12.8 Huawei

12.8.1 Company Overview

12.8.2 Financial

12.8.3 Products/ Services Offered

12.8.4 SWOT Analysis

12.9 D-Link

12.9.1 Company Overview

12.9.2 Financial

12.9.3 Products/ Services Offered

12.9.4 SWOT Analysis

12.10 Belkin

12.10.1 Company Overview

12.10.2 Financial

12.10.3 Products/ Services Offered

12.10.4 SWOT Analysis

13. Use Cases and Best Practices

14. Conclusion

An accurate research report requires proper strategizing as well as implementation. There are multiple factors involved in the completion of good and accurate research report and selecting the best methodology to compete the research is the toughest part. Since the research reports we provide play a crucial role in any company’s decision-making process, therefore we at SNS Insider always believe that we should choose the best method which gives us results closer to reality. This allows us to reach at a stage wherein we can provide our clients best and accurate investment to output ratio.

Each report that we prepare takes a timeframe of 350-400 business hours for production. Starting from the selection of titles through a couple of in-depth brain storming session to the final QC process before uploading our titles on our website we dedicate around 350 working hours. The titles are selected based on their current market cap and the foreseen CAGR and growth.


The 5 steps process:

Step 1: Secondary Research:

Secondary Research or Desk Research is as the name suggests is a research process wherein, we collect data through the readily available information. In this process we use various paid and unpaid databases which our team has access to and gather data through the same. This includes examining of listed companies’ annual reports, Journals, SEC filling etc. Apart from this our team has access to various associations across the globe across different industries. Lastly, we have exchange relationships with various university as well as individual libraries.

Secondary Research

Step 2: Primary Research

When we talk about primary research, it is a type of study in which the researchers collect relevant data samples directly, rather than relying on previously collected data.  This type of research is focused on gaining content specific facts that can be sued to solve specific problems. Since the collected data is fresh and first hand therefore it makes the study more accurate and genuine.

We at SNS Insider have divided Primary Research into 2 parts.

Part 1 wherein we interview the KOLs of major players as well as the upcoming ones across various geographic regions. This allows us to have their view over the market scenario and acts as an important tool to come closer to the accurate market numbers. As many as 45 paid and unpaid primary interviews are taken from both the demand and supply side of the industry to make sure we land at an accurate judgement and analysis of the market.

This step involves the triangulation of data wherein our team analyses the interview transcripts, online survey responses and observation of on filed participants. The below mentioned chart should give a better understanding of the part 1 of the primary interview.

Primary Research

Part 2: In this part of primary research the data collected via secondary research and the part 1 of the primary research is validated with the interviews from individual consultants and subject matter experts.

Consultants are those set of people who have at least 12 years of experience and expertise within the industry whereas Subject Matter Experts are those with at least 15 years of experience behind their back within the same space. The data with the help of two main processes i.e., FGDs (Focused Group Discussions) and IDs (Individual Discussions). This gives us a 3rd party nonbiased primary view of the market scenario making it a more dependable one while collation of the data pointers.

Step 3: Data Bank Validation

Once all the information is collected via primary and secondary sources, we run that information for data validation. At our intelligence centre our research heads track a lot of information related to the market which includes the quarterly reports, the daily stock prices, and other relevant information. Our data bank server gets updated every fortnight and that is how the information which we collected using our primary and secondary information is revalidated in real time.

Data Bank Validation

Step 4: QA/QC Process

After all the data collection and validation our team does a final level of quality check and quality assurance to get rid of any unwanted or undesired mistakes. This might include but not limited to getting rid of the any typos, duplication of numbers or missing of any important information. The people involved in this process include technical content writers, research heads and graphics people. Once this process is completed the title gets uploader on our platform for our clients to read it.

Step 5: Final QC/QA Process:

This is the last process and comes when the client has ordered the study. In this process a final QA/QC is done before the study is emailed to the client. Since we believe in giving our clients a good experience of our research studies, therefore, to make sure that we do not lack at our end in any way humanly possible we do a final round of quality check and then dispatch the study to the client.

Key Segments:

By Type

  • Power Sourcing Equipment Controllers and ICs

  • Powered Device Controllers and ICs

By Standard

  • 802.3af standard

  • 802.3at standard

  • 802.3bt standard

By Device

  • Network Cameras

  • VoIP Phone

  • Ethernet Switch & Injector

  • Wireless Radio Access Point

  • Proximity Sensor

  • LED Lighting

By End Use

  • Commercial

  • Industrial

  • Residential

Request for Segment Customization as per your Business Requirement: Segment Customization Request

Regional Coverage:

North America

  • US

  • Canada

  • Mexico

Europe

  • Eastern Europe

    • Poland

    • Romania

    • Hungary

    • Turkey

    • Rest of Eastern Europe

  • Western Europe

    • Germany

    • France

    • UK

    • Italy

    • Spain

    • Netherlands

    • Switzerland

    • Austria

    • Rest of Western Europe

Asia Pacific

  • China

  • India

  • Japan

  • South Korea

  • Vietnam

  • Singapore

  • Australia

  • Rest of Asia Pacific

Middle East & Africa

  • Middle East

    • UAE

    • Egypt

    • Saudi Arabia

    • Qatar

    • Rest of Middle East

  • Africa

    • Nigeria

    • South Africa

    • Rest of Africa

Latin America

  • Brazil

  • Argentina

  • Colombia

  • Rest of Latin America

Request for Country Level Research Report: Country Level Customization Request

Available Customization

With the given market data, SNS Insider offers customization as per the company’s specific needs. The following customization options are available for the report:

  • Detailed Volume Analysis

  • Criss-Cross segment analysis (e.g. Product X Application)

  • Competitive Product Benchmarking

  • Geographic Analysis

  • Additional countries in any of the regions

  • Customized Data Representation

  • Detailed analysis and profiling of additional market players


  •            5000 (33% Discount)


  •            8950 (40% Discount)


  •            3050 (23% Discount)

Start a Conversation

Hi! Click one of our member below to chat on Phone