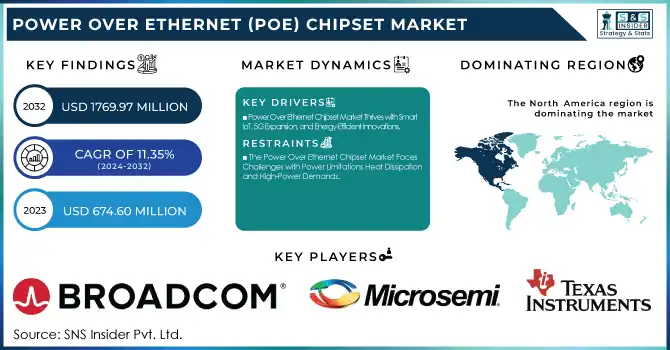
The Power Over Ethernet (PoE) Chipset Market size was valued at USD 674.60 million in 2023 and is expected to reach USD 1769.97 million by 2032, growing at a CAGR of 11.35% over the forecast period 2024-2032. The Power over Ethernet (PoE) Chipset Market is seeing rapid adoption in industrial automation, smart buildings, and enterprise networking as they carry both power and data on one cable. This is driving deployment in IoT, Security cameras, VoIP, and LED lighting to assist the efficiency of operations. Network improvements are aimed at faster, more reliable, more dependable, and lower-latency data transfer. Performance and reliability improvements better heat dissipation, reduced power loss, and enhanced fault tolerance. Energy efficiency is still one of the principal motors, powered by PoE chipsets supporting optimized power distribution, low idle consumption, and evermore stringent IEEE standards for eco-sustainability.
To Get more information on Power Over Ethernet (PoE) Chipset Market - Request Free Sample Report
Key Drivers:
Power Over Ethernet Chipset Market Thrives with Smart IoT, 5G Expansion, and Energy-Efficient Innovations
Power over Ethernet (PoE) chipset Market Overview The PoE chipset market is driven by the demand shift for a combined power and data transmission solution across verticals. The growing usage of smart IoT devices such as home and building security devices like network cameras, VoIP phones, and access points further accelerates market growth. The rising installation of smart lighting systems, especially LED lighting with PoE technology, is the primary factor fueling the market growth as organizations are looking for energy-efficient and economic solutions. Moreover, the development of 5G networks and IoT environments is driving the need for PoE-supported infrastructure that offers reliable connectivity and power transmission without tedious wiring. Growing penetration of smart buildings and industrial automation fueled the business demand and promoted centralized power management of connected devices, thereby contributing to market growth.
Restrain:
The Power Over Ethernet Chipset Market Faces Challenges with Power Limitations Heat Dissipation and High-Power Demands
Power limitation as imposed by PoE standards is one of the major restraints in the Power over Ethernet (PoE) chipset market. Although PoE++ (IEEE 802.3bt) raises the output power to 60W–100W, this is insufficient for various high-power applications, including industrial machinery, complex automation systems, and high-end medical devices. This limits PoE adoption in fields where there are energy-intensive devices. In addition, high-power PoE networks face heat dissipation difficulties due to the gathering of networking equipment leading to exhaustion, which can impair the performance and longevity of networking devices. Additionally, a demand for power-efficient thermal management solutions. This increases the complexity of PoE chipset cascade design and implementation.
Opportunity:
Power Over Ethernet Chipset Market Expands with Advanced Standards Smart Security and Sustainable Energy Initiatives
Technological advancements and expansion of applications are some of the opportunities that can be leveraged in the PoE chipset market. Next, the rise of high-power PoE standards (PoE++/IEEE 802.3bt) enables the powering of more power-hungry devices like large displays high-performance access points, and industrial automation equipment. The growing utilization of proximity sensors and smart security systems in sectors such as retail, healthcare, and smart city are other areas of high growth prospects. Moreover, the growth of government initiatives in the direction of sustainable energy solutions and smart city projects promises to generate further demand for PoE technology, making it a crucial driving force for future digital infrastructure.
Challenges:
Power Over Ethernet Chipset Market Faces Challenges with Standardization Compatibility and Reliability in Critical Applications
The standardization of PoE chipsets across various manufacturers, devices, and even different models leaving the factory poses another severe problem. Thus, while manufacturers are developing unique PoE solutions, that means it can be tough when it comes to compatibility because the PSEs may struggle to work with PDs. Moreover, in mission-critical applications like healthcare, security, and industrial automation, the risk of power fluctuations and network failures also remains high in PoE systems. Developing solutions to these technical challenges will continue to drive improvements in the efficiency, safety, and adaptability of PoE chipsets over time as the technology continues to achieve new milestones and ineffective performance for various use cases.
By Type
In 2023 the share of PoE Powered Devices (PD) chipsets reached 53.8%, due to a large amount of Power Sourcing Equipment such as network cameras, VoIP phones, LED lighting, and wireless access points powered through remains of Wireline Power over Ethernet (PoE) technology. This strong position in the market is attributed to the rising demand for IoT-based smart devices and energy-efficient solutions in commercial and industrial sectors. Other reasons driving the use of PD chipsets is the increasing penetration of smart buildings and security systems which is turning them into a prominent electronic networking infrastructure.
PoE Power Sourcing Equipment (PSE) chipsets are expected to witness the highest CAGR during the forecast timeframe (2024-2032) due to continuous developments in high-power PoE standards (IEEE 802.3bt) and the rising need for centralized power management solutions. Due to the growing demand for efficient power delivery infrastructure owing to the acceleration of industrial automation, 5G networks, and smart city projects, PSE chipset adoption is set to witness significant growth.
By Standard
The 802.3at (PoE+) standard accounted for a larger chunk of the PoE chipset market with a 47.2% share in 2023, due mainly to its popularity in VoIP phones and other applications, including security cameras, wireless access points, and LED lighting. This was sufficient to roll out up to 30W per port, which is why businesses favored this piece of gear for PoE across commercial and industrial applications. Expanding smart infrastructure and IoT connectivity needs to cement its leadership in the market.
The IEEE 802.3bt standard is foreseen to grow at the highest CAGR over the forecasted period 2024-2032, due to the demand for increased power delivery (up to 100W). These standards power next-generation applications such as high-performance wireless access points, smart displays, and industrial automation, which is a major enabler for next-gen PoE upgrades.
By Device
In 2023, the Ethernet Switch & Injector PoE chipset market was holding the maximum revenue share of 24.6%, due to the growing need for efficient and flexible networking solutions. The popular applications of PoE switches and injectors in enterprises, data centers, and smart buildings have been widely designed to power IP cameras, VoIP phones, and wireless access points for data transmission and centralized power management respectively. The transition to IoT-driven infrastructure and cloud-based applications only cemented their top status in the market.
The fastest CAGR over the forecast period from 2024 to 2032 is expected to be represented by LED lighting, driven by the transition to smart and energy-efficient lighting. Rising deployment of PoE-powered LED systems in smart buildings, commercial spaces, and industrial facilities for cost savings benefits, remote control, and automation are expected to be the key factors driving the growth of the POE Led Driver Market throughout the forecast period.
By End Use
In 2023, the industrial segment led the market with a 43.7% share owing to the growing adoption of PoE-enabled industrial automation systems, PoE-enabled security systems, and wireless communication networks in various industrial applications. PoE technology is used by various industries to power IoT devices, sensors, and control systems where smooth data transfer and centralized power management are necessary.
The commercial sector is estimated to witness the fastest CAGR from 2024 to 2032. More businesses are adopting PoE solutions to achieve business efficiencies through VoIP phones, access control, and energy-efficient LED lighting. Another major aid for commercial PoE development or rather the growing demand for the same can be attributed to the increased adoption of co-working spaces, commercialization in automation, and smart city projects, which are some of the key growth driving factors in commercial PoE market over the forecast period.
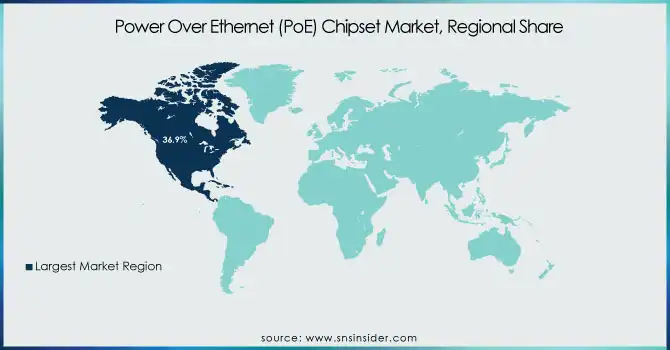
North America held a dominant share of 36.9% in the year 2023, attributed to the region's high adoption of smart infrastructure, catalyst equipment, and advanced networking solutions. The dominance of North America, which includes major technology companies like Cisco, Broadcom, and Texas Instruments, as well as rising investment in data centers, 5G networks, and smart buildings, has further reinforced this position. New York smart city projects, for example, utilize PoE-enabled smart audio-visual systems and intelligent lighting, and smart city projects such as the Office of Technology and Innovation Surveillance Camera program provide a research project that leverages PoE technology for such urban and infrastructure activities. Furthermore, proven market leaders and technology centers in Silicon Valley adopt PoE technology for office automation, voice-over-internet-phone (VoIP) communication, and security systems which, in turn, is expected to propel the market growth.
Asia Pacific is expected to experience the highest CAGR in the region from 2024 to 2032, driven by rapid urbanization, increasing industrialization, and growing smart city projects. PoE market growth is projected to be fueled by heavy investments in IoT, 5G, and smart infrastructure in China, India, and Japan. Singapore Smart Nation is an exemplary initiative that uses a combination of LEDs, smart security cameras, and IoT sensors powered by PoE to make city management efficient. Likewise, In India, efforts like Digital India have bolstered PoE-powered networking solutions within commercial and public domains and paved the way for rapid market progression.
Get Customized Report as per Your Business Requirement - Enquiry Now
Some of the major players in the Power Over Ethernet (PoE) Chipset Market are:
Broadcom (BCM59111, BCM59121)
Microsemi (PD69101, PD70201)
Marvell Technology (88E1510, 88E1111)
Texas Instruments (TPS23861, TPS2372)
Linear Technology (now part of Analog Devices) (LTC4267, LTC4279)
Maxim Integrated (MAX5969, MAX5980)
ON Semiconductor (NCP1095, NCP1096)
STMicroelectronics (STPD01, PM8805)
Silicon Labs (Si3402-B, Si3404-B)
Microchip Technology (PD70224, PD70210)
Qualcomm Atheros (AR8035, AR8033)
Realtek Semiconductor (RTL8211E, RTL8363SB)
ASIX Electronics (AX88796C, AX88772C)
Delta Electronics (DPH Series, DPR Series)
Sigma Designs (CG2210, CG3210)
In December 2024, Marvell launched a 1.6 Tbps Linear-Drive Pluggable Optics (LPO) chipset to enhance high-bandwidth, short-reach interconnects in AI-driven data centers. Optimized for 200G per lane, it improves efficiency, reduces power consumption, and scales next-gen compute fabric networks.
| Report Attributes | Details |
|---|---|
| Market Size in 2023 | USD 674.60 Million |
| Market Size by 2032 | USD 1769.97 Million |
| CAGR | CAGR of 11.35% From 2024 to 2032 |
| Base Year | 2023 |
| Forecast Period | 2024-2032 |
| Historical Data | 2020-2022 |
| Report Scope & Coverage | Market Size, Segments Analysis, Competitive Landscape, Regional Analysis, DROC & SWOT Analysis, Forecast Outlook |
| Key Segments | • By Type (PoE Power Sourcing Equipment (PSE) Chipset, PoE Powered Devices (PD) Chipset) • By Standard (802.3af standard, 802.3at standard, 802.3bt standard) • By Device (Network Cameras, VoIP Phone, Ethernet Switch & Injector, Wireless Radio Access Point, Proximity Sensor, LED Lighting) • By End Use (Commercial, Industrial, Residential) |
| Regional Analysis/Coverage | North America (US, Canada, Mexico), Europe (Eastern Europe [Poland, Romania, Hungary, Turkey, Rest of Eastern Europe] Western Europe] Germany, France, UK, Italy, Spain, Netherlands, Switzerland, Austria, Rest of Western Europe]), Asia Pacific (China, India, Japan, South Korea, Vietnam, Singapore, Australia, Rest of Asia Pacific), Middle East & Africa (Middle East [UAE, Egypt, Saudi Arabia, Qatar, Rest of Middle East], Africa [Nigeria, South Africa, Rest of Africa], Latin America (Brazil, Argentina, Colombia, Rest of Latin America) |
| Company Profiles | Broadcom, Microsemi, Marvell Technology, Texas Instruments, Linear Technology (Analog Devices), Maxim Integrated, ON Semiconductor, STMicroelectronics, Silicon Labs, Microchip Technology, Qualcomm Atheros, Realtek Semiconductor, ASIX Electronics, Delta Electronics, Sigma Designs. |
Ans: The Power Over Ethernet (PoE) Chipset Market is expected to grow at a CAGR of 11.35% during 2024-2032.
Ans: Power Over Ethernet (PoE) Chipset Market size was USD 674.60 million in 2023 and is expected to Reach USD 1769.97 million by 2032.
Ans: The major growth factor of the Power over Ethernet (PoE) chipset market is the increasing adoption of IoT, smart buildings, and high-power PoE applications in industrial automation, security, and networking infrastructure.
Ans: The Ethernet Switch & Injector segment dominated the Power Over Ethernet (PoE) Chipset Market in 2023.
Ans: North America dominated the Power Over Ethernet (PoE) Chipset Market in 2023.
1. Introduction
1.1 Market Definition
1.2 Scope (Inclusion and Exclusions)
1.3 Research Assumptions
2. Executive Summary
2.1 Market Overview
2.2 Regional Synopsis
2.3 Competitive Summary
3. Research Methodology
3.1 Top-Down Approach
3.2 Bottom-up Approach
3.3. Data Validation
3.4 Primary Interviews
4. Market Dynamics Impact Analysis
4.1 Market Driving Factors Analysis
4.1.1 Drivers
4.1.2 Restraints
4.1.3 Opportunity
4.1.4 Challenges
4.2 PESTLE Analysis
4.3 Porter’s Five Forces Model
5. Statistical Insights and Trends Reporting
5.1 Adoption & Deployment Metrics
5.2 Network & Connectivity Metrics
5.3 Performance & Reliability Metrics
5.4 Power & Energy Efficiency Metrics
6. Competitive Landscape
6.1 List of Major Companies, By Region
6.2 Market Share Analysis, By Region
6.3 Product Benchmarking
6.3.1 Product specifications and features
6.3.2 Pricing
6.4 Strategic Initiatives
6.4.1 Marketing and promotional activities
6.4.2 Distribution and Supply Chain Strategies
6.4.3 Expansion plans and new product launches
6.4.4 Strategic partnerships and collaborations
6.5 Technological Advancements
6.6 Market Positioning and Branding
7. Power Over Ethernet (PoE) Chipset Market Segmentation, By Type
7.1 Chapter Overview
7.2 PoE Power Sourcing Equipment (PSE) Chipset
7.2.1 PoE Power Sourcing Equipment (PSE) Chipset Market Trends Analysis (2020-2032)
7.2.2 PoE Power Sourcing Equipment (PSE) Chipset Market Size Estimates and Forecasts to 2032 (USD Million)
7.3 PoE Powered Devices (PD) Chipset
7.3.1 PoE Powered Devices (PD) Chipset Market Trends Analysis (2020-2032)
7.3.2 PoE Powered Devices (PD) Chipset Market Size Estimates and Forecasts to 2032 (USD Million)
8. Power Over Ethernet (PoE) Chipset Market Segmentation, By Standard
8.1 Chapter Overview
8.2 802.3af standard
8.2.1 802.3af Standard Market Trends Analysis (2020-2032)
8.2.2 802.3af Standard Market Size Estimates and Forecasts to 2032 (USD Million)
8.3 802.3at standard
8.3.1 802.3at standard Market Trends Analysis (2020-2032)
8.3.2 802.3at standard Market Size Estimates and Forecasts to 2032 (USD Million)
8.4 802.3bt standard
8.4.1 802.3bt Standard Market Trends Analysis (2020-2032)
8.4.2 802.3bt Standard Market Size Estimates and Forecasts to 2032 (USD Million)
9. Power Over Ethernet (PoE) Chipset Market Segmentation, By Device
9.1 Chapter Overview
9.2 Network Cameras
9.2.1 Network Cameras Market Trends Analysis (2020-2032)
9.2.2 Network Cameras Market Size Estimates and Forecasts to 2032 (USD Million)
9.3 VoIP Phone
9.3.1 VoIP Phone Market Trends Analysis (2020-2032)
9.3.2 VoIP Phone Market Size Estimates and Forecasts to 2032 (USD Million)
9.4 Ethernet Switch & Injector
9.4.1 Ethernet Switch & Injector Market Trends Analysis (2020-2032)
9.4.2 Ethernet Switch & Injector Market Size Estimates and Forecasts to 2032 (USD Million)
9.5 Wireless Radio Access Point
9.5.1 Wireless Radio Access Point Market Trends Analysis (2020-2032)
9.5.2 Wireless Radio Access Point Market Size Estimates and Forecasts to 2032 (USD Million)
9.6 Proximity Sensor
9.6.1 Proximity Sensor Market Trends Analysis (2020-2032)
9.6.2 Proximity Sensor Market Size Estimates and Forecasts to 2032 (USD Million)
9.7 LED Lighting
9.7.1 LED Lighting Market Trends Analysis (2020-2032)
9.7.2 LED Lighting Market Size Estimates and Forecasts to 2032 (USD Million)
10. Power Over Ethernet (PoE) Chipset Market Segmentation, By End Use
10.1 Chapter Overview
10.2 Commercial
10.2.1 Commercial Market Trends Analysis (2020-2032)
10.2.2 Commercial Market Size Estimates and Forecasts to 2032 (USD Million)
10.3 Industrial
10.3.1 Industrial Market Trends Analysis (2020-2032)
10.3.2 Industrial Market Size Estimates and Forecasts to 2032 (USD Million)
10.4 Residential
10.4.1 Residential Market Trends Analysis (2020-2032)
10.4.2 Residential Market Size Estimates and Forecasts to 2032 (USD Million)
11. Regional Analysis
11.1 Chapter Overview
11.2 North America
11.2.1 Trends Analysis
11.2.2 North America Power Over Ethernet (PoE) Chipset Market Estimates and Forecasts, by Country (2020-2032) (USD Million)
11.2.3 North America Power Over Ethernet (PoE) Chipset Market Estimates and Forecasts, By Type (2020-2032) (USD Million)
11.2.4 North America Power Over Ethernet (PoE) Chipset Market Estimates and Forecasts, By Standard (2020-2032) (USD Million)
11.2.5 North America Power Over Ethernet (PoE) Chipset Market Estimates and Forecasts, By Device (2020-2032) (USD Million)
11.2.6 North America Power Over Ethernet (PoE) Chipset Market Estimates and Forecasts, By End Use (2020-2032) (USD Million)
11.2.7 USA
11.2.7.1 USA Power Over Ethernet (PoE) Chipset Market Estimates and Forecasts, By Type (2020-2032) (USD Million)
11.2.7.2 USA Power Over Ethernet (PoE) Chipset Market Estimates and Forecasts, By Standard (2020-2032) (USD Million)
11.2.7.3 USA Power Over Ethernet (PoE) Chipset Market Estimates and Forecasts, By Device (2020-2032) (USD Million)
11.2.7.4 USA Power Over Ethernet (PoE) Chipset Market Estimates and Forecasts, By End Use (2020-2032) (USD Million)
11.2.8 Canada
11.2.8.1 Canada Power Over Ethernet (PoE) Chipset Market Estimates and Forecasts, By Type (2020-2032) (USD Million)
11.2.8.2 Canada Power Over Ethernet (PoE) Chipset Market Estimates and Forecasts, By Standard (2020-2032) (USD Million)
11.2.8.3 Canada Power Over Ethernet (PoE) Chipset Market Estimates and Forecasts, By Device (2020-2032) (USD Million)
11.2.8.4 Canada Power Over Ethernet (PoE) Chipset Market Estimates and Forecasts, By End Use (2020-2032) (USD Million)
11.2.9 Mexico
11.2.9.1 Mexico Power Over Ethernet (PoE) Chipset Market Estimates and Forecasts, By Type (2020-2032) (USD Million)
11.2.9.2 Mexico Power Over Ethernet (PoE) Chipset Market Estimates and Forecasts, By Standard (2020-2032) (USD Million)
11.2.9.3 Mexico Power Over Ethernet (PoE) Chipset Market Estimates and Forecasts, By Device (2020-2032) (USD Million)
11.2.9.4 Mexico Power Over Ethernet (PoE) Chipset Market Estimates and Forecasts, By End Use (2020-2032) (USD Million)
11.3 Europe
11.3.1 Eastern Europe
11.3.1.1 Trends Analysis
11.3.1.2 Eastern Europe Power Over Ethernet (PoE) Chipset Market Estimates and Forecasts, by Country (2020-2032) (USD Million)
11.3.1.3 Eastern Europe Power Over Ethernet (PoE) Chipset Market Estimates and Forecasts, By Type (2020-2032) (USD Million)
11.3.1.4 Eastern Europe Power Over Ethernet (PoE) Chipset Market Estimates and Forecasts, By Standard (2020-2032) (USD Million)
11.3.1.5 Eastern Europe Power Over Ethernet (PoE) Chipset Market Estimates and Forecasts, By Device (2020-2032) (USD Million)
11.3.1.6 Eastern Europe Power Over Ethernet (PoE) Chipset Market Estimates and Forecasts, By End Use (2020-2032) (USD Million)
11.3.1.7 Poland
11.3.1.7.1 Poland Power Over Ethernet (PoE) Chipset Market Estimates and Forecasts, By Type (2020-2032) (USD Million)
11.3.1.7.2 Poland Power Over Ethernet (PoE) Chipset Market Estimates and Forecasts, By Standard (2020-2032) (USD Million)
11.3.1.7.3 Poland Power Over Ethernet (PoE) Chipset Market Estimates and Forecasts, By Device (2020-2032) (USD Million)
11.3.1.7.4 Poland Power Over Ethernet (PoE) Chipset Market Estimates and Forecasts, By End Use (2020-2032) (USD Million)
11.3.1.8 Romania
11.3.1.8.1 Romania Power Over Ethernet (PoE) Chipset Market Estimates and Forecasts, By Type (2020-2032) (USD Million)
11.3.1.8.2 Romania Power Over Ethernet (PoE) Chipset Market Estimates and Forecasts, By Standard (2020-2032) (USD Million)
11.3.1.8.3 Romania Power Over Ethernet (PoE) Chipset Market Estimates and Forecasts, By Device (2020-2032) (USD Million)
11.3.1.8.4 Romania Power Over Ethernet (PoE) Chipset Market Estimates and Forecasts, By End Use (2020-2032) (USD Million)
11.3.1.9 Hungary
11.3.1.9.1 Hungary Power Over Ethernet (PoE) Chipset Market Estimates and Forecasts, By Type (2020-2032) (USD Million)
11.3.1.9.2 Hungary Power Over Ethernet (PoE) Chipset Market Estimates and Forecasts, By Standard (2020-2032) (USD Million)
11.3.1.9.3 Hungary Power Over Ethernet (PoE) Chipset Market Estimates and Forecasts, By Device (2020-2032) (USD Million)
11.3.1.9.4 Hungary Power Over Ethernet (PoE) Chipset Market Estimates and Forecasts, By End Use (2020-2032) (USD Million)
11.3.1.10 turkey
11.3.1.10.1 Turkey Power Over Ethernet (PoE) Chipset Market Estimates and Forecasts, By Type (2020-2032) (USD Million)
11.3.1.10.2 Turkey Power Over Ethernet (PoE) Chipset Market Estimates and Forecasts, By Standard (2020-2032) (USD Million)
11.3.1.10.3 Turkey Power Over Ethernet (PoE) Chipset Market Estimates and Forecasts, By Device (2020-2032) (USD Million)
11.3.1.10.4 Turkey Power Over Ethernet (PoE) Chipset Market Estimates and Forecasts, By End Use (2020-2032) (USD Million)
11.3.1.11 Rest of Eastern Europe
11.3.1.11.1 Rest of Eastern Europe Power Over Ethernet (PoE) Chipset Market Estimates and Forecasts, By Type (2020-2032) (USD Million)
11.3.1.11.2 Rest of Eastern Europe Power Over Ethernet (PoE) Chipset Market Estimates and Forecasts, By Standard (2020-2032) (USD Million)
11.3.1.11.3 Rest of Eastern Europe Power Over Ethernet (PoE) Chipset Market Estimates and Forecasts, By Device (2020-2032) (USD Million)
11.3.1.11.4 Rest of Eastern Europe Power Over Ethernet (PoE) Chipset Market Estimates and Forecasts, By End Use (2020-2032) (USD Million)
11.3.2 Western Europe
11.3.2.1 Trends Analysis
11.3.2.2 Western Europe Power Over Ethernet (PoE) Chipset Market Estimates and Forecasts, by Country (2020-2032) (USD Million)
11.3.2.3 Western Europe Power Over Ethernet (PoE) Chipset Market Estimates and Forecasts, By Type (2020-2032) (USD Million)
11.3.2.4 Western Europe Power Over Ethernet (PoE) Chipset Market Estimates and Forecasts, By Standard (2020-2032) (USD Million)
11.3.2.5 Western Europe Power Over Ethernet (PoE) Chipset Market Estimates and Forecasts, By Device (2020-2032) (USD Million)
11.3.2.6 Western Europe Power Over Ethernet (PoE) Chipset Market Estimates and Forecasts, By End Use (2020-2032) (USD Million)
11.3.2.7 Germany
11.3.2.7.1 Germany Power Over Ethernet (PoE) Chipset Market Estimates and Forecasts, By Type (2020-2032) (USD Million)
11.3.2.7.2 Germany Power Over Ethernet (PoE) Chipset Market Estimates and Forecasts, By Standard (2020-2032) (USD Million)
11.3.2.7.3 Germany Power Over Ethernet (PoE) Chipset Market Estimates and Forecasts, By Device (2020-2032) (USD Million)
11.3.2.7.4 Germany Power Over Ethernet (PoE) Chipset Market Estimates and Forecasts, By End Use (2020-2032) (USD Million)
11.3.2.8 France
11.3.2.8.1 France Power Over Ethernet (PoE) Chipset Market Estimates and Forecasts, By Type (2020-2032) (USD Million)
11.3.2.8.2 France Power Over Ethernet (PoE) Chipset Market Estimates and Forecasts, By Standard (2020-2032) (USD Million)
11.3.2.8.3 France Power Over Ethernet (PoE) Chipset Market Estimates and Forecasts, By Device (2020-2032) (USD Million)
11.3.2.8.4 France Power Over Ethernet (PoE) Chipset Market Estimates and Forecasts, By End Use (2020-2032) (USD Million)
11.3.2.9 UK
11.3.2.9.1 UK Power Over Ethernet (PoE) Chipset Market Estimates and Forecasts, By Type (2020-2032) (USD Million)
11.3.2.9.2 UK Power Over Ethernet (PoE) Chipset Market Estimates and Forecasts, By Standard (2020-2032) (USD Million)
11.3.2.9.3 UK Power Over Ethernet (PoE) Chipset Market Estimates and Forecasts, By Device (2020-2032) (USD Million)
11.3.2.9.4 UK Power Over Ethernet (PoE) Chipset Market Estimates and Forecasts, By End Use (2020-2032) (USD Million)
11.3.2.10 Italy
11.3.2.10.1 Italy Power Over Ethernet (PoE) Chipset Market Estimates and Forecasts, By Type (2020-2032) (USD Million)
11.3.2.10.2 Italy Power Over Ethernet (PoE) Chipset Market Estimates and Forecasts, By Standard (2020-2032) (USD Million)
11.3.2.10.3 Italy Power Over Ethernet (PoE) Chipset Market Estimates and Forecasts, By Device (2020-2032) (USD Million)
11.3.2.10.4 Italy Power Over Ethernet (PoE) Chipset Market Estimates and Forecasts, By End Use (2020-2032) (USD Million)
11.3.2.11 Spain
11.3.2.11.1 Spain Power Over Ethernet (PoE) Chipset Market Estimates and Forecasts, By Type (2020-2032) (USD Million)
11.3.2.11.2 Spain Power Over Ethernet (PoE) Chipset Market Estimates and Forecasts, By Standard (2020-2032) (USD Million)
11.3.2.11.3 Spain Power Over Ethernet (PoE) Chipset Market Estimates and Forecasts, By Device (2020-2032) (USD Million)
11.3.2.11.4 Spain Power Over Ethernet (PoE) Chipset Market Estimates and Forecasts, By End Use (2020-2032) (USD Million)
11.3.2.12 Netherlands
11.3.2.12.1 Netherlands Power Over Ethernet (PoE) Chipset Market Estimates and Forecasts, By Type (2020-2032) (USD Million)
11.3.2.12.2 Netherlands Power Over Ethernet (PoE) Chipset Market Estimates and Forecasts, By Standard (2020-2032) (USD Million)
11.3.2.12.3 Netherlands Power Over Ethernet (PoE) Chipset Market Estimates and Forecasts, By Device (2020-2032) (USD Million)
11.3.2.12.4 Netherlands Power Over Ethernet (PoE) Chipset Market Estimates and Forecasts, By End Use (2020-2032) (USD Million)
11.3.2.13 Switzerland
11.3.2.13.1 Switzerland Power Over Ethernet (PoE) Chipset Market Estimates and Forecasts, By Type (2020-2032) (USD Million)
11.3.2.13.2 Switzerland Power Over Ethernet (PoE) Chipset Market Estimates and Forecasts, By Standard (2020-2032) (USD Million)
11.3.2.13.3 Switzerland Power Over Ethernet (PoE) Chipset Market Estimates and Forecasts, By Device (2020-2032) (USD Million)
11.3.2.13.4 Switzerland Power Over Ethernet (PoE) Chipset Market Estimates and Forecasts, By End Use (2020-2032) (USD Million)
11.3.2.14 Austria
11.3.2.14.1 Austria Power Over Ethernet (PoE) Chipset Market Estimates and Forecasts, By Type (2020-2032) (USD Million)
11.3.2.14.2 Austria Power Over Ethernet (PoE) Chipset Market Estimates and Forecasts, By Standard (2020-2032) (USD Million)
11.3.2.14.3 Austria Power Over Ethernet (PoE) Chipset Market Estimates and Forecasts, By Device (2020-2032) (USD Million)
11.3.2.14.4 Austria Power Over Ethernet (PoE) Chipset Market Estimates and Forecasts, By End Use (2020-2032) (USD Million)
11.3.2.15 Rest of Western Europe
11.3.2.15.1 Rest of Western Europe Power Over Ethernet (PoE) Chipset Market Estimates and Forecasts, By Type (2020-2032) (USD Million)
11.3.2.15.2 Rest of Western Europe Power Over Ethernet (PoE) Chipset Market Estimates and Forecasts, By Standard (2020-2032) (USD Million)
11.3.2.15.3 Rest of Western Europe Power Over Ethernet (PoE) Chipset Market Estimates and Forecasts, By Device (2020-2032) (USD Million)
11.3.2.15.4 Rest of Western Europe Power Over Ethernet (PoE) Chipset Market Estimates and Forecasts, By End Use (2020-2032) (USD Million)
11.4 Asia Pacific
11.4.1 Trends Analysis
11.4.2 Asia Pacific Power Over Ethernet (PoE) Chipset Market Estimates and Forecasts, by Country (2020-2032) (USD Million)
11.4.3 Asia Pacific Power Over Ethernet (PoE) Chipset Market Estimates and Forecasts, By Type (2020-2032) (USD Million)
11.4.4 Asia Pacific Power Over Ethernet (PoE) Chipset Market Estimates and Forecasts, By Standard (2020-2032) (USD Million)
11.4.5 Asia Pacific Power Over Ethernet (PoE) Chipset Market Estimates and Forecasts, By Device (2020-2032) (USD Million)
11.4.6 Asia Pacific Power Over Ethernet (PoE) Chipset Market Estimates and Forecasts, By End Use (2020-2032) (USD Million)
11.4.7 China
11.4.7.1 China Power Over Ethernet (PoE) Chipset Market Estimates and Forecasts, By Type (2020-2032) (USD Million)
11.4.7.2 China Power Over Ethernet (PoE) Chipset Market Estimates and Forecasts, By Standard (2020-2032) (USD Million)
11.4.7.3 China Power Over Ethernet (PoE) Chipset Market Estimates and Forecasts, By Device (2020-2032) (USD Million)
11.4.7.4 China Power Over Ethernet (PoE) Chipset Market Estimates and Forecasts, By End Use (2020-2032) (USD Million)
11.4.8 India
11.4.8.1 India Power Over Ethernet (PoE) Chipset Market Estimates and Forecasts, By Type (2020-2032) (USD Million)
11.4.8.2 India Power Over Ethernet (PoE) Chipset Market Estimates and Forecasts, By Standard (2020-2032) (USD Million)
11.4.8.3 India Power Over Ethernet (PoE) Chipset Market Estimates and Forecasts, By Device (2020-2032) (USD Million)
11.4.8.4 India Power Over Ethernet (PoE) Chipset Market Estimates and Forecasts, By End Use (2020-2032) (USD Million)
11.4.9 Japan
11.4.9.1 Japan Power Over Ethernet (PoE) Chipset Market Estimates and Forecasts, By Type (2020-2032) (USD Million)
11.4.9.2 Japan Power Over Ethernet (PoE) Chipset Market Estimates and Forecasts, By Standard (2020-2032) (USD Million)
11.4.9.3 Japan Power Over Ethernet (PoE) Chipset Market Estimates and Forecasts, By Device (2020-2032) (USD Million)
11.4.9.4 Japan Power Over Ethernet (PoE) Chipset Market Estimates and Forecasts, By End Use (2020-2032) (USD Million)
11.4.10 South Korea
11.4.10.1 South Korea Power Over Ethernet (PoE) Chipset Market Estimates and Forecasts, By Type (2020-2032) (USD Million)
11.4.10.2 South Korea Power Over Ethernet (PoE) Chipset Market Estimates and Forecasts, By Standard (2020-2032) (USD Million)
11.4.10.3 South Korea Power Over Ethernet (PoE) Chipset Market Estimates and Forecasts, By Device (2020-2032) (USD Million)
11.4.10.4 South Korea Power Over Ethernet (PoE) Chipset Market Estimates and Forecasts, By End Use (2020-2032) (USD Million)
11.4.11 Vietnam
11.4.11.1 Vietnam Power Over Ethernet (PoE) Chipset Market Estimates and Forecasts, By Type (2020-2032) (USD Million)
11.4.11.2 Vietnam Power Over Ethernet (PoE) Chipset Market Estimates and Forecasts, By Standard (2020-2032) (USD Million)
11.4.11.3 Vietnam Power Over Ethernet (PoE) Chipset Market Estimates and Forecasts, By Device (2020-2032) (USD Million)
11.4.11.4 Vietnam Power Over Ethernet (PoE) Chipset Market Estimates and Forecasts, By End Use (2020-2032) (USD Million)
11.4.12 Singapore
11.4.12.1 Singapore Power Over Ethernet (PoE) Chipset Market Estimates and Forecasts, By Type (2020-2032) (USD Million)
11.4.12.2 Singapore Power Over Ethernet (PoE) Chipset Market Estimates and Forecasts, By Standard (2020-2032) (USD Million)
11.4.12.3 Singapore Power Over Ethernet (PoE) Chipset Market Estimates and Forecasts, By Device (2020-2032) (USD Million)
11.4.12.4 Singapore Power Over Ethernet (PoE) Chipset Market Estimates and Forecasts, By End Use (2020-2032) (USD Million)
11.4.13 Australia
11.4.13.1 Australia Power Over Ethernet (PoE) Chipset Market Estimates and Forecasts, By Type (2020-2032) (USD Million)
11.4.13.2 Australia Power Over Ethernet (PoE) Chipset Market Estimates and Forecasts, By Standard (2020-2032) (USD Million)
11.4.13.3 Australia Power Over Ethernet (PoE) Chipset Market Estimates and Forecasts, By Device (2020-2032) (USD Million)
11.4.13.4 Australia Power Over Ethernet (PoE) Chipset Market Estimates and Forecasts, By End Use (2020-2032) (USD Million)
11.4.14 Rest of Asia Pacific
11.4.14.1 Rest of Asia Pacific Power Over Ethernet (PoE) Chipset Market Estimates and Forecasts, By Type (2020-2032) (USD Million)
11.4.14.2 Rest of Asia Pacific Power Over Ethernet (PoE) Chipset Market Estimates and Forecasts, By Standard (2020-2032) (USD Million)
11.4.14.3 Rest of Asia Pacific Power Over Ethernet (PoE) Chipset Market Estimates and Forecasts, By Device (2020-2032) (USD Million)
11.4.14.4 Rest of Asia Pacific Power Over Ethernet (PoE) Chipset Market Estimates and Forecasts, By End Use (2020-2032) (USD Million)
11.5 Middle East and Africa
11.5.1 Middle East
11.5.1.1 Trends Analysis
11.5.1.2 Middle East Power Over Ethernet (PoE) Chipset Market Estimates and Forecasts, by Country (2020-2032) (USD Million)
11.5.1.3 Middle East Power Over Ethernet (PoE) Chipset Market Estimates and Forecasts, By Type (2020-2032) (USD Million)
11.5.1.4 Middle East Power Over Ethernet (PoE) Chipset Market Estimates and Forecasts, By Standard (2020-2032) (USD Million)
11.5.1.5 Middle East Power Over Ethernet (PoE) Chipset Market Estimates and Forecasts, By Device (2020-2032) (USD Million)
11.5.1.6 Middle East Power Over Ethernet (PoE) Chipset Market Estimates and Forecasts, By End Use (2020-2032) (USD Million)
11.5.1.7 UAE
11.5.1.7.1 UAE Power Over Ethernet (PoE) Chipset Market Estimates and Forecasts, By Type (2020-2032) (USD Million)
11.5.1.7.2 UAE Power Over Ethernet (PoE) Chipset Market Estimates and Forecasts, By Standard (2020-2032) (USD Million)
11.5.1.7.3 UAE Power Over Ethernet (PoE) Chipset Market Estimates and Forecasts, By Device (2020-2032) (USD Million)
11.5.1.7.4 UAE Power Over Ethernet (PoE) Chipset Market Estimates and Forecasts, By End Use (2020-2032) (USD Million)
11.5.1.8 Egypt
11.5.1.8.1 Egypt Power Over Ethernet (PoE) Chipset Market Estimates and Forecasts, By Type (2020-2032) (USD Million)
11.5.1.8.2 Egypt Power Over Ethernet (PoE) Chipset Market Estimates and Forecasts, By Standard (2020-2032) (USD Million)
11.5.1.8.3 Egypt Power Over Ethernet (PoE) Chipset Market Estimates and Forecasts, By Device (2020-2032) (USD Million)
11.5.1.8.4 Egypt Power Over Ethernet (PoE) Chipset Market Estimates and Forecasts, By End Use (2020-2032) (USD Million)
11.5.1.9 Saudi Arabia
11.5.1.9.1 Saudi Arabia Power Over Ethernet (PoE) Chipset Market Estimates and Forecasts, By Type (2020-2032) (USD Million)
11.5.1.9.2 Saudi Arabia Power Over Ethernet (PoE) Chipset Market Estimates and Forecasts, By Standard (2020-2032) (USD Million)
11.5.1.9.3 Saudi Arabia Power Over Ethernet (PoE) Chipset Market Estimates and Forecasts, By Device (2020-2032) (USD Million)
11.5.1.9.4 Saudi Arabia Power Over Ethernet (PoE) Chipset Market Estimates and Forecasts, By End Use (2020-2032) (USD Million)
11.5.1.10 Qatar
11.5.1.10.1 Qatar Power Over Ethernet (PoE) Chipset Market Estimates and Forecasts, By Type (2020-2032) (USD Million)
11.5.1.10.2 Qatar Power Over Ethernet (PoE) Chipset Market Estimates and Forecasts, By Standard (2020-2032) (USD Million)
11.5.1.10.3 Qatar Power Over Ethernet (PoE) Chipset Market Estimates and Forecasts, By Device (2020-2032) (USD Million)
11.5.1.10.4 Qatar Power Over Ethernet (PoE) Chipset Market Estimates and Forecasts, By End Use (2020-2032) (USD Million)
11.5.1.11 Rest of Middle East
11.5.1.11.1 Rest of Middle East Power Over Ethernet (PoE) Chipset Market Estimates and Forecasts, By Type (2020-2032) (USD Million)
11.5.1.11.2 Rest of Middle East Power Over Ethernet (PoE) Chipset Market Estimates and Forecasts, By Standard (2020-2032) (USD Million)
11.5.1.11.3 Rest of Middle East Power Over Ethernet (PoE) Chipset Market Estimates and Forecasts, By Device (2020-2032) (USD Million)
11.5.1.11.4 Rest of Middle East Power Over Ethernet (PoE) Chipset Market Estimates and Forecasts, By End Use (2020-2032) (USD Million)
11.5.2 Africa
11.5.2.1 Trends Analysis
11.5.2.2 Africa Power Over Ethernet (PoE) Chipset Market Estimates and Forecasts, by Country (2020-2032) (USD Million)
11.5.2.3 Africa Power Over Ethernet (PoE) Chipset Market Estimates and Forecasts, By Type (2020-2032) (USD Million)
11.5.2.4 Africa Power Over Ethernet (PoE) Chipset Market Estimates and Forecasts, By Standard (2020-2032) (USD Million)
11.5.2.5 Africa Power Over Ethernet (PoE) Chipset Market Estimates and Forecasts, By Device (2020-2032) (USD Million)
11.5.2.6 Africa Power Over Ethernet (PoE) Chipset Market Estimates and Forecasts, By End Use (2020-2032) (USD Million)
11.5.2.7 South Africa
11.5.2.7.1 South Africa Power Over Ethernet (PoE) Chipset Market Estimates and Forecasts, By Type (2020-2032) (USD Million)
11.5.2.7.2 South Africa Power Over Ethernet (PoE) Chipset Market Estimates and Forecasts, By Standard (2020-2032) (USD Million)
11.5.2.7.3 South Africa Power Over Ethernet (PoE) Chipset Market Estimates and Forecasts, By Device (2020-2032) (USD Million)
11.5.2.7.4 South Africa Power Over Ethernet (PoE) Chipset Market Estimates and Forecasts, By End Use (2020-2032) (USD Million)
11.5.2.8 Nigeria
11.5.2.8.1 Nigeria Power Over Ethernet (PoE) Chipset Market Estimates and Forecasts, By Type (2020-2032) (USD Million)
11.5.2.8.2 Nigeria Power Over Ethernet (PoE) Chipset Market Estimates and Forecasts, By Standard (2020-2032) (USD Million)
11.5.2.8.3 Nigeria Power Over Ethernet (PoE) Chipset Market Estimates and Forecasts, By Device (2020-2032) (USD Million)
11.5.2.8.4 Nigeria Power Over Ethernet (PoE) Chipset Market Estimates and Forecasts, By End Use (2020-2032) (USD Million)
11.5.2.9 Rest of Africa
11.5.2.9.1 Rest of Africa Power Over Ethernet (PoE) Chipset Market Estimates and Forecasts, By Type (2020-2032) (USD Million)
11.5.2.9.2 Rest of Africa Power Over Ethernet (PoE) Chipset Market Estimates and Forecasts, By Standard (2020-2032) (USD Million)
11.5.2.9.3 Rest of Africa Power Over Ethernet (PoE) Chipset Market Estimates and Forecasts, By Device (2020-2032) (USD Million)
11.5.2.9.4 Rest of Africa Power Over Ethernet (PoE) Chipset Market Estimates and Forecasts, By End Use (2020-2032) (USD Million)
11.6 Latin America
11.6.1 Trends Analysis
11.6.2 Latin America Power Over Ethernet (PoE) Chipset Market Estimates and Forecasts, by Country (2020-2032) (USD Million)
11.6.3 Latin America Power Over Ethernet (PoE) Chipset Market Estimates and Forecasts, By Type (2020-2032) (USD Million)
11.6.4 Latin America Power Over Ethernet (PoE) Chipset Market Estimates and Forecasts, By Standard (2020-2032) (USD Million)
11.6.5 Latin America Power Over Ethernet (PoE) Chipset Market Estimates and Forecasts, By Device (2020-2032) (USD Million)
11.6.6 Latin America Power Over Ethernet (PoE) Chipset Market Estimates and Forecasts, By End Use (2020-2032) (USD Million)
11.6.7 Brazil
11.6.7.1 Brazil Power Over Ethernet (PoE) Chipset Market Estimates and Forecasts, By Type (2020-2032) (USD Million)
11.6.7.2 Brazil Power Over Ethernet (PoE) Chipset Market Estimates and Forecasts, By Standard (2020-2032) (USD Million)
11.6.7.3 Brazil Power Over Ethernet (PoE) Chipset Market Estimates and Forecasts, By Device (2020-2032) (USD Million)
11.6.7.4 Brazil Power Over Ethernet (PoE) Chipset Market Estimates and Forecasts, By End Use (2020-2032) (USD Million)
11.6.8 Argentina
11.6.8.1 Argentina Power Over Ethernet (PoE) Chipset Market Estimates and Forecasts, By Type (2020-2032) (USD Million)
11.6.8.2 Argentina Power Over Ethernet (PoE) Chipset Market Estimates and Forecasts, By Standard (2020-2032) (USD Million)
11.6.8.3 Argentina Power Over Ethernet (PoE) Chipset Market Estimates and Forecasts, By Device (2020-2032) (USD Million)
11.6.8.4 Argentina Power Over Ethernet (PoE) Chipset Market Estimates and Forecasts, By End Use (2020-2032) (USD Million)
11.6.9 Colombia
11.6.9.1 Colombia Power Over Ethernet (PoE) Chipset Market Estimates and Forecasts, By Type (2020-2032) (USD Million)
11.6.9.2 Colombia Power Over Ethernet (PoE) Chipset Market Estimates and Forecasts, By Standard (2020-2032) (USD Million)
11.6.9.3 Colombia Power Over Ethernet (PoE) Chipset Market Estimates and Forecasts, By Device (2020-2032) (USD Million)
11.6.9.4 Colombia Power Over Ethernet (PoE) Chipset Market Estimates and Forecasts, By End Use (2020-2032) (USD Million)
11.6.10 Rest of Latin America
11.6.10.1 Rest of Latin America Power Over Ethernet (PoE) Chipset Market Estimates and Forecasts, By Type (2020-2032) (USD Million)
11.6.10.2 Rest of Latin America Power Over Ethernet (PoE) Chipset Market Estimates and Forecasts, By Standard (2020-2032) (USD Million)
11.6.10.3 Rest of Latin America Power Over Ethernet (PoE) Chipset Market Estimates and Forecasts, By Device (2020-2032) (USD Million)
11.6.10.4 Rest of Latin America Power Over Ethernet (PoE) Chipset Market Estimates and Forecasts, By End Use (2020-2032) (USD Million)
12. Company Profiles
12.1 Broadcom.
12.1.1 Company Overview
12.1.2 Financial
12.1.3 Products/ Services Offered
12.1.4 SWOT Analysis
12.2 Microsemi
12.2.1 Company Overview
12.2.2 Financial
12.2.3 Products/ Services Offered
12.2.4 SWOT Analysis
12.3 Marvell Technology.
12.3.1 Company Overview
12.3.2 Financial
12.3.3 Products/ Services Offered
12.3.4 SWOT Analysis
12.4 Texas Instruments.
12.4.1 Company Overview
12.4.2 Financial
12.4.3 Products/ Services Offered
12.4.4 SWOT Analysis
12.5 Linear Technology (now part of Analog Devices)
12.5.1 Company Overview
12.5.2 Financial
12.5.3 Products/ Services Offered
12.5.4 SWOT Analysis
12.6 Maxim Integrated
12.6.1 Company Overview
12.6.2 Financial
12.6.3 Products/ Services Offered
12.6.4 SWOT Analysis
12.7 ON Semiconductor
12.7.1 Company Overview
12.7.2 Financial
12.7.3 Products/ Services Offered
12.7.4 SWOT Analysis
12.8 STMicroelectronics
12.8.1 Company Overview
12.8.2 Financial
12.8.3 Products/ Services Offered
12.8.4 SWOT Analysis
12.9 Silicon Labs
12.9.1 Company Overview
12.9.2 Financial
12.9.3 Products/ Services Offered
12.9.4 SWOT Analysis
12.10 Microchip Technology
12.10.1 Company Overview
12.10.2 Financial
12.10.3 Products/ Services Offered
12.10.4 SWOT Analysis
13. Use Cases and Best Practices
14. Conclusion
An accurate research report requires proper strategizing as well as implementation. There are multiple factors involved in the completion of good and accurate research report and selecting the best methodology to compete the research is the toughest part. Since the research reports we provide play a crucial role in any company’s decision-making process, therefore we at SNS Insider always believe that we should choose the best method which gives us results closer to reality. This allows us to reach at a stage wherein we can provide our clients best and accurate investment to output ratio.
Each report that we prepare takes a timeframe of 350-400 business hours for production. Starting from the selection of titles through a couple of in-depth brain storming session to the final QC process before uploading our titles on our website we dedicate around 350 working hours. The titles are selected based on their current market cap and the foreseen CAGR and growth.
The 5 steps process:
Step 1: Secondary Research:
Secondary Research or Desk Research is as the name suggests is a research process wherein, we collect data through the readily available information. In this process we use various paid and unpaid databases which our team has access to and gather data through the same. This includes examining of listed companies’ annual reports, Journals, SEC filling etc. Apart from this our team has access to various associations across the globe across different industries. Lastly, we have exchange relationships with various university as well as individual libraries.

Step 2: Primary Research
When we talk about primary research, it is a type of study in which the researchers collect relevant data samples directly, rather than relying on previously collected data. This type of research is focused on gaining content specific facts that can be sued to solve specific problems. Since the collected data is fresh and first hand therefore it makes the study more accurate and genuine.
We at SNS Insider have divided Primary Research into 2 parts.
Part 1 wherein we interview the KOLs of major players as well as the upcoming ones across various geographic regions. This allows us to have their view over the market scenario and acts as an important tool to come closer to the accurate market numbers. As many as 45 paid and unpaid primary interviews are taken from both the demand and supply side of the industry to make sure we land at an accurate judgement and analysis of the market.
This step involves the triangulation of data wherein our team analyses the interview transcripts, online survey responses and observation of on filed participants. The below mentioned chart should give a better understanding of the part 1 of the primary interview.

Part 2: In this part of primary research the data collected via secondary research and the part 1 of the primary research is validated with the interviews from individual consultants and subject matter experts.
Consultants are those set of people who have at least 12 years of experience and expertise within the industry whereas Subject Matter Experts are those with at least 15 years of experience behind their back within the same space. The data with the help of two main processes i.e., FGDs (Focused Group Discussions) and IDs (Individual Discussions). This gives us a 3rd party nonbiased primary view of the market scenario making it a more dependable one while collation of the data pointers.
Step 3: Data Bank Validation
Once all the information is collected via primary and secondary sources, we run that information for data validation. At our intelligence centre our research heads track a lot of information related to the market which includes the quarterly reports, the daily stock prices, and other relevant information. Our data bank server gets updated every fortnight and that is how the information which we collected using our primary and secondary information is revalidated in real time.

Step 4: QA/QC Process
After all the data collection and validation our team does a final level of quality check and quality assurance to get rid of any unwanted or undesired mistakes. This might include but not limited to getting rid of the any typos, duplication of numbers or missing of any important information. The people involved in this process include technical content writers, research heads and graphics people. Once this process is completed the title gets uploader on our platform for our clients to read it.
Step 5: Final QC/QA Process:
This is the last process and comes when the client has ordered the study. In this process a final QA/QC is done before the study is emailed to the client. Since we believe in giving our clients a good experience of our research studies, therefore, to make sure that we do not lack at our end in any way humanly possible we do a final round of quality check and then dispatch the study to the client.
By Type
PoE Power Sourcing Equipment (PSE) Chipset
PoE Powered Devices (PD) Chipset
By Standard
802.3af standard
802.3at standard
802.3bt standard
By Device
Network Cameras
VoIP Phone
Ethernet Switch & Injector
Wireless Radio Access Point
Proximity Sensor
LED Lighting
By Standard
Commercial
Industrial
Residential
Request for Segment Customization as per your Business Requirement: Segment Customization Request
Regional Coverage:
North America
US
Canada
Mexico
Europe
Eastern Europe
Poland
Romania
Hungary
Turkey
Rest of Eastern Europe
Western Europe
Germany
France
UK
Italy
Spain
Netherlands
Switzerland
Austria
Rest of Western Europe
Asia Pacific
China
India
Japan
South Korea
Vietnam
Singapore
Australia
Rest of Asia Pacific
Middle East & Africa
Middle East
UAE
Egypt
Saudi Arabia
Qatar
Rest of Middle East
Africa
Nigeria
South Africa
Rest of Africa
Latin America
Brazil
Argentina
Colombia
Rest of Latin America
Request for Country Level Research Report: Country Level Customization Request
Available Customization
With the given market data, SNS Insider offers customization as per the company’s specific needs. The following customization options are available for the report:
Detailed Volume Analysis
Criss-Cross segment analysis (e.g. Product X Application)
Competitive Product Benchmarking
Geographic Analysis
Additional countries in any of the regions
Customized Data Representation
Detailed analysis and profiling of additional market players
The Variable Frequency Drive Market Size was valued at USD 24.65 Billion in 2023 and will reach $38.99 BN by 2032 and grow at a CAGR of 5.26% by 2024-2032.
The CMOS and sCMOS Image Sensor Market was valued at USD 22.8 Billion in 2023 and is expected to reach USD 39.7 Billion by 2032, growing at a CAGR of 6.39% from 2024-2032.
The LTE & 5G for Critical Communications Market size was USD 7.81 Billion in 2023 & expected a good growth by reaching USD 21.72 billion till end of 2032 at CAGR about 12.05% during forecast period 2024-2032.
The Non-Destructive Inspection Equipment Market was valued at USD 3.2 Billion in 2023 and is expected to reach USD 5.7 Billion by 2032, growing at a CAGR of 6.04% from 2024-2032.
The Refrigeration Coolers Market Size was valued at USD 3.70 Billion in 2023 and is expected to reach USD 6.26 Billion by 2032 at CAGR 6.02% from 2024-2032
The Electric Car Charger Market size was valued at USD 7.64 billion in 2023 and is expected to grow to USD 55.45 billion by 2032 and grow at a CAGR of 24.64 % over the forecast period of 2024-2032

Hi! Click one of our member below to chat on Phone
© 2025 All Rights Reserved by SNS Insider Pvt Ltd


