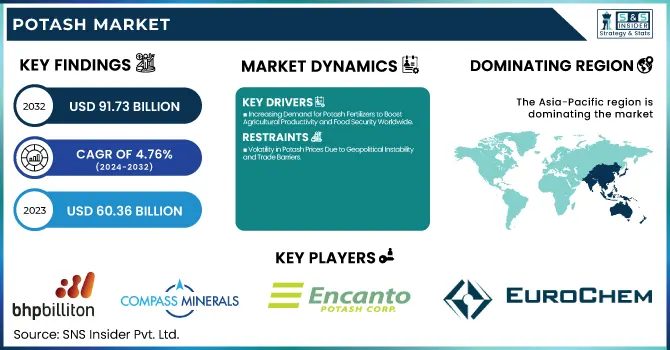
The Potash Market Size was valued at USD 60.36 Billion in 2023 and is expected to reach USD 91.73 Billion by 2032, growing at a CAGR of 4.76% over the forecast period of 2024-2032.
To Get more information on Potash Market - Request Free Sample Report
Factors such as increasing agricultural applications and technological development are driving the Potash market. Our report delves into the supply chain and logistics, examining surely what seems to complicate establishment, transport and distribution. It describes how supply and demand affect prices and how pricing reacts to demand fluctuations and geopolitical events. Aspects of sustainability and environmental considerations are discussed, noting the trend toward greener mining. Analyzing investment trends and financing mechanisms, the role of capital flows in market growth is presented. It also discusses quality control and certification standards, relating how this practice in compliance with regulations affects product quality and acceptance in the market.
Drivers
Increasing Demand for Potash Fertilizers to Boost Agricultural Productivity and Food Security Worldwide
The need for improved agricultural productivity is being driven by the growing global population coupled with increasing food demand. Potash is the main fertilizer that potatoes need to grow to their maximum potential, as it contains potassium, one of the three primary nutrients that promote the flowering and maturation of a wide variety of crops. These sustainable farming practices are driving the demand for Potash fertilizers even more, along with improved practices like precision agriculture, which helps optimize the application of Potash. Usage of Potash is expected to increase as it is an essential component when farmers aim to fulfil the requirements of a growing population and a diversifying diet. This driver is especially important in developing economies, where agricultural productivity is being raised to meet local and international demand. Moreover, regions with a high agricultural output like Asia-Pacific and North America will probably keep driving Potash consumption, a factor that will keep ensuring Potash's critical role in modern agriculture.
Restraints
Volatility in Potash Prices Due to Geopolitical Instability and Trade Barriers
Potash prices are market driven and very sensitive to global events or the geopolitical situation that can disrupt the stability of the market. Trade restrictions, tariffs, and sanctions imposed by nations or economic blocks can disrupt Potash's cross-border flow, resulting in supply shortages and price volatility. Political tensions and trade conflicts will have almost immediately negative repercussions on huge Potash-exporting nations including Canada and Russia. Additionally, external shock events, particularly heavy-handed supply chain disruptions (e.g., the COVID-19 pandemic), cause prices to move unpredictably, meaning consumers and producers cannot blindly trust the existing economic situation. This volatility poses problems for companies and farmers who depend on stable pricing to manage budgets and plan for the future.
Opportunities
Growing Demand for Potash in Emerging Economies to Improve Agricultural Productivity
Growing potash markets in emerging economies, especially in Asia-Pacific, Latin America, and Africa These regions are witnessing rapid population growth, urbanization, and transitions to more industrialised agricultural methods. These countries are now looking to Potash and other sophisticated fertilizers to improve their agricultural yields as they attempt to feed the larger populations. As the need for agricultural productivity grows, so too will demand for Potash in these regions. Moreover, the continued evolution of these economies will support the adoption of modern farming techniques and environmentally sustainable farming practices, which will contribute to the growth of demand for Potash fertilizers. The increasing middle class in these areas is also sparking dietary shifts, high agricultural output in such regions therefore continues to encourage high demand for potash.
Challenge
High Capital Investment Required for Potash Extraction and Processing Facilities
The mining and processing of potash requires large capital investment, especially in new extraction facilities and upgrading existing ones. Mining operations and refining technologies require significant initial investment, creating a barrier for new entrants in the market. Furthermore, maintaining production rates requires maintenance and investment in infrastructure, among other large-scale operations. This capital-intensive nature of the industry may hinder most small players from competing with the big names in the market, reducing the speed of diversification and innovation. The most challenging challenge for the Potash market is still the high capital costs.
By Product
By 2023, Potassium Chloride segment dominated and is anticipated to hold a market share of approximately 60.2% in the Potash market. Among the nutrients, potassium is mostly used in the forms of potassium chloride, which is the most common and effective source of potassium for agricultural applications like fertilizers. It has dominated due to its efficiency in increasing yields and soil health, establishing itself in the hearts of the farmers and agricultural producers. The widespread application of Potassium Chloride fertilizer has been corroborated by organizations like the Food and Agriculture Organization of the United Nations, which emphasize role of Potassium in crop nutrition. Moreover, the global growing demand for sustainable farming practices has increased Potassium Chloride demand, as it improves production of healthy crops with minimum environmental impact.
By Application
In 2023, the Fertilizers segment dominated the potash market with a market share of 70.5%. This is because fertilisers are essential for crop production and food security. The most crucial ingredient in fertilizers, especially Potash, boosts crop productivity, hence supplements plants' nutritional requirements. The World Bank and multiple agricultural associations have promoted the use of more fertilizer in developing areas to expand agricultural yield. Moreover, government initiatives to encourage sustainable agriculture and enhance food production have driven the demand for Potash-based fertilizers. Hence this indicates that the Fertilizers segment would remain the foremost application of Potash, highlighting its quintessential role in contemporary farming.
By End-use
In 2023, Agriculture segment dominated the Potash market in 2023 with a 68% market share. Its dominance is mainly due to the agricultural sector's heavy reliance on Potash in fertilization processes that improve crop productivity and soil fertility. Potash is essential for plant health, water holding and resistance to diseases, which is crucial for farmers who work to fulfil the world's increasing food needs. Various government initiatives and agricultural policies, like those advocated by the United States Department of Agriculture, have increasingly recognized the importance of nutrient management in agriculture, further expanding Potash adoption in farming practices. The major contribution by the agriculture segment shows that Potash is a primary ingredient to food security and sustainable agricultural practices around the globe.
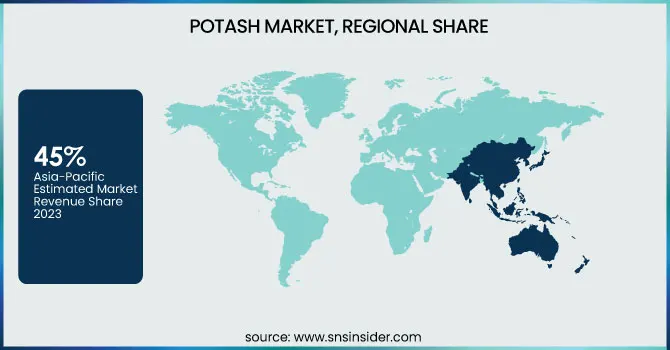
In 2023, the Asia Pacific region dominated the potash market and accounted for a market share of about 45% of the total revenue share. This dominance is primarily supported by the region's strong agricultural industry, which represents a notable share of Potash usage worldwide. Potash fertilizers are demanded primarily from countries like China and India, where agricultural output is important for feeding their massive populations. Potash is consumed primarily within the agriculture industry and China is both the largest producer and consumer of Potash, accounting for more than 20% of total Global Potash Demand as the country continues to prioritize crop yield improvement and food security. India being an agroeconomic, has a sizeable share of its fertilizer imports attributable to Potash. In addition, efforts taken by governments in these countries as well as increasing awareness regarding sustainable farming has accelerated the demand for Potash fertilizers. Moreover, urbanization trends in Southeast Asia also drive the demand for Potash to improve agricultural productivity. The Asia-Pacific market continues to dominate the Potash session due to the prevalence and importance of agriculture, a key component of the area that is continuing to industrialize.
Moreover, the North America region is projected to be the most lucrative during the forecast period, with a significant CAGR due to increasing imports of potash and growing demand from the agricultural sector. The growth is mainly due to the rising demand of Potash-based fertilizers in the US and Canada, owing to increasing focus on sustainable agriculture and improve crop productivity. As one of the largest agricultural producing countries in the world, the increase in Potash used most notably on corn and wheat has played a role in the increased demand in the U.S. The Canadian market still has a vital role at the local market. Increased investment in agricultural and innovation technologies in North America, which would propel the demand for Potash. As such, such government initiatives, specifically the US Farm Bill, are stimulating adoption of better and eco-friendly farming practices through subsidies, contributing to the Potash market growth in the region.
Get Customized Report as per Your Business Requirement - Enquiry Now
Key Players
BHP Billiton Ltd. (Muriate of Potash, Sulphate of Potash)
Compass Minerals Intl. Ltd. (Muriate of Potash, Salt)
Encanto Potash Corp. (EPC) (Potash Fertilizer)
Eurochem (Muriate of Potash, Sulphate of Potash)
Intrepid Potash Inc. (Muriate of Potash, Potash Fertilizer)
JSC Belaruskali (Muriate of Potash)
K+S Aktiengesellschaft (Muriate of Potash, Sulphate of Potash)
Mosaic Company (Muriate of Potash, Potash Fertilizer)
Nutrien (Muriate of Potash, Sulphate of Potash)
OAO Uralkali (Muriate of Potash)
Passport Potash (Potash Fertilizer)
Qinghai Salt Lake (Muriate of Potash, Potash Fertilizer)
Red Metal Ltd. (Potash Fertilizer)
Rio Tinto Ltd. (Muriate of Potash)
ICL (Muriate of Potash, Sulphate of Potash)
Vale (Potash Fertilizer, Muriate of Potash)
PotashCorp (now part of Nutrien) (Muriate of Potash, Potash Fertilizer)
Sinofert (Muriate of Potash)
Jiangxi Ganfeng Potash Co. (Muriate of Potash, Potash Fertilizer)
Arab Potash Company (Muriate of Potash, Potash Fertilizer)
Recent Highlights
April 2024: Uralkali announced the commissioning of a new potassium chloride production line at its Berezniki facility to increase its production capacity in response to the growing demand for fertilizers and taking the lead in the market.
March 2024: Eurochem assembled equipment for its new fertilizer plant in Nevinnomyssk; production capacity of nitrogen, phosphorus and potassium fertilizers increased to support agricultural growth.
| Report Attributes | Details |
|---|---|
| Market Size in 2023 | USD 31.88 Billion |
| Market Size by 2032 | USD 63.65 Billion |
| CAGR | CAGR of 7.99% From 2024 to 2032 |
| Base Year | 2023 |
| Forecast Period | 2024-2032 |
| Historical Data | 2020-2022 |
| Report Scope & Coverage | Market Size, Segments Analysis, Competitive Landscape, Regional Analysis, DROC & SWOT Analysis, Forecast Outlook |
| Key Segments | •By Product (Potassium Chloride, Potassium Sulphate, Potassium Nitrate, Others) •By Application (Fertilizers, Animal Feed, Industrial Chemicals, Others) •By End-use (Agriculture, Industrial, Food & Beverage, Others) |
| Regional Analysis/Coverage | North America (US, Canada, Mexico), Europe (Eastern Europe [Poland, Romania, Hungary, Turkey, Rest of Eastern Europe] Western Europe] Germany, France, UK, Italy, Spain, Netherlands, Switzerland, Austria, Rest of Western Europe]), Asia Pacific (China, India, Japan, South Korea, Vietnam, Singapore, Australia, Rest of Asia Pacific), Middle East & Africa (Middle East [UAE, Egypt, Saudi Arabia, Qatar, Rest of Middle East], Africa [Nigeria, South Africa, Rest of Africa], Latin America (Brazil, Argentina, Colombia, Rest of Latin America) |
| Company Profiles | Nutrien, Mosaic Company, Uralkali, JSC Belaruskali, Compass Minerals Intl. Ltd., Eurochem, BHP Billiton Ltd., K+S Aktiengesellschaft, Intrepid Potash Inc., Rio Tinto Ltd. and other key players |
Ans: The Potash Market was valued at USD 60.36 Billion in 2023 and is expected to reach USD 91.73 Billion by 2032, growing at a CAGR of 4.76% from 2024-2032.
Ans: The increasing demand for potash fertilizers, particularly in agriculture, and technological advancements are key drivers for the Potash Market.
Ans: The Fertilizers segment dominated the Potash Market with a share of 70.5% in 2023, driven by the increasing need for crop productivity and food security.
Ans: Asia Pacific dominated the Potash Market in 2023, with a share of about 45%, driven by the high agricultural demand in China and India.
Ans: North America is the fastest growing region for the Potash Market, with significant growth driven by increased demand from the agricultural sector, especially in the U.S. and Canada.
Table of Contents:
1. Introduction
1.1 Market Definition
1.2 Scope (Inclusion and Exclusions)
1.3 Research Assumptions
2. Executive Summary
2.1 Market Overview
2.2 Regional Synopsis
2.3 Competitive Summary
3. Research Methodology
3.1 Top-Down Approach
3.2 Bottom-up Approach
3.3. Data Validation
3.4 Primary Interviews
4. Market Dynamics Impact Analysis
4.1 Market Driving Factors Analysis
4.1.1 Drivers
4.1.2 Restraints
4.1.3 Opportunities
4.1.4 Challenges
4.2 PESTLE Analysis
4.3 Porter’s Five Forces Model
5. Statistical Insights and Trends Reporting
5.1 Supply Chain and Logistics Insights
5.2 Pricing Dynamics
5.3 Sustainability and Environmental Considerations
5.4 Investment Trends and Financing
5.5 Quality Control and Certification
6. Competitive Landscape
6.1 List of Major Companies, By Region
6.2 Market Share Analysis, By Region
6.3 Product Benchmarking
6.3.1 Product specifications and features
6.3.2 Pricing
6.4 Strategic Initiatives
6.4.1 Marketing and promotional activities
6.4.2 Distribution and supply chain strategies
6.4.3 Expansion plans and new product launches
6.4.4 Strategic partnerships and collaborations
6.5 Technological Advancements
6.6 Market Positioning and Branding
7. Potash Market Segmentation, by Product
7.1 Chapter Overview
7.2 Potassium Chloride
7.2.1 Potassium Chloride Market Trends Analysis (2020-2032)
7.2.2 Potassium Chloride Market Size Estimates and Forecasts to 2032 (USD Billion)
7.3 Potassium Sulphate
7.3.1 Potassium Sulphate Market Trends Analysis (2020-2032)
7.3.2 Potassium Sulphate Market Size Estimates and Forecasts to 2032 (USD Billion)
7.4 Potassium Nitrate
7.4.1 Potassium Nitrate Market Trends Analysis (2020-2032)
7.4.2 Potassium Nitrate Market Size Estimates and Forecasts to 2032 (USD Billion)
7.5 Others
7.5.1 Others Market Trends Analysis (2020-2032)
7.5.2 Others Market Size Estimates and Forecasts to 2032 (USD Billion)
8. Potash Market Segmentation, by Application
8.1 Chapter Overview
8.2 Fertilizers
8.2.1 Fertilizers Market Trends Analysis (2020-2032)
8.2.2 Fertilizers Market Size Estimates and Forecasts to 2032 (USD Billion)
8.3 Animal Feed
8.3.1 Animal Feed Market Trends Analysis (2020-2032)
8.3.2 Animal Feed Market Size Estimates and Forecasts to 2032 (USD Billion)
8.4 Industrial Chemicals
8.4.1 Industrial Chemicals Market Trends Analysis (2020-2032)
8.4.2 Industrial Chemicals Market Size Estimates and Forecasts to 2032 (USD Billion)
8.5 Others
8.5.1 Others Market Trends Analysis (2020-2032)
8.5.2 Others Market Size Estimates and Forecasts to 2032 (USD Billion)
9. Potash Market Segmentation, by End-use
9.1 Chapter Overview
9.2 Agriculture
9.2.1 Agriculture Market Trends Analysis (2020-2032)
9.2.2 Agriculture Market Size Estimates and Forecasts to 2032 (USD Billion)
9.3 Industrial
9.3.1 Industrial Market Trends Analysis (2020-2032)
9.3.2 Industrial Market Size Estimates and Forecasts to 2032 (USD Billion)
9.4 Food & Beverage
9.4.1 Food & Beverage Market Trends Analysis (2020-2032)
9.4.2 Food & Beverage Market Size Estimates and Forecasts to 2032 (USD Billion)
9.5 Others
9.5.1 Others Market Trends Analysis (2020-2032)
9.5.2 Others Market Size Estimates and Forecasts to 2032 (USD Billion)
10. Regional Analysis
10.1 Chapter Overview
10.2 North America
10.2.1 Trends Analysis
10.2.2 North America Potash Market Estimates and Forecasts, by Country (2020-2032) (USD Billion)
10.2.3 North America Potash Market Estimates and Forecasts, by Product (2020-2032) (USD Billion)
10.2.4 North America Potash Market Estimates and Forecasts, by Application (2020-2032) (USD Billion)
10.2.5 North America Potash Market Estimates and Forecasts, by End-use (2020-2032) (USD Billion)
10.2.6 USA
10.2.6.1 USA Potash Market Estimates and Forecasts, by Product (2020-2032) (USD Billion)
10.2.6.2 USA Potash Market Estimates and Forecasts, by Application (2020-2032) (USD Billion)
10.2.6.3 USA Potash Market Estimates and Forecasts, by End-use (2020-2032) (USD Billion)
10.2.7 Canada
10.2.7.1 Canada Potash Market Estimates and Forecasts, by Product (2020-2032) (USD Billion)
10.2.7.2 Canada Potash Market Estimates and Forecasts, by Application (2020-2032) (USD Billion)
10.2.7.3 Canada Potash Market Estimates and Forecasts, by End-use (2020-2032) (USD Billion)
10.2.8 Mexico
10.2.8.1 Mexico Potash Market Estimates and Forecasts, by Product (2020-2032) (USD Billion)
10.2.8.2 Mexico Potash Market Estimates and Forecasts, by Application (2020-2032) (USD Billion)
10.2.8.3 Mexico Potash Market Estimates and Forecasts, by End-use (2020-2032) (USD Billion)
10.3 Europe
10.3.1 Eastern Europe
10.3.1.1 Trends Analysis
10.3.1.2 Eastern Europe Potash Market Estimates and Forecasts, by Country (2020-2032) (USD Billion)
10.3.1.3 Eastern Europe Potash Market Estimates and Forecasts, by Product (2020-2032) (USD Billion)
10.3.1.4 Eastern Europe Potash Market Estimates and Forecasts, by Application (2020-2032) (USD Billion)
10.3.1.5 Eastern Europe Potash Market Estimates and Forecasts, by End-use (2020-2032) (USD Billion)
10.3.1.6 Poland
10.3.1.6.1 Poland Potash Market Estimates and Forecasts, by Product (2020-2032) (USD Billion)
10.3.1.6.2 Poland Potash Market Estimates and Forecasts, by Application (2020-2032) (USD Billion)
10.3.1.6.3 Poland Potash Market Estimates and Forecasts, by End-use (2020-2032) (USD Billion)
10.3.1.7 Romania
10.3.1.7.1 Romania Potash Market Estimates and Forecasts, by Product (2020-2032) (USD Billion)
10.3.1.7.2 Romania Potash Market Estimates and Forecasts, by Application (2020-2032) (USD Billion)
10.3.1.7.3 Romania Potash Market Estimates and Forecasts, by End-use (2020-2032) (USD Billion)
10.3.1.8 Hungary
10.3.1.8.1 Hungary Potash Market Estimates and Forecasts, by Product (2020-2032) (USD Billion)
10.3.1.8.2 Hungary Potash Market Estimates and Forecasts, by Application (2020-2032) (USD Billion)
10.3.1.8.3 Hungary Potash Market Estimates and Forecasts, by End-use (2020-2032) (USD Billion)
10.3.1.9 Turkey
10.3.1.9.1 Turkey Potash Market Estimates and Forecasts, by Product (2020-2032) (USD Billion)
10.3.1.9.2 Turkey Potash Market Estimates and Forecasts, by Application (2020-2032) (USD Billion)
10.3.1.9.3 Turkey Potash Market Estimates and Forecasts, by End-use (2020-2032) (USD Billion)
10.3.1.10 Rest of Eastern Europe
10.3.1.10.1 Rest of Eastern Europe Potash Market Estimates and Forecasts, by Product (2020-2032) (USD Billion)
10.3.1.10.2 Rest of Eastern Europe Potash Market Estimates and Forecasts, by Application (2020-2032) (USD Billion)
10.3.1.10.3 Rest of Eastern Europe Potash Market Estimates and Forecasts, by End-use (2020-2032) (USD Billion)
10.3.2 Western Europe
10.3.2.1 Trends Analysis
10.3.2.2 Western Europe Potash Market Estimates and Forecasts, by Country (2020-2032) (USD Billion)
10.3.2.3 Western Europe Potash Market Estimates and Forecasts, by Product (2020-2032) (USD Billion)
10.3.2.4 Western Europe Potash Market Estimates and Forecasts, by Application (2020-2032) (USD Billion)
10.3.2.5 Western Europe Potash Market Estimates and Forecasts, by End-use (2020-2032) (USD Billion)
10.3.2.6 Germany
10.3.2.6.1 Germany Potash Market Estimates and Forecasts, by Product (2020-2032) (USD Billion)
10.3.2.6.2 Germany Potash Market Estimates and Forecasts, by Application (2020-2032) (USD Billion)
10.3.2.6.3 Germany Potash Market Estimates and Forecasts, by End-use (2020-2032) (USD Billion)
10.3.2.7 France
10.3.2.7.1 France Potash Market Estimates and Forecasts, by Product (2020-2032) (USD Billion)
10.3.2.7.2 France Potash Market Estimates and Forecasts, by Application (2020-2032) (USD Billion)
10.3.2.7.3 France Potash Market Estimates and Forecasts, by End-use (2020-2032) (USD Billion)
10.3.2.8 UK
10.3.2.8.1 UK Potash Market Estimates and Forecasts, by Product (2020-2032) (USD Billion)
10.3.2.8.2 UK Potash Market Estimates and Forecasts, by Application (2020-2032) (USD Billion)
10.3.2.8.3 UK Potash Market Estimates and Forecasts, by End-use (2020-2032) (USD Billion)
10.3.2.9 Italy
10.3.2.9.1 Italy Potash Market Estimates and Forecasts, by Product (2020-2032) (USD Billion)
10.3.2.9.2 Italy Potash Market Estimates and Forecasts, by Application (2020-2032) (USD Billion)
10.3.2.9.3 Italy Potash Market Estimates and Forecasts, by End-use (2020-2032) (USD Billion)
10.3.2.10 Spain
10.3.2.10.1 Spain Potash Market Estimates and Forecasts, by Product (2020-2032) (USD Billion)
10.3.2.10.2 Spain Potash Market Estimates and Forecasts, by Application (2020-2032) (USD Billion)
10.3.2.10.3 Spain Potash Market Estimates and Forecasts, by End-use (2020-2032) (USD Billion)
10.3.2.11 Netherlands
10.3.2.11.1 Netherlands Potash Market Estimates and Forecasts, by Product (2020-2032) (USD Billion)
10.3.2.11.2 Netherlands Potash Market Estimates and Forecasts, by Application (2020-2032) (USD Billion)
10.3.2.11.3 Netherlands Potash Market Estimates and Forecasts, by End-use (2020-2032) (USD Billion)
10.3.2.12 Switzerland
10.3.2.12.1 Switzerland Potash Market Estimates and Forecasts, by Product (2020-2032) (USD Billion)
10.3.2.12.2 Switzerland Potash Market Estimates and Forecasts, by Application (2020-2032) (USD Billion)
10.3.2.12.3 Switzerland Potash Market Estimates and Forecasts, by End-use (2020-2032) (USD Billion)
10.3.2.13 Austria
10.3.2.13.1 Austria Potash Market Estimates and Forecasts, by Product (2020-2032) (USD Billion)
10.3.2.13.2 Austria Potash Market Estimates and Forecasts, by Application (2020-2032) (USD Billion)
10.3.2.13.3 Austria Potash Market Estimates and Forecasts, by End-use (2020-2032) (USD Billion)
10.3.2.14 Rest of Western Europe
10.3.2.14.1 Rest of Western Europe Potash Market Estimates and Forecasts, by Product (2020-2032) (USD Billion)
10.3.2.14.2 Rest of Western Europe Potash Market Estimates and Forecasts, by Application (2020-2032) (USD Billion)
10.3.2.14.3 Rest of Western Europe Potash Market Estimates and Forecasts, by End-use (2020-2032) (USD Billion)
10.4 Asia Pacific
10.4.1 Trends Analysis
10.4.2 Asia Pacific Potash Market Estimates and Forecasts, by Country (2020-2032) (USD Billion)
10.4.3 Asia Pacific Potash Market Estimates and Forecasts, by Product (2020-2032) (USD Billion)
10.4.4 Asia Pacific Potash Market Estimates and Forecasts, by Application (2020-2032) (USD Billion)
10.4.5 Asia Pacific Potash Market Estimates and Forecasts, by End-use (2020-2032) (USD Billion)
10.4.6 China
10.4.6.1 China Potash Market Estimates and Forecasts, by Product (2020-2032) (USD Billion)
10.4.6.2 China Potash Market Estimates and Forecasts, by Application (2020-2032) (USD Billion)
10.4.6.3 China Potash Market Estimates and Forecasts, by End-use (2020-2032) (USD Billion)
10.4.7 India
10.4.7.1 India Potash Market Estimates and Forecasts, by Product (2020-2032) (USD Billion)
10.4.7.2 India Potash Market Estimates and Forecasts, by Application (2020-2032) (USD Billion)
10.4.7.3 India Potash Market Estimates and Forecasts, by End-use (2020-2032) (USD Billion)
10.4.8 Japan
10.4.8.1 Japan Potash Market Estimates and Forecasts, by Product (2020-2032) (USD Billion)
10.4.8.2 Japan Potash Market Estimates and Forecasts, by Application (2020-2032) (USD Billion)
10.4.8.3 Japan Potash Market Estimates and Forecasts, by End-use (2020-2032) (USD Billion)
10.4.9 South Korea
10.4.9.1 South Korea Potash Market Estimates and Forecasts, by Product (2020-2032) (USD Billion)
10.4.9.2 South Korea Potash Market Estimates and Forecasts, by Application (2020-2032) (USD Billion)
10.4.9.3 South Korea Potash Market Estimates and Forecasts, by End-use (2020-2032) (USD Billion)
10.4.10 Vietnam
10.4.10.1 Vietnam Potash Market Estimates and Forecasts, by Product (2020-2032) (USD Billion)
10.4.10.2 Vietnam Potash Market Estimates and Forecasts, by Application (2020-2032) (USD Billion)
10.4.10.3 Vietnam Potash Market Estimates and Forecasts, by End-use (2020-2032) (USD Billion)
10.4.11 Singapore
10.4.11.1 Singapore Potash Market Estimates and Forecasts, by Product (2020-2032) (USD Billion)
10.4.11.2 Singapore Potash Market Estimates and Forecasts, by Application (2020-2032) (USD Billion)
10.4.11.3 Singapore Potash Market Estimates and Forecasts, by End-use (2020-2032) (USD Billion)
10.4.12 Australia
10.4.12.1 Australia Potash Market Estimates and Forecasts, by Product (2020-2032) (USD Billion)
10.4.12.2 Australia Potash Market Estimates and Forecasts, by Application (2020-2032) (USD Billion)
10.4.12.3 Australia Potash Market Estimates and Forecasts, by End-use (2020-2032) (USD Billion)
10.4.13 Rest of Asia Pacific
10.4.13.1 Rest of Asia Pacific Potash Market Estimates and Forecasts, by Product (2020-2032) (USD Billion)
10.4.13.2 Rest of Asia Pacific Potash Market Estimates and Forecasts, by Application (2020-2032) (USD Billion)
10.4.13.3 Rest of Asia Pacific Potash Market Estimates and Forecasts, by End-use (2020-2032) (USD Billion)
10.5 Middle East and Africa
10.5.1 Middle East
10.5.1.1 Trends Analysis
10.5.1.2 Middle East Potash Market Estimates and Forecasts, by Country (2020-2032) (USD Billion)
10.5.1.3 Middle East Potash Market Estimates and Forecasts, by Product (2020-2032) (USD Billion)
10.5.1.4 Middle East Potash Market Estimates and Forecasts, by Application (2020-2032) (USD Billion)
10.5.1.5 Middle East Potash Market Estimates and Forecasts, by End-use (2020-2032) (USD Billion)
10.5.1.6 UAE
10.5.1.6.1 UAE Potash Market Estimates and Forecasts, by Product (2020-2032) (USD Billion)
10.5.1.6.2 UAE Potash Market Estimates and Forecasts, by Application (2020-2032) (USD Billion)
10.5.1.6.3 UAE Potash Market Estimates and Forecasts, by End-use (2020-2032) (USD Billion)
10.5.1.7 Egypt
10.5.1.7.1 Egypt Potash Market Estimates and Forecasts, by Product (2020-2032) (USD Billion)
10.5.1.7.2 Egypt Potash Market Estimates and Forecasts, by Application (2020-2032) (USD Billion)
10.5.1.7.3 Egypt Potash Market Estimates and Forecasts, by End-use (2020-2032) (USD Billion)
10.5.1.8 Saudi Arabia
10.5.1.8.1 Saudi Arabia Potash Market Estimates and Forecasts, by Product (2020-2032) (USD Billion)
10.5.1.8.2 Saudi Arabia Potash Market Estimates and Forecasts, by Application (2020-2032) (USD Billion)
10.5.1.8.3 Saudi Arabia Potash Market Estimates and Forecasts, by End-use (2020-2032) (USD Billion)
10.5.1.9 Qatar
10.5.1.9.1 Qatar Potash Market Estimates and Forecasts, by Product (2020-2032) (USD Billion)
10.5.1.9.2 Qatar Potash Market Estimates and Forecasts, by Application (2020-2032) (USD Billion)
10.5.1.9.3 Qatar Potash Market Estimates and Forecasts, by End-use (2020-2032) (USD Billion)
10.5.1.10 Rest of Middle East
10.5.1.10.1 Rest of Middle East Potash Market Estimates and Forecasts, by Product (2020-2032) (USD Billion)
10.5.1.10.2 Rest of Middle East Potash Market Estimates and Forecasts, by Application (2020-2032) (USD Billion)
10.5.1.10.3 Rest of Middle East Potash Market Estimates and Forecasts, by End-use (2020-2032) (USD Billion)
10.5.2 Africa
10.5.2.1 Trends Analysis
10.5.2.2 Africa Potash Market Estimates and Forecasts, by Country (2020-2032) (USD Billion)
10.5.2.3 Africa Potash Market Estimates and Forecasts, by Product (2020-2032) (USD Billion)
10.5.2.4 Africa Potash Market Estimates and Forecasts, by Application (2020-2032) (USD Billion)
10.5.2.5 Africa Potash Market Estimates and Forecasts, by End-use (2020-2032) (USD Billion)
10.5.2.6 South Africa
10.5.2.6.1 South Africa Potash Market Estimates and Forecasts, by Product (2020-2032) (USD Billion)
10.5.2.6.2 South Africa Potash Market Estimates and Forecasts, by Application (2020-2032) (USD Billion)
10.5.2.6.3 South Africa Potash Market Estimates and Forecasts, by End-use (2020-2032) (USD Billion)
10.5.2.7 Nigeria
10.5.2.7.1 Nigeria Potash Market Estimates and Forecasts, by Product (2020-2032) (USD Billion)
10.5.2.7.2 Nigeria Potash Market Estimates and Forecasts, by Application (2020-2032) (USD Billion)
10.5.2.7.3 Nigeria Potash Market Estimates and Forecasts, by End-use (2020-2032) (USD Billion)
10.5.2.8 Rest of Africa
10.5.2.8.1 Rest of Africa Potash Market Estimates and Forecasts, by Product (2020-2032) (USD Billion)
10.5.2.8.2 Rest of Africa Potash Market Estimates and Forecasts, by Application (2020-2032) (USD Billion)
10.5.2.8.3 Rest of Africa Potash Market Estimates and Forecasts, by End-use (2020-2032) (USD Billion)
10.6 Latin America
10.6.1 Trends Analysis
10.6.2 Latin America Potash Market Estimates and Forecasts, by Country (2020-2032) (USD Billion)
10.6.3 Latin America Potash Market Estimates and Forecasts, by Product (2020-2032) (USD Billion)
10.6.4 Latin America Potash Market Estimates and Forecasts, by Application (2020-2032) (USD Billion)
10.6.5 Latin America Potash Market Estimates and Forecasts, by End-use (2020-2032) (USD Billion)
10.6.6 Brazil
10.6.6.1 Brazil Potash Market Estimates and Forecasts, by Product (2020-2032) (USD Billion)
10.6.6.2 Brazil Potash Market Estimates and Forecasts, by Application (2020-2032) (USD Billion)
10.6.6.3 Brazil Potash Market Estimates and Forecasts, by End-use (2020-2032) (USD Billion)
10.6.7 Argentina
10.6.7.1 Argentina Potash Market Estimates and Forecasts, by Product (2020-2032) (USD Billion)
10.6.7.2 Argentina Potash Market Estimates and Forecasts, by Application (2020-2032) (USD Billion)
10.6.7.3 Argentina Potash Market Estimates and Forecasts, by End-use (2020-2032) (USD Billion)
10.6.8 Colombia
10.6.8.1 Colombia Potash Market Estimates and Forecasts, by Product (2020-2032) (USD Billion)
10.6.8.2 Colombia Potash Market Estimates and Forecasts, by Application (2020-2032) (USD Billion)
10.6.8.3 Colombia Potash Market Estimates and Forecasts, by End-use (2020-2032) (USD Billion)
10.6.9 Rest of Latin America
10.6.9.1 Rest of Latin America Potash Market Estimates and Forecasts, by Product (2020-2032) (USD Billion)
10.6.9.2 Rest of Latin America Potash Market Estimates and Forecasts, by Application (2020-2032) (USD Billion)
10.6.9.3 Rest of Latin America Potash Market Estimates and Forecasts, by End-use (2020-2032) (USD Billion)
11. Company Profiles
11.1 Nutrien
11.1.1 Company Overview
11.1.2 Financial
11.1.3 Products/ Services Offered
11.1.4 SWOT Analysis
11.2 Mosaic Company
11.2.1 Company Overview
11.2.2 Financial
11.2.3 Products/ Services Offered
11.2.4 SWOT Analysis
11.3 Uralkali
11.3.1 Company Overview
11.3.2 Financial
11.3.3 Products/ Services Offered
11.3.4 SWOT Analysis
11.4 JSC Belaruskali
11.4.1 Company Overview
11.4.2 Financial
11.4.3 Products/ Services Offered
11.4.4 SWOT Analysis
11.5 Compass Minerals Intl. Ltd.
11.5.1 Company Overview
11.5.2 Financial
11.5.3 Products/ Services Offered
11.5.4 SWOT Analysis
11.6 Eurochem
11.6.1 Company Overview
11.6.2 Financial
11.6.3 Products/ Services Offered
11.6.4 SWOT Analysis
11.7 BHP Billiton Ltd.
11.7.1 Company Overview
11.7.2 Financial
11.7.3 Products/ Services Offered
11.7.4 SWOT Analysis
11.8 K+S Aktiengesellschaft
11.8.1 Company Overview
11.8.2 Financial
11.8.3 Products/ Services Offered
11.8.4 SWOT Analysis
11.9 Intrepid Potash Inc.
11.9.1 Company Overview
11.9.2 Financial
11.9.3 Products/ Services Offered
11.9.4 SWOT Analysis
11.10 Rio Tinto Ltd.
11.10.1 Company Overview
11.10.2 Financial
11.10.3 Products/ Services Offered
11.10.4 SWOT Analysis
12. Use Cases and Best Practices
13. Conclusion
An accurate research report requires proper strategizing as well as implementation. There are multiple factors involved in the completion of good and accurate research report and selecting the best methodology to compete the research is the toughest part. Since the research reports we provide play a crucial role in any company’s decision-making process, therefore we at SNS Insider always believe that we should choose the best method which gives us results closer to reality. This allows us to reach at a stage wherein we can provide our clients best and accurate investment to output ratio.
Each report that we prepare takes a timeframe of 350-400 business hours for production. Starting from the selection of titles through a couple of in-depth brain storming session to the final QC process before uploading our titles on our website we dedicate around 350 working hours. The titles are selected based on their current market cap and the foreseen CAGR and growth.
The 5 steps process:
Step 1: Secondary Research:
Secondary Research or Desk Research is as the name suggests is a research process wherein, we collect data through the readily available information. In this process we use various paid and unpaid databases which our team has access to and gather data through the same. This includes examining of listed companies’ annual reports, Journals, SEC filling etc. Apart from this our team has access to various associations across the globe across different industries. Lastly, we have exchange relationships with various university as well as individual libraries.

Step 2: Primary Research
When we talk about primary research, it is a type of study in which the researchers collect relevant data samples directly, rather than relying on previously collected data. This type of research is focused on gaining content specific facts that can be sued to solve specific problems. Since the collected data is fresh and first hand therefore it makes the study more accurate and genuine.
We at SNS Insider have divided Primary Research into 2 parts.
Part 1 wherein we interview the KOLs of major players as well as the upcoming ones across various geographic regions. This allows us to have their view over the market scenario and acts as an important tool to come closer to the accurate market numbers. As many as 45 paid and unpaid primary interviews are taken from both the demand and supply side of the industry to make sure we land at an accurate judgement and analysis of the market.
This step involves the triangulation of data wherein our team analyses the interview transcripts, online survey responses and observation of on filed participants. The below mentioned chart should give a better understanding of the part 1 of the primary interview.

Part 2: In this part of primary research the data collected via secondary research and the part 1 of the primary research is validated with the interviews from individual consultants and subject matter experts.
Consultants are those set of people who have at least 12 years of experience and expertise within the industry whereas Subject Matter Experts are those with at least 15 years of experience behind their back within the same space. The data with the help of two main processes i.e., FGDs (Focused Group Discussions) and IDs (Individual Discussions). This gives us a 3rd party nonbiased primary view of the market scenario making it a more dependable one while collation of the data pointers.
Step 3: Data Bank Validation
Once all the information is collected via primary and secondary sources, we run that information for data validation. At our intelligence centre our research heads track a lot of information related to the market which includes the quarterly reports, the daily stock prices, and other relevant information. Our data bank server gets updated every fortnight and that is how the information which we collected using our primary and secondary information is revalidated in real time.

Step 4: QA/QC Process
After all the data collection and validation our team does a final level of quality check and quality assurance to get rid of any unwanted or undesired mistakes. This might include but not limited to getting rid of the any typos, duplication of numbers or missing of any important information. The people involved in this process include technical content writers, research heads and graphics people. Once this process is completed the title gets uploader on our platform for our clients to read it.
Step 5: Final QC/QA Process:
This is the last process and comes when the client has ordered the study. In this process a final QA/QC is done before the study is emailed to the client. Since we believe in giving our clients a good experience of our research studies, therefore, to make sure that we do not lack at our end in any way humanly possible we do a final round of quality check and then dispatch the study to the client.
Key Segments:
By Product
Potassium Chloride
Potassium Sulphate
Potassium Nitrate
Others
By Application
Fertilizers
Animal Feed
Industrial Chemicals
Others
By End-use
Agriculture
Industrial
Food & Beverage
Others
Request for Segment Customization as per your Business Requirement: Segment Customization Request
Regional Coverage:
North America
US
Canada
Mexico
Europe
Eastern Europe
Poland
Romania
Hungary
Turkey
Rest of Eastern Europe
Western Europe
Germany
France
UK
Italy
Spain
Netherlands
Switzerland
Austria
Rest of Western Europe
Asia Pacific
China
India
Japan
South Korea
Vietnam
Singapore
Australia
Rest of Asia Pacific
Middle East & Africa
Middle East
UAE
Egypt
Saudi Arabia
Qatar
Rest of Middle East
Africa
Nigeria
South Africa
Rest of Africa
Latin America
Brazil
Argentina
Colombia
Rest of Latin America
Request for Country Level Research Report: Country Level Customization Request
Available Customization
With the given market data, SNS Insider offers customization as per the company’s specific needs. The following customization options are available for the report:
Detailed Volume Analysis
Criss-Cross segment analysis (e.g. Product X Application)
Competitive Product Benchmarking
Geographic Analysis
Additional countries in any of the regions
Customized Data Representation
Detailed analysis and profiling of additional market players
The Recycled Textiles Market size was valued at USD 5.76 billion in 2023 and is expected to reach USD 8.69 billion by 2032, at a CAGR of 4.70% from 2024-2032.
The Polycarbonate Diols Market size was USD 266.1 Million in 2023 & expected to reach USD 432.02 Million by 2032 and grow at a CAGR of 5.3% by 2024-2032.
The Fireproofing Materials Market Size was valued at USD 1.1 billion in 2023 and is expected to reach USD 2.5 billion by 2032 and grow at a CAGR of 9.9% over the forecast period 2024-2032.
The Synthetic Rubber Market Size was valued at USD 33.70 Billion in 2023 and is expected to reach USD 51.39 Billion by 2032, growing at a CAGR of 4.80% over the forecast period of 2024-2032.
The Biosurfactants Market Size was valued at USD 3.85 Billion in 2023 and is expected to reach USD 6.82 Billion by 2032, growing at a CAGR of 6.57% over the forecast period of 2024-2032.
The Waterproofing Membrane Market size was valued at USD 40.0 Billion in 2023 and is expected to reach USD 67.9 Billion by 2032, growing at a CAGR of 6.1% over the forecast period 2024-2032.

Hi! Click one of our member below to chat on Phone
© 2025 All Rights Reserved by SNS Insider Pvt Ltd


