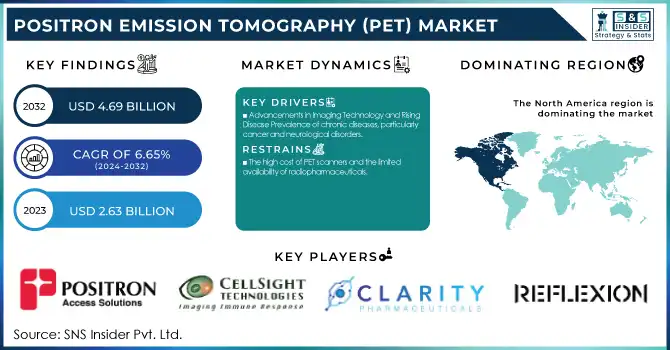
The Positron Emission Tomography (PET) Market size was estimated at USD 2.63 billion in 2023 and is expected to reach USD 4.69 billion by 2032 with a growing CAGR of 6.65% during the forecast period of 2024-2032.
Get More Information on Positron Emission Tomography Market - Request Sample Report
This study analyzes the incidence and prevalence of conditions that need PET scans, with regional variations in demand fuelled by rising cancer incidence and neurological disorders. The research discusses trends in prescribing by region, with emphasis on the increasing use of PET technology in diagnostics and personalized medicine. Device volume by region is reviewed, illustrating how PET adoption is increasing, especially in developed economies with sophisticated healthcare infrastructure. Moreover, medical spending by region is examined, with a view to how investments in diagnostic equipment and medical imaging are increasing, driven by government policies and private investment.
Drivers
Advancements in Imaging Technology and Rising Disease Prevalence of chronic diseases, particularly cancer and neurological disorders.
PET imaging is used extensively in the detection of early diseases, and oncology represents about 50% of PET applications. The World Health Organization reports that 19.3 million new cancer diagnoses were reported worldwide in 2020, which increased demand for high-accuracy imaging technologies such as PET/CT and PET/MRI. PET scans are also being increasingly used to diagnose and monitor neurological diseases like Alzheimer's and Parkinson's disease, which impact more than 55 million individuals globally.
Technological advances, such as digital PET scanners, time-of-flight technology, and artificial intelligence-based imaging analysis, are dramatically improving the accuracy, efficiency, and resolution of PET scans. AI-powered PET solutions, like those by GE Healthcare and Siemens Healthineers, enhance image interpretation, optimize radiation doses, and decrease scan times. The growing integration of PET with hybrid imaging devices such as PET/CT and PET/MRI further accelerated its applications in the clinical setting, thus becoming a chosen diagnostic tool for precision medicine. Furthermore, enhanced investments in research and the design of new PET tracers such as Gallium-68 and Amyloid-based radiotracers are stretching the applications of PET beyond cancer into neurology and cardiology. Therefore, the global proliferation of PET technology is projected to maintain its steady growth path with the driving forces of the demand for precise, non-invasive diagnostic tools for early disease identification and treatment planning.
Restraints
The high cost of PET scanners and the limited availability of radiopharmaceuticals.
The average PET/CT system is priced between USD 1 million and USD 3 million, and hence it is a high-capital-outlay investment for healthcare facilities, especially in developing countries. Apart from the initial cost, operational costs like maintenance, training, and regulations also contribute to the high total cost. The high cost reduces access to PET technology, particularly in low-income healthcare facilities.
The radiopharmaceutical supply chain, specifically short-lived PET tracers such as Fluorodeoxyglucose (FDG-18), is another major constraint. PET radiotracers are produced and distributed using specialized cyclotrons and radiopharmacies, which are not very common in most areas. Furthermore, PET tracers have extremely short half-lives—FDG-18 has a half-life of 110 minutes, and Carbon-11 has a half-life of 20 minutes—so they must be used immediately after production. This renders it challenging for health centers that are distant from manufacturing sites to implement PET imaging efficiently. In addition, rigorous regulatory approvals of new radiopharmaceuticals delay their launch into the market. Organizations like the FDA (United States), EMA (Europe), and IAEA enforce rigorous guidelines on PET tracer manufacturing, handling, and clinical application. These regulatory intricacies, with associated high expenses and logistical issues, limit the broad application of PET technology, especially in developing countries. Overcoming these cost and supply constraints will be essential to increasing access to PET imaging worldwide.
Opportunities
Growing Applications in Neurology and Emerging AI Integration
The PET market offers huge growth prospects, especially in neurology and AI-based imaging solutions. Historically dominated by oncology applications, PET imaging is increasingly growing in the diagnosis and monitoring of neurodegenerative diseases like Alzheimer's, Parkinson's, and epilepsy. Alzheimer's disease, according to the WHO, affects more than 55 million individuals across the globe and is anticipated to triple by the year 2050. PET scans, particularly amyloid and tau tracers, are fast becoming a critical early-stage diagnostic tool and monitor of dementia disorders. Firms such as Biogen and Lilly are creating PET-based diagnostics that are being designed to enhance the tailored treatment regimes of neurodegenerative conditions.
Another significant opportunity is artificial intelligence integration in PET imaging. AI-based software improves image reconstruction, minimizes scan times, and optimizes radiation doses, enhancing overall diagnostic efficiency. Siemens Healthineers, GE Healthcare, and Philips are at the forefront of developing AI-based PET solutions, which enable improved image clarity, automatic detection of lesions, and predictive analytics in oncology and neurology. Furthermore, the availability of new PET radiotracers, i.e., Gallium-68 and Fibroblast Activation Protein Inhibitors tracers, is growing PET's therapeutic applications beyond cancer into inflammatory diseases and fibrotic diseases. The increasing fascination with theranostics, i.e., the use of PET imaging and targeted therapies hand-in-hand, further solidifies PET's application in precision medicine. With growing AI and emerging tracers enabling better PET images, these breakthroughs will accelerate new market growth and broaden the scope of PET's applications to various disease groups.
Challenges
The shortage of skilled professionals required to operate advanced PET scanners and interpret complex imaging results.
PET imaging requires highly advanced equipment and techniques that need expertise in nuclear medicine, radiology, and radiopharmaceutical preparation. The number of trained professionals in these areas is not adequate to cater to increasing demand, especially in developing countries. The World Federation of Nuclear Medicine and Biology states that there is a worldwide shortage of nuclear medicine experts, which restricts the use of PET imaging on a large scale. The absence of trained staff routinely leads to diagnostic delays, misinterpretation, and ineffective application of PET technology, with an overall effect on patient care.
The growing need for PET imaging in oncology and neurology amplifies the need for efficient and stable tracer delivery systems. Players such as Jubilant Radiopharma and Cardinal Health are investing in PET radiopharmaceutical production to meet this need. Nevertheless, overcoming labor shortages and streamlining tracer logistics continue to be fundamental challenges that need to be met to facilitate continued growth and access to PET imaging globally.
By Product
PET/CT Systems led the PET market in 2023 with the highest market share of about 75%. The PET/CT system combines the functional imaging of Positron Emission Tomography (PET) with the high-resolution anatomical information provided by Computed Tomography (CT). This fusion provides unmatched diagnostic ability, particularly for intricate diseases like cancer, cardiovascular diseases, and neurological disorders. PET/CT scanners allow clinicians to measure both metabolic activity and the exact location of tumors or abnormalities within the body. The all-around imaging solution finds itself at the center of oncology, with the need for early detection and correct staging playing a critical part in treatment planning. PET/CT scanners are the preferred option in hospitals, research institutions, and diagnostic imaging centers because they are versatile, clinically proven, and cost-saving. In addition, the ongoing improvements in PET/CT technology, including enhanced resolution and shorter scan times, play a role in its continued market dominance.
The PET/MRI system, integrating the metabolic imaging feature of PET with the outstanding soft-tissue contrast of Magnetic Resonance Imaging (MRI), is the fastest-growing product category. This growth is fueled by the expanding demand for more accurate and non-invasive diagnostic tools, especially in oncology and neurology. PET/MRI is particularly valuable for brain imaging and cancer diagnosis, where high resolution and differentiation of soft tissue are paramount. As hospitals and specialized medical centers look for advanced diagnostic options, PET/MRI’s ability to deliver enhanced imaging with fewer risks and reduced radiation exposure is propelling its adoption. Over the next few years, PET/MRI systems are expected to expand rapidly, particularly in academic institutions and research-driven environments, as their value in early-stage diagnosis and longitudinal disease monitoring continues to be recognized.
By Application
Oncology was the largest application for PET scans, holding 57.4% of the market in 2023. PET is essential in oncology because it can identify metabolic alterations at an extremely early stage, well before structural changes are apparent using other imaging techniques. PET scanning plays a key role in the diagnosis, staging, and monitoring of the treatment of many forms of cancer, such as lung, breast, and lymphoma. It assists oncologists in evaluating tumor size, site, and distribution, offering key information for tailor-made treatment strategies. With cancer incidence increasing in the world, the need for efficient diagnostic means such as PET is growing incessantly. Further, with the evolution in PET technology, including its association with CT or MRI, the role of PET in precision oncology is fortified, rendering it an absolute must for diagnosis and continuous monitoring of cancer growth. The oncology segment will remain dominant in its position, driving the overall growth of the PET market further, boosted by growing investment in cancer diagnosis and expanding access to PET imaging technologies.
The neurological application of PET imaging is the most rapidly expanding sector, driven by the increasing incidence of neurodegenerative disorders like Alzheimer's, Parkinson's, and other cognitive impairments. PET scans allow clinicians to visualize brain function, identify abnormal brain metabolism, and evaluate the early phases of diseases that are frequently challenging to diagnose using standard imaging techniques. PET's potential for monitoring shifts in brain activity before structural impairments take hold is a particular advantage in detecting neurological disorders in their early stages. With an increasing aging of the world population and the rate of neurological illnesses rising, the place of PET in neurology is growing explosively. Lastly, with continuous innovations in imaging techniques and radionuclide tracers, the accuracy of PET in diagnosing brain pathology is being heightened, further bolstering its attraction to neurologists. This segment is poised to witness significant growth, fueled by an aging population and increased emphasis on early and precise neurological disease diagnosis, with a special focus on Alzheimer's and Parkinson's diseases.
By End User
Hospitals & Surgical Centers held the largest share of the PET market in 2023, with a 60% market share. These facilities are the main end-users of PET scanning systems because they have the volume and complexity of patients, which are the main reasons that they use such systems. Hospitals have the infrastructure and the budget to purchase and maintain sophisticated diagnostic tools like PET/CT and PET/MRI systems. PET imaging is pivotal in the diagnosis of intricate diseases including cancer, cardiovascular disease, and neurological disease, and hence a key resource in a clinical setup. Hospitals are also likely to host more patients, which compels the need for sophisticated imaging. Pre-surgical planning stands out as a key area where PET scans are specifically advantageous for surgical centers, providing surgeons with essential information regarding tumor localization, staging, and metabolic activity. With increasing focus on precision and personalized medicine, hospitals and surgical centers continue to be the leading players in the PET market, investing heavily in cutting-edge imaging technologies to remain competitive.
The Diagnostic & Imaging Clinics segment is the most rapidly growing end-user segment in the PET market. With outpatient services increasingly becoming popular, these specialty clinics provide patients with more accessible and cost-effective imaging services, frequently with quicker turnaround times than in traditional hospital environments. As diagnostic imaging demand grows, particularly in urban locations, these clinics are emerging as major players in the PET market. They serve a large spectrum of medical requirements, from basic cancer screenings to advanced brain and heart imaging, thus contributing to their increased market share. Diagnostic and imaging clinics also gain from improved PET technology that enables them to offer quality imaging at a reduced cost of operation. The growth of these clinics is also fueled by a trend toward medical tourism, with patients seeking quality diagnostic procedures in areas where prices are competitive. Diagnostic and imaging clinics are thus growing at a fast rate and are projected to continue their growth in the PET market.
In North America, the PET market was the largest in terms of share because of the high uptake of sophisticated medical technologies and the availability of well-developed healthcare infrastructure. The United States is a major contributor, with growing investments in healthcare and the extensive use of PET for oncology, cardiology, and neurology. The growth is also supported by favorable reimbursement policies and high awareness of early disease detection.
Europe followed closely, with nations such as Germany, the UK, and France taking the PET adoption pole. Europe's market enjoys robust healthcare infrastructures, an aging population base, and increasing cancer diagnoses. In addition, PET/MRI technology advancements are fueling immense interest in this market, especially for neurological and oncology applications.
The Asia-Pacific market is the fastest-growing, propelled by growing healthcare infrastructure, rising incidence of chronic disorders, and heightened demands for sophisticated diagnostics. China, Japan, and India are all investing heavily in healthcare technology, such as PET scanners, to respond to growing demands for precise diagnostics. Also, the growth of the medical tourism industry and government efforts to enhance access to healthcare are anticipated to drive the fast growth of the PET market in this region.
Get Customized Report as per Your Business Requirement - Request For Customized Report
Key Players
GE Healthcare - Discovery MI PET/CT, Discovery 710 PET/CT
Siemens Healthineers - Biograph Vision PET/CT, Biograph mCT PET/CT
Koninklijke Philips N.V. - Ingenuity TF PET/CT, Vereos Digital PET/CT
Canon Inc. - Aquilion ONE Genesis PET/CT
Shanghai United Imaging Healthcare Co., Ltd - uMI PET/CT, uEXPLORER PET/CT
Shimadzu Corporation - Trinias PET/CT
Positron Corporation - CardioPET, OncoPET
CellSight Technologies - CellSight PET Systems
RefleXion - RefleXion X1 PET/CT
Clarity Pharmaceuticals - SPECT/CT, ClarityPET
PETsys Electronics SA - PETsys PET Scanners
Blue Earth Diagnostics Limited - Axumin PET Imaging
Qubiotech Health Intelligence S.L. - Qubitech PET Solutions
Advanced Accelerator Applications - NETSPOT PET/CT
Lilly - Lilly PET Imaging Solutions
Agfa-Gevaert Group - PET/CT Systems
CMR Naviscan - PET Scanner, PET/CT Systems
Neusoft Corporation - Neusoft PET/CT Systems
Siemens - Biograph Vision PET/CT, Biograph mCT
Segamicorp - Segami PET/CT Solutions
ONCOVISION - Oncovision PET/CT Systems
MedX Holdings, Inc - MedX PET/CT Systems
Modus Medical Devices Inc. - PET/CT Systems
Radiology Oncology Systems - PET/CT Imaging Solutions
TOSHIBA CORPORATION - Aquilion PET/CT, PET/CT Systems
General Electric Company - Discovery PET/CT, Discovery MI PET/CT
Recent Developments
In Dec 2024, Continuum Therapeutics initiated patient dosing in its Phase 1b Positron Emission Tomography (PET) trial of PIPE-791. The trial aims to assess receptor occupancy of PIPE-791 in the brain and lungs across multiple cohorts using a PET tracer targeting the LPA1 receptor.
In June 2024, Jubilant Radiopharma's Radiopharmacies division announced a USD 50 million investment to expand its Positron Emission Tomography (PET) radiopharmaceutical manufacturing network. The company plans to add six new manufacturing sites across the United States, with operations expected to begin within 24 months.
| Report Attributes | Details |
| Market Size in 2023 | USD 2.63 billion |
| Market Size by 2032 | USD 4.69 Billion |
| CAGR | CAGR of 6.65% From 2024 to 2032 |
| Base Year | 2023 |
| Forecast Period | 2024-2032 |
| Historical Data | 2020-2022 |
| Report Scope & Coverage | Market Size, Segments Analysis, Competitive Landscape, Regional Analysis, DROC & SWOT Analysis, Forecast Outlook |
| Key Segments | • By Product [PET/CT Systems (Low Slice Scanners, Medium Slice Scanners, High Slice Scanners), PET/MRI Systems] • By Application [Oncology, Neurological, Cardiovascular, Other] • By End User [Hospital & Surgical Centers, Diagnostic & Imaging Clinics, Ambulatory Care Centers, Other End Users] |
| Regional Analysis/Coverage | North America (US, Canada, Mexico), Europe (Eastern Europe [Poland, Romania, Hungary, Turkey, Rest of Eastern Europe] Western Europe] Germany, France, UK, Italy, Spain, Netherlands, Switzerland, Austria, Rest of Western Europe]), Asia Pacific (China, India, Japan, South Korea, Vietnam, Singapore, Australia, Rest of Asia Pacific), Middle East & Africa (Middle East [UAE, Egypt, Saudi Arabia, Qatar, Rest of Middle East], Africa [Nigeria, South Africa, Rest of Africa], Latin America (Brazil, Argentina, Colombia, Rest of Latin America) |
| Company Profiles | GE Healthcare, Siemens Healthineers, Koninklijke Philips N.V., Canon Inc., Shanghai United Imaging Healthcare Co., Ltd, Shimadzu Corporation, Positron Corporation, CellSight Technologies, RefleXion, Clarity Pharmaceuticals, PETsys Electronics SA, Blue Earth Diagnostics Limited, Qubiotech Health Intelligence S.L., Advanced Accelerator Applications, Lilly, Agfa-Gevaert Group, CMR Naviscan, Neusoft Corporation, Segamicorp, ONCOVISION, MedX Holdings, Inc, Modus Medical Devices Inc., Radiology Oncology Systems, TOSHIBA CORPORATION, General Electric Company. |
Ans: The Positron Emission Tomography Market is expected to grow at 6.65% CAGR from 2024 to 2032.
Ans: According to our analysis, the Positron Emission Tomography Market is anticipated to reach USD 4.69 billion By 2032.
Ans: The leading participants in the GE Healthcare, Siemens Healthineers, Koninklijke Philips N.V., Canon Inc., Shanghai United Imaging Healthcare Co., Ltd, Shimadzu Corporation.
Ans: Increased cancer cases and expanding PET applications are the primary drivers of market growth.
Ans: Yes, you may request customization based on your company's needs.
1. Introduction
1.1 Market Definition
1.2 Scope (Inclusion and Exclusions)
1.3 Research & Academic Institutes Assumptions
2. Executive Summary
2.1 Market Overview
2.2 Regional Synopsis
2.3 Competitive Summary
3. Research & Academic Institutes Methodology
3.1 Top-Down Approach
3.2 Bottom-up Approach
3.3. Data Validation
3.4 Primary Interviews
4. Market Dynamics Impact Analysis
4.1 Market Driving Factors Analysis
4.1.1 Drivers
4.1.2 Restraints
4.1.3 Opportunities
4.1.4 Challenges
4.2 PESTLE Analysis
4.3 Porter’s Five Forces Model
5. Statistical Insights and Trends Reporting
5.1 Consumer Insights and Patient Demand
5.2 Technological Innovations
5.3 Healthcare Spending by Region (2023)
6. Competitive Landscape
6.1 List of Major Companies, By Region
6.2 Market Share Analysis, By Region
6.3 Product Benchmarking
6.3.1 Product specifications and features
6.3.2 Pricing
6.4 Strategic Initiatives
6.4.1 Marketing and Promotional Activities
6.4.2 Distribution and Supply Chain Strategies
6.4.3 Expansion plans and new Product launches
6.4.4 Strategic partnerships and collaborations
6.5 Technological Advancements
6.6 Market Positioning and Branding
7. Positron Emission Tomography Market Segmentation, by Product
7.1 Chapter Overview
7.2 PET/CT Systems
7.2.1 PET/CT Systems Market Trends Analysis (2020-2032)
7.2.2 PET/CT Systems Market Size Estimates and Forecasts to 2032 (USD Billion)
7.2.3 Low Slice Scanners
7.2.3.1 Low Slice Scanners Market Trends Analysis (2020-2032)
7.2.3.2 Low Slice Scanners Market Size Estimates and Forecasts to 2032 (USD Billion)
7.2.4 Medium Slice Scanners
7.2.4.1 Medium Slice Scanners Market Trends Analysis (2020-2032)
7.2.4.2 Medium Slice Scanners Market Size Estimates and Forecasts to 2032 (USD Billion)
7.2.5 High Slice Scanners
7.2.5.1 High Slice Scanners Market Trends Analysis (2020-2032)
7.2.5.2 High Slice Scanners Market Size Estimates and Forecasts to 2032 (USD Billion)
7.3 PET/MRI Systems
7.3.1 PET/MRI Systems Market Trends Analysis (2020-2032)
7.3.2 PET/MRI Systems Market Size Estimates and Forecasts to 2032 (USD Billion)
8. Positron Emission Tomography Market Segmentation, by Application
8.1 Chapter Overview
8.2 Oncology
8.2.1 Oncology Market Trends Analysis (2020-2032)
8.2.2 Oncology Market Size Estimates and Forecasts to 2032 (USD Billion)
8.3 Neurological
8.3.1 Neurological Market Trends Analysis (2020-2032)
8.3.2 Neurological Market Size Estimates and Forecasts to 2032 (USD Billion)
8.4 Cardiovascular
8.4.1 Cardiovascular Market Trends Analysis (2020-2032)
8.4.2 Cardiovascular Market Size Estimates and Forecasts to 2032 (USD Billion)
8.5 Other
8.5.1 Other Market Trends Analysis (2020-2032)
8.5.2 Other Market Size Estimates and Forecasts to 2032 (USD Billion)
9. Positron Emission Tomography Market Segmentation, by End User
9.1 Chapter Overview
9.2 Hospital & Surgical Centers
9.2.1 Hospital & Surgical Centers Market Trends Analysis (2020-2032)
9.2.2 Hospital & Surgical Centers Market Size Estimates and Forecasts to 2032 (USD Billion)
9.3 Diagnostic & Imaging Clinics
9.3.1 Diagnostic & Imaging Clinics Market Trends Analysis (2020-2032)
9.3.2 Diagnostic & Imaging Clinics Market Size Estimates and Forecasts to 2032 (USD Billion)
9.4 Ambulatory Care Centers
9.4.1 Ambulatory Care Centers Market Trends Analysis (2020-2032)
9.4.2 Ambulatory Care Centers Market Size Estimates and Forecasts to 2032 (USD Billion)
9.5 Other End Users
9.5.1 Other End Users Market Trends Analysis (2020-2032)
9.5.2 Other End Users Market Size Estimates and Forecasts to 2032 (USD Billion)
10. Regional Analysis
10.1 Chapter Overview
10.2 North America
10.2.1 Trends Analysis
10.2.2 North America Positron Emission Tomography Market Estimates and Forecasts, by Country (2020-2032) (USD Billion)
10.2.3 North America Positron Emission Tomography Market Estimates and Forecasts, by Product (2020-2032) (USD Billion)
10.2.4 North America Positron Emission Tomography Market Estimates and Forecasts, by Application (2020-2032) (USD Billion)
10.2.5 North America Positron Emission Tomography Market Estimates and Forecasts, by End User (2020-2032) (USD Billion)
10.2.6 USA
10.2.6.1 USA Positron Emission Tomography Market Estimates and Forecasts, by Product (2020-2032) (USD Billion)
10.2.6.2 USA Positron Emission Tomography Market Estimates and Forecasts, by Application (2020-2032) (USD Billion)
10.2.6.3 USA Positron Emission Tomography Market Estimates and Forecasts, by End User (2020-2032) (USD Billion)
10.2.7 Canada
10.2.7.1 Canada Positron Emission Tomography Market Estimates and Forecasts, by Product (2020-2032) (USD Billion)
10.2.7.2 Canada Positron Emission Tomography Market Estimates and Forecasts, by Application (2020-2032) (USD Billion)
10.2.7.3 Canada Positron Emission Tomography Market Estimates and Forecasts, by End User (2020-2032) (USD Billion)
10.2.8 Mexico
10.2.8.1 Mexico Positron Emission Tomography Market Estimates and Forecasts, by Product (2020-2032) (USD Billion)
10.2.8.2 Mexico Positron Emission Tomography Market Estimates and Forecasts, by Application (2020-2032) (USD Billion)
10.2.8.3 Mexico Positron Emission Tomography Market Estimates and Forecasts, by End User (2020-2032) (USD Billion)
10.3 Europe
10.3.1 Eastern Europe
10.3.1.1 Trends Analysis
10.3.1.2 Eastern Europe Positron Emission Tomography Market Estimates and Forecasts, by Country (2020-2032) (USD Billion)
10.3.1.3 Eastern Europe Positron Emission Tomography Market Estimates and Forecasts, by Product (2020-2032) (USD Billion)
10.3.1.4 Eastern Europe Positron Emission Tomography Market Estimates and Forecasts, by Application (2020-2032) (USD Billion)
10.3.1.5 Eastern Europe Positron Emission Tomography Market Estimates and Forecasts, by End User (2020-2032) (USD Billion)
10.3.1.6 Poland
10.3.1.6.1 Poland Positron Emission Tomography Market Estimates and Forecasts, by Product (2020-2032) (USD Billion)
10.3.1.6.2 Poland Positron Emission Tomography Market Estimates and Forecasts, by Application (2020-2032) (USD Billion)
10.3.1.6.3 Poland Positron Emission Tomography Market Estimates and Forecasts, by End User (2020-2032) (USD Billion)
10.3.1.7 Romania
10.3.1.7.1 Romania Positron Emission Tomography Market Estimates and Forecasts, by Product (2020-2032) (USD Billion)
10.3.1.7.2 Romania Positron Emission Tomography Market Estimates and Forecasts, by Application (2020-2032) (USD Billion)
10.3.1.7.3 Romania Positron Emission Tomography Market Estimates and Forecasts, by End User (2020-2032) (USD Billion)
10.3.1.8 Hungary
10.3.1.8.1 Hungary Positron Emission Tomography Market Estimates and Forecasts, by Product (2020-2032) (USD Billion)
10.3.1.8.2 Hungary Positron Emission Tomography Market Estimates and Forecasts, by Application (2020-2032) (USD Billion)
10.3.1.8.3 Hungary Positron Emission Tomography Market Estimates and Forecasts, by End User (2020-2032) (USD Billion)
10.3.1.9 turkey
10.3.1.9.1 Turkey Positron Emission Tomography Market Estimates and Forecasts, by Product (2020-2032) (USD Billion)
10.3.1.9.2 Turkey Positron Emission Tomography Market Estimates and Forecasts, by Application (2020-2032) (USD Billion)
10.3.1.9.3 Turkey Positron Emission Tomography Market Estimates and Forecasts, by End User (2020-2032) (USD Billion)
10.3.1.10 Rest of Eastern Europe
10.3.1.10.1 Rest of Eastern Europe Positron Emission Tomography Market Estimates and Forecasts, by Product (2020-2032) (USD Billion)
10.3.1.10.2 Rest of Eastern Europe Positron Emission Tomography Market Estimates and Forecasts, by Application (2020-2032) (USD Billion)
10.3.1.10.3 Rest of Eastern Europe Positron Emission Tomography Market Estimates and Forecasts, by End User (2020-2032) (USD Billion)
10.3.2 Western Europe
10.3.2.1 Trends Analysis
10.3.2.2 Western Europe Positron Emission Tomography Market Estimates and Forecasts, by Country (2020-2032) (USD Billion)
10.3.2.3 Western Europe Positron Emission Tomography Market Estimates and Forecasts, by Product (2020-2032) (USD Billion)
10.3.2.4 Western Europe Positron Emission Tomography Market Estimates and Forecasts, by Application (2020-2032) (USD Billion)
10.3.2.5 Western Europe Positron Emission Tomography Market Estimates and Forecasts, by End User (2020-2032) (USD Billion)
10.3.2.6 Germany
10.3.2.6.1 Germany Positron Emission Tomography Market Estimates and Forecasts, by Product (2020-2032) (USD Billion)
10.3.2.6.2 Germany Positron Emission Tomography Market Estimates and Forecasts, by Application (2020-2032) (USD Billion)
10.3.2.6.3 Germany Positron Emission Tomography Market Estimates and Forecasts, by End User (2020-2032) (USD Billion)
10.3.2.7 France
10.3.2.7.1 France Positron Emission Tomography Market Estimates and Forecasts, by Product (2020-2032) (USD Billion)
10.3.2.7.2 France Positron Emission Tomography Market Estimates and Forecasts, by Application (2020-2032) (USD Billion)
10.3.2.7.3 France Positron Emission Tomography Market Estimates and Forecasts, by End User (2020-2032) (USD Billion)
10.3.2.8 UK
10.3.2.8.1 UK Positron Emission Tomography Market Estimates and Forecasts, by Product (2020-2032) (USD Billion)
10.3.2.8.2 UK Positron Emission Tomography Market Estimates and Forecasts, by Application (2020-2032) (USD Billion)
10.3.2.8.3 UK Positron Emission Tomography Market Estimates and Forecasts, by End User (2020-2032) (USD Billion)
10.3.2.9 Italy
10.3.2.9.1 Italy Positron Emission Tomography Market Estimates and Forecasts, by Product (2020-2032) (USD Billion)
10.3.2.9.2 Italy Positron Emission Tomography Market Estimates and Forecasts, by Application (2020-2032) (USD Billion)
10.3.2.9.3 Italy Positron Emission Tomography Market Estimates and Forecasts, by End User (2020-2032) (USD Billion)
10.3.2.10 Spain
10.3.2.10.1 Spain Positron Emission Tomography Market Estimates and Forecasts, by Product (2020-2032) (USD Billion)
10.3.2.10.2 Spain Positron Emission Tomography Market Estimates and Forecasts, by Application (2020-2032) (USD Billion)
10.3.2.10.3 Spain Positron Emission Tomography Market Estimates and Forecasts, by End User (2020-2032) (USD Billion)
10.3.2.11 Netherlands
10.3.2.11.1 Netherlands Positron Emission Tomography Market Estimates and Forecasts, by Product (2020-2032) (USD Billion)
10.3.2.11.2 Netherlands Positron Emission Tomography Market Estimates and Forecasts, by Application (2020-2032) (USD Billion)
10.3.2.11.3 Netherlands Positron Emission Tomography Market Estimates and Forecasts, by End User (2020-2032) (USD Billion)
10.3.2.12 Switzerland
10.3.2.12.1 Switzerland Positron Emission Tomography Market Estimates and Forecasts, by Product (2020-2032) (USD Billion)
10.3.2.12.2 Switzerland Positron Emission Tomography Market Estimates and Forecasts, by Application (2020-2032) (USD Billion)
10.3.2.12.3 Switzerland Positron Emission Tomography Market Estimates and Forecasts, by End User (2020-2032) (USD Billion)
10.3.2.13 Austria
10.3.2.13.1 Austria Positron Emission Tomography Market Estimates and Forecasts, by Product (2020-2032) (USD Billion)
10.3.2.13.2 Austria Positron Emission Tomography Market Estimates and Forecasts, by Application (2020-2032) (USD Billion)
10.3.2.13.3 Austria Positron Emission Tomography Market Estimates and Forecasts, by End User (2020-2032) (USD Billion)
10.3.2.14 Rest of Western Europe
10.3.2.14.1 Rest of Western Europe Positron Emission Tomography Market Estimates and Forecasts, by Product (2020-2032) (USD Billion)
10.3.2.14.2 Rest of Western Europe Positron Emission Tomography Market Estimates and Forecasts, by Application (2020-2032) (USD Billion)
10.3.2.14.3 Rest of Western Europe Positron Emission Tomography Market Estimates and Forecasts, by End User (2020-2032) (USD Billion)
10.4 Asia Pacific
10.4.1 Trends Analysis
10.4.2 Asia Pacific Positron Emission Tomography Market Estimates and Forecasts, by Country (2020-2032) (USD Billion)
10.4.3 Asia Pacific Positron Emission Tomography Market Estimates and Forecasts, by Product (2020-2032) (USD Billion)
10.4.4 Asia Pacific Positron Emission Tomography Market Estimates and Forecasts, by Application (2020-2032) (USD Billion)
10.4.5 Asia Pacific Positron Emission Tomography Market Estimates and Forecasts, by End User (2020-2032) (USD Billion)
10.4.6 China
10.4.6.1 China Positron Emission Tomography Market Estimates and Forecasts, by Product (2020-2032) (USD Billion)
10.4.6.2 China Positron Emission Tomography Market Estimates and Forecasts, by Application (2020-2032) (USD Billion)
10.4.6.3 China Positron Emission Tomography Market Estimates and Forecasts, by End User (2020-2032) (USD Billion)
10.4.7 India
10.4.7.1 India Positron Emission Tomography Market Estimates and Forecasts, by Product (2020-2032) (USD Billion)
10.4.7.2 India Positron Emission Tomography Market Estimates and Forecasts, by Application (2020-2032) (USD Billion)
10.4.7.3 India Positron Emission Tomography Market Estimates and Forecasts, by End User (2020-2032) (USD Billion)
10.4.8 Japan
10.4.8.1 Japan Positron Emission Tomography Market Estimates and Forecasts, by Product (2020-2032) (USD Billion)
10.4.8.2 Japan Positron Emission Tomography Market Estimates and Forecasts, by Application (2020-2032) (USD Billion)
10.4.8.3 Japan Positron Emission Tomography Market Estimates and Forecasts, by End User (2020-2032) (USD Billion)
10.4.9 South Korea
10.4.9.1 South Korea Positron Emission Tomography Market Estimates and Forecasts, by Product (2020-2032) (USD Billion)
10.4.9.2 South Korea Positron Emission Tomography Market Estimates and Forecasts, by Application (2020-2032) (USD Billion)
10.4.9.3 South Korea Positron Emission Tomography Market Estimates and Forecasts, by End User (2020-2032) (USD Billion)
10.4.10 Vietnam
10.4.10.1 Vietnam Positron Emission Tomography Market Estimates and Forecasts, by Product (2020-2032) (USD Billion)
10.4.10.2 Vietnam Positron Emission Tomography Market Estimates and Forecasts, by Application (2020-2032) (USD Billion)
10.4.10.3 Vietnam Positron Emission Tomography Market Estimates and Forecasts, by End User (2020-2032) (USD Billion)
10.4.11 Singapore
10.4.11.1 Singapore Positron Emission Tomography Market Estimates and Forecasts, by Product (2020-2032) (USD Billion)
10.4.11.2 Singapore Positron Emission Tomography Market Estimates and Forecasts, by Application (2020-2032) (USD Billion)
10.4.11.3 Singapore Positron Emission Tomography Market Estimates and Forecasts, by End User (2020-2032) (USD Billion)
10.4.12 Australia
10.4.12.1 Australia Positron Emission Tomography Market Estimates and Forecasts, by Product (2020-2032) (USD Billion)
10.4.12.2 Australia Positron Emission Tomography Market Estimates and Forecasts, by Application (2020-2032) (USD Billion)
10.4.12.3 Australia Positron Emission Tomography Market Estimates and Forecasts, by End User (2020-2032) (USD Billion)
10.4.13 Rest of Asia Pacific
10.4.13.1 Rest of Asia Pacific Positron Emission Tomography Market Estimates and Forecasts, by Product (2020-2032) (USD Billion)
10.4.13.2 Rest of Asia Pacific Positron Emission Tomography Market Estimates and Forecasts, by Application (2020-2032) (USD Billion)
10.4.13.3 Rest of Asia Pacific Positron Emission Tomography Market Estimates and Forecasts, by End User (2020-2032) (USD Billion)
10.5 Middle East and Africa
10.5.1 Middle East
10.5.1.1 Trends Analysis
10.5.1.2 Middle East Positron Emission Tomography Market Estimates and Forecasts, by Country (2020-2032) (USD Billion)
10.5.1.3 Middle East Positron Emission Tomography Market Estimates and Forecasts, by Product (2020-2032) (USD Billion)
10.5.1.4 Middle East Positron Emission Tomography Market Estimates and Forecasts, by Application (2020-2032) (USD Billion)
10.5.1.5 Middle East Positron Emission Tomography Market Estimates and Forecasts, by End User (2020-2032) (USD Billion)
10.5.1.6 UAE
10.5.1.6.1 UAE Positron Emission Tomography Market Estimates and Forecasts, by Product (2020-2032) (USD Billion)
10.5.1.6.2 UAE Positron Emission Tomography Market Estimates and Forecasts, by Application (2020-2032) (USD Billion)
10.5.1.6.3 UAE Positron Emission Tomography Market Estimates and Forecasts, by End User (2020-2032) (USD Billion)
10.5.1.7 Egypt
10.5.1.7.1 Egypt Positron Emission Tomography Market Estimates and Forecasts, by Product (2020-2032) (USD Billion)
10.5.1.7.2 Egypt Positron Emission Tomography Market Estimates and Forecasts, by Application (2020-2032) (USD Billion)
10.5.1.7.3 Egypt Positron Emission Tomography Market Estimates and Forecasts, by End User (2020-2032) (USD Billion)
10.5.1.8 Saudi Arabia
10.5.1.8.1 Saudi Arabia Positron Emission Tomography Market Estimates and Forecasts, by Product (2020-2032) (USD Billion)
10.5.1.8.2 Saudi Arabia Positron Emission Tomography Market Estimates and Forecasts, by Application (2020-2032) (USD Billion)
10.5.1.8.3 Saudi Arabia Positron Emission Tomography Market Estimates and Forecasts, by End User (2020-2032) (USD Billion)
10.5.1.9 Qatar
10.5.1.9.1 Qatar Positron Emission Tomography Market Estimates and Forecasts, by Product (2020-2032) (USD Billion)
10.5.1.9.2 Qatar Positron Emission Tomography Market Estimates and Forecasts, by Application (2020-2032) (USD Billion)
10.5.1.9.3 Qatar Positron Emission Tomography Market Estimates and Forecasts, by End User (2020-2032) (USD Billion)
10.5.1.10 Rest of Middle East
10.5.1.10.1 Rest of Middle East Positron Emission Tomography Market Estimates and Forecasts, by Product (2020-2032) (USD Billion)
10.5.1.10.2 Rest of Middle East Positron Emission Tomography Market Estimates and Forecasts, by Application (2020-2032) (USD Billion)
10.5.1.10.3 Rest of Middle East Positron Emission Tomography Market Estimates and Forecasts, by End User (2020-2032) (USD Billion)
10.5.2 Africa
10.5.2.1 Trends Analysis
10.5.2.2 Africa Positron Emission Tomography Market Estimates and Forecasts, by Country (2020-2032) (USD Billion)
10.5.2.3 Africa Positron Emission Tomography Market Estimates and Forecasts, by Product (2020-2032) (USD Billion)
10.5.2.4 Africa Positron Emission Tomography Market Estimates and Forecasts, by Application (2020-2032) (USD Billion)
10.5.2.5 Africa Positron Emission Tomography Market Estimates and Forecasts, by End User (2020-2032) (USD Billion)
10.5.2.6 South Africa
10.5.2.6.1 South Africa Positron Emission Tomography Market Estimates and Forecasts, by Product (2020-2032) (USD Billion)
10.5.2.6.2 South Africa Positron Emission Tomography Market Estimates and Forecasts, by Application (2020-2032) (USD Billion)
10.5.2.6.3 South Africa Positron Emission Tomography Market Estimates and Forecasts, by End User (2020-2032) (USD Billion)
10.5.2.7 Nigeria
10.5.2.7.1 Nigeria Positron Emission Tomography Market Estimates and Forecasts, by Product (2020-2032) (USD Billion)
10.5.2.7.2 Nigeria Positron Emission Tomography Market Estimates and Forecasts, by Application (2020-2032) (USD Billion)
10.5.2.7.3 Nigeria Positron Emission Tomography Market Estimates and Forecasts, by End User (2020-2032) (USD Billion)
10.5.2.8 Rest of Africa
10.5.2.8.1 Rest of Africa Positron Emission Tomography Market Estimates and Forecasts, by Product (2020-2032) (USD Billion)
10.5.2.8.2 Rest of Africa Positron Emission Tomography Market Estimates and Forecasts, by Application (2020-2032) (USD Billion)
10.5.2.8.3 Rest of Africa Positron Emission Tomography Market Estimates and Forecasts, by End User (2020-2032) (USD Billion)
10.6 Latin America
10.6.1 Trends Analysis
10.6.2 Latin America Positron Emission Tomography Market Estimates and Forecasts, by Country (2020-2032) (USD Billion)
10.6.3 Latin America Positron Emission Tomography Market Estimates and Forecasts, by Product (2020-2032) (USD Billion)
10.6.4 Latin America Positron Emission Tomography Market Estimates and Forecasts, by Application (2020-2032) (USD Billion)
10.6.5 Latin America Positron Emission Tomography Market Estimates and Forecasts, by End User (2020-2032) (USD Billion)
10.6.6 Brazil
10.6.6.1 Brazil Positron Emission Tomography Market Estimates and Forecasts, by Product (2020-2032) (USD Billion)
10.6.6.2 Brazil Positron Emission Tomography Market Estimates and Forecasts, by Application (2020-2032) (USD Billion)
10.6.6.3 Brazil Positron Emission Tomography Market Estimates and Forecasts, by End User (2020-2032) (USD Billion)
10.6.7 Argentina
10.6.7.1 Argentina Positron Emission Tomography Market Estimates and Forecasts, by Product (2020-2032) (USD Billion)
10.6.7.2 Argentina Positron Emission Tomography Market Estimates and Forecasts, by Application (2020-2032) (USD Billion)
10.6.7.3 Argentina Positron Emission Tomography Market Estimates and Forecasts, by End User (2020-2032) (USD Billion)
10.6.8 Colombia
10.6.8.1 Colombia Positron Emission Tomography Market Estimates and Forecasts, by Product (2020-2032) (USD Billion)
10.6.8.2 Colombia Positron Emission Tomography Market Estimates and Forecasts, by Application (2020-2032) (USD Billion)
10.6.8.3 Colombia Positron Emission Tomography Market Estimates and Forecasts, by End User (2020-2032) (USD Billion)
10.6.9 Rest of Latin America
10.6.9.1 Rest of Latin America Positron Emission Tomography Market Estimates and Forecasts, by Product (2020-2032) (USD Billion)
10.6.9.2 Rest of Latin America Positron Emission Tomography Market Estimates and Forecasts, by Application (2020-2032) (USD Billion)
10.6.9.3 Rest of Latin America Positron Emission Tomography Market Estimates and Forecasts, by End User (2020-2032) (USD Billion)
11. Company Profiles
11.1 GE Healthcare
11.1.1 Company Overview
11.1.2 Financial
11.1.3 Product / Services Offered
11.1.4 SWOT Analysis
11.2 Siemens Healthineers
11.2.1 Company Overview
11.2.2 Financial
11.2.3 Product / Services Offered
11.2.4 SWOT Analysis
11.3 Koninklijke Philips N.V.
11.3.1 Company Overview
11.3.2 Financial
11.3.3 Product / Services Offered
11.3.4 SWOT Analysis
11.4 Shanghai United Imaging Healthcare Co., Ltd
11.4.1 Company Overview
11.4.2 Financial
11.4.3 Product / Services Offered
11.4.4 SWOT Analysis
11.5 Shimadzu Corporation
11.5.1 Company Overview
11.5.2 Financial
11.5.3 Product / Services Offered
11.5.4 SWOT Analysis
11.6 Clarity Pharmaceuticals
11.6.1 Company Overview
11.6.2 Financial
11.6.3 Product / Services Offered
11.6.4 SWOT Analysis
11.7 Advanced Accelerator Applications
11.7.1 Company Overview
11.7.2 Financial
11.7.3 Product / Services Offered
11.7.4 SWOT Analysis
11.8 ONCOVISION
11.8.1 Company Overview
11.8.2 Financial
11.8.3 Product / Services Offered
11.8.4 SWOT Analysis
11.9 MedX Holdings, Inc
11.9.1 Company Overview
11.9.2 Financial
11.9.3 Product / Services Offered
11.9.4 SWOT Analysis
11.10 TOSHIBA CORPORATION
11.10.1 Company Overview
11.10.2 Financial
11.10.3 Product / Services Offered
11.10.4 SWOT Analysis
12. Use Cases and Best Practices
13. Conclusion
An accurate research report requires proper strategizing as well as implementation. There are multiple factors involved in the completion of good and accurate research report and selecting the best methodology to compete the research is the toughest part. Since the research reports we provide play a crucial role in any company’s decision-making process, therefore we at SNS Insider always believe that we should choose the best method which gives us results closer to reality. This allows us to reach at a stage wherein we can provide our clients best and accurate investment to output ratio.
Each report that we prepare takes a timeframe of 350-400 business hours for production. Starting from the selection of titles through a couple of in-depth brain storming session to the final QC process before uploading our titles on our website we dedicate around 350 working hours. The titles are selected based on their current market cap and the foreseen CAGR and growth.
The 5 steps process:
Step 1: Secondary Research:
Secondary Research or Desk Research is as the name suggests is a research process wherein, we collect data through the readily available information. In this process we use various paid and unpaid databases which our team has access to and gather data through the same. This includes examining of listed companies’ annual reports, Journals, SEC filling etc. Apart from this our team has access to various associations across the globe across different industries. Lastly, we have exchange relationships with various university as well as individual libraries.

Step 2: Primary Research
When we talk about primary research, it is a type of study in which the researchers collect relevant data samples directly, rather than relying on previously collected data. This type of research is focused on gaining content specific facts that can be sued to solve specific problems. Since the collected data is fresh and first hand therefore it makes the study more accurate and genuine.
We at SNS Insider have divided Primary Research into 2 parts.
Part 1 wherein we interview the KOLs of major players as well as the upcoming ones across various geographic regions. This allows us to have their view over the market scenario and acts as an important tool to come closer to the accurate market numbers. As many as 45 paid and unpaid primary interviews are taken from both the demand and supply side of the industry to make sure we land at an accurate judgement and analysis of the market.
This step involves the triangulation of data wherein our team analyses the interview transcripts, online survey responses and observation of on filed participants. The below mentioned chart should give a better understanding of the part 1 of the primary interview.

Part 2: In this part of primary research the data collected via secondary research and the part 1 of the primary research is validated with the interviews from individual consultants and subject matter experts.
Consultants are those set of people who have at least 12 years of experience and expertise within the industry whereas Subject Matter Experts are those with at least 15 years of experience behind their back within the same space. The data with the help of two main processes i.e., FGDs (Focused Group Discussions) and IDs (Individual Discussions). This gives us a 3rd party nonbiased primary view of the market scenario making it a more dependable one while collation of the data pointers.
Step 3: Data Bank Validation
Once all the information is collected via primary and secondary sources, we run that information for data validation. At our intelligence centre our research heads track a lot of information related to the market which includes the quarterly reports, the daily stock prices, and other relevant information. Our data bank server gets updated every fortnight and that is how the information which we collected using our primary and secondary information is revalidated in real time.

Step 4: QA/QC Process
After all the data collection and validation our team does a final level of quality check and quality assurance to get rid of any unwanted or undesired mistakes. This might include but not limited to getting rid of the any typos, duplication of numbers or missing of any important information. The people involved in this process include technical content writers, research heads and graphics people. Once this process is completed the title gets uploader on our platform for our clients to read it.
Step 5: Final QC/QA Process:
This is the last process and comes when the client has ordered the study. In this process a final QA/QC is done before the study is emailed to the client. Since we believe in giving our clients a good experience of our research studies, therefore, to make sure that we do not lack at our end in any way humanly possible we do a final round of quality check and then dispatch the study to the client.
By Product
PET/CT Systems
Low Slice Scanners
Medium Slice Scanners
High Slice Scanners
PET/MRI Systems
By Application
Oncology
Neurological
Cardiovascular
Other
By End User
Hospital & Surgical Centers
Diagnostic & Imaging Clinics
Ambulatory Care Centers
Other End Users
Request for Segment Customization as per your Business Requirement: Segment Customization Request
Regional Coverage:
North America
US
Canada
Mexico
Europe
Eastern Europe
Poland
Romania
Hungary
Turkey
Rest of Eastern Europe
Western Europe
Germany
France
UK
Italy
Spain
Netherlands
Switzerland
Austria
Rest of Western Europe
Asia Pacific
China
India
Japan
South Korea
Vietnam
Singapore
Australia
Rest of Asia Pacific
Middle East & Africa
Middle East
UAE
Egypt
Saudi Arabia
Qatar
Rest of Middle East
Africa
Nigeria
South Africa
Rest of Africa
Latin America
Brazil
Argentina
Colombia
Rest of Latin America
Request for Country Level Research Report: Country Level Customization Request
Available Customization
With the given market data, SNS Insider offers customization as per the company’s specific needs. The following customization options are available for the report:
Detailed Volume Analysis
Criss-Cross segment analysis (e.g. Product X Application)
Competitive Product Benchmarking
Geographic Analysis
Additional countries in any of the regions
Customized Data Representation
Detailed analysis and profiling of additional market players
The Halal Empty Capsules Market was valued at USD 1.2 Billion in 2023 and is expected to reach USD 1.9 Billion by 2032, growing at a CAGR of 5.41% from 2024-2032.
The NGS based RNA Sequencing Market Size was USD 2.9 Billion in 2023 and will reach USD 12.1 Billion by 2032 and grow at a CAGR of 17.1% Over the Forecast Period of 2024-2032.
The Neonatal Respiratory Care Devices Market size was valued at USD 1.82 billion In 2023 & is estimated to reach USD 3.10 billion by 2032 and increase at a compound annual growth rate of 6.1% between 2024 and 2032.
The Neuroscience Market Size was valued at USD 35.3 billion in 2023 and is expected to reach USD 50.2 Billion by 2032, at 4.00% CAGR by 2024-2032
The Tissue Diagnostics Market Size was valued at USD 6.83 billion in 2023 and is expected to reach USD 14.18 billion by 2032 and grow at a CAGR of 8.47% over the forecast period 2024-2032.
The Generative AI in Healthcare Market size was valued at US$ 1.7 Bn in 2023 and is estimated to US$ 19.99 Bn by 2032 with a growing CAGR of 31.5% Over the Forecast Period of 2024-2032.

Hi! Click one of our member below to chat on Phone
© 2025 All Rights Reserved by SNS Insider Pvt Ltd


