Position Sensors Market Report Scope & Overview:
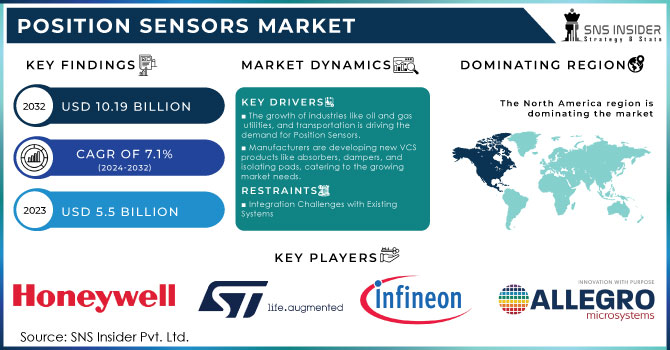
The Position Sensors Market was valued at USD 7.01 Billion in 2023 and is expected to reach USD 13.8 Billion by 2032, growing at a CAGR of 7.98% from 2024-2032. Position sensor adoption differs by region, driven by growing demand in automotive, industrial automation, and consumer electronics. Technological advancements focus on miniaturization, improved accuracy, and IoT integration for smart applications. Rising investments in semiconductor fabs and sensor manufacturing influence capacity utilization. Supply chain challenges stem from raw material shortages and logistical disruptions. The report also explores emerging trends such as AI-driven sensor calibration, the expansion of non-contact sensing technologies, and increasing demand for position sensors in autonomous systems.
Get E-PDF Sample Report on Position Sensors Market - Request Sample Report
Market Dynamics
Drivers
-
The increasing adoption of automation in industries, robotics, and smart factories is driving the demand for position sensors.
Position sensors are designed to meet the tremendous demand for the increasing use of automation, robotics, and the industry 4.0 approach in manufacturing. Ambient light sensors are critical for precise control, feedback systems, and real-time monitoring in industrial applications. Innovations in sensors — greater accuracy, paired with the Internet of Things are making them even more common. Industry demands tailored supply chains with minimal working capital, and more efficient and less costly operations and position sensors are key for process optimization. The demand for position sensors will continue for the next few years prompted by the growth in smart factories and the emergence of autonomous industrial equipment.
Restraints
-
The high cost of precision sensors, including maintenance and calibration, limits their adoption among small and medium enterprises.
The cost of high-precision position sensors remains a critical factor preventing more widespread use, even in the era of camera-based technologies. More complex sensors have highly advanced optical and laser-based systems that need special components and calibration that raise manufacturing costs. Such a cost aspect is a menace for small or medium-sized enterprises to incorporate such sensors into their practices. The cost goes further with maintenance and recalibration because that must also be performed. To overcome this limitation, the market participants are emphasizing the development of cost-effective sensor solutions along with better performance; however, cost is still a major stumbling block for a few industries.
Opportunities
-
Rising investments in autonomous driving and ADAS technologies are creating new opportunities for position sensor applications.
With the increasing penetration of autonomous vehicles and ADAS, the position sensor market is expected to witness considerable opportunities. They are essential for applications such as the automobile to navigate the vehicle, control the steering as well as prevent collisions. Demand for high-precision position sensors is anticipated to increase as various companies continue to invest in self-driving technology and smart transportation infrastructures. Since the automotive automation trend is a prompting one, sensor manufacturers have started working on innovative solutions with improved accuracy and reliability. With autonomous driving regulation evolving, the implementation of position sensors will grow with time in other vehicles.
Challenges
-
The market faces challenges due to raw material shortages, semiconductor supply constraints, and global trade restrictions.
Position sensor supply continues to be affected by supply chain disruptions and ongoing shortages of semiconductor and rare-earth materials. Sensor manufacturing and delivery schedules have been influenced due to shipping disruption; global trade limitations; geopolitical tensions, and changing raw materials prices. Manufacturers are working to reduce these risks by also diversifying their suppliers and increasing local production. An unfortunate consequence of this is that the availability of components still suffers and is hindering the growth of the market. Tackle these challenges and consider strategic sourcing and investment in alternative materials while remaining vigilant to ensure that your supply chain remains stable for position sensor suppliers.
Segment Analysis
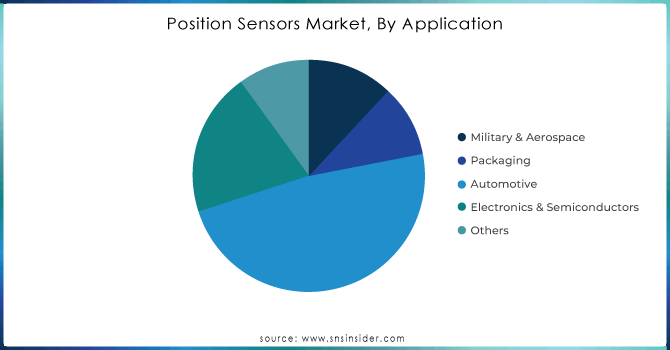
By Application
In 2023, the proximity segment dominated the market and accounted for 31% of revenue share. This growing installation of proximity sensors is fueling the growth of the global market for proximity sensors owing to the rising automation across the sectors. By accurately detecting objects and their positions and providing accurate responses automatically, proximity sensors enhance the efficiency and accuracy of processes, making them an indispensable part of the process. This aspect is anticipated to have a positive impact on the growth of the market as a proximity sensor is widely integrated into smart devices such as smartphones, smart watches, tablets, and other gadgets.
The photoelectric segment is expected to deliver the fastest CAGR during the forecast period. Contactless sensing techniques minimize the need for sensors to contact the object Safety of equipment and people in industrial environments is very important. Such non-contact detection capability of the sensors improves the safety measures in manufacturing and is gaining more popularity in manufacturing environments.
By End-Use
The automotive segment dominated the market in 2023 and accounted for a significant revenue share. as stringent safety rules require the installation of salient security services such as adaptive cruise control and electronic constancy control. The advent of vehicle electrification increases the demand for position sensors, which are used for the accurate placement of electric motors and other components.
The packaging segment is expected to register the fastest CAGR during the forecast period. Rising automotive automation and smart packaging solutions in various sectors are some of the key factors driving the increasing demand. This combination increasingly leads to faster, more efficient, and more accurate production while reducing labor costs and errors, so position sensors guarantee their precision. Moreover, the growing trend of e-commerce coupled with the rising demand for secure and dependable packaging to accommodate high shipment rates has led to an increase in the deployment of position sensors.
Get Customized Report as Per Your Business Requirement - Request For Customized Report
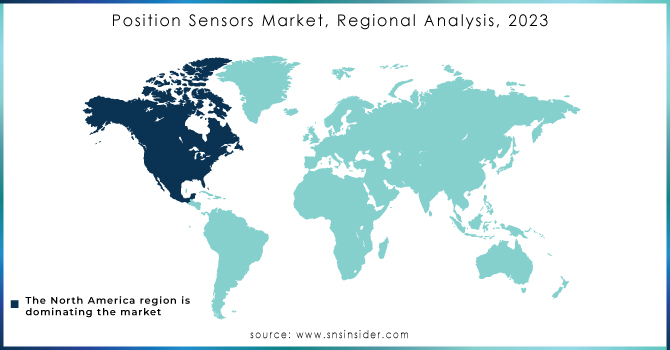
Regional Analysis
North America dominated the market and accounted for a revenue share of more than 37% in 2023. With a strengthening automobile industry in the region, ADAS and autonomous driving technologies, which need accurate position-sensing capabilities to perform tasks such as navigation, separation, and vehicle control, are dominating the market space. Moreover, the increasing industrial automation and IoT acceptance in various industries such as manufacturing, healthcare, and logistics sectors is fueling the demand for precise and reliable position sensors.
Asia Pacific region is expected to register fastest CAGR during the period of forecast. Rapid industrialization and urbanization in countries like China, India, and Japan are enhancing the demand for advanced automation and control systems, in which position sensors are widely used. The other key contributing factor is the growing automotive sector, which has adopted more advanced sensor technologies for effective vehicle control and safety applications in recent years.
Key players
The major key players along with their products are
-
Honeywell – SMART Position Sensor
-
TE Connectivity– Linear Position Sensors
-
ams OSRAM – NanEyeC Optical Sensor
-
STMicroelectronics – VL53L5CX Time-of-Flight Sensor
-
Infineon Technologies – XENSIV Magnetic Position Sensors
-
Allegro Microsystem– A1339 Angle Position Sensor
-
Texas Instruments – LDC1614 Inductive Position Sensor
-
Renesas Electronics – IPS2550 Inductive Position Sensor
-
MTS Systems (A PCB Company) – Temposonics Magnetostrictive Sensors
-
SICK AG – TTK70 Absolute Positioning System
-
Novotechnik – RFC-4800 Touchless Rotary Sensor
-
Baumer Group – BTL7 Magnetostrictive Position Sensor
-
Bourns, Inc. – EMS22A Non-Contacting Encoder
-
IFM Electronic – TP Series Position Sensors
-
Heidenhain – LIC 4100 Absolute Linear Encoder
Recent Developments
-
January 2024: Aeva introduced the Atlas FMCW LiDAR sensor, designed to provide high-resolution perception for autonomous vehicles, with Daimler Trucks as its first customer.
-
January 2024: RoboSense held its initial public offering (IPO) on the Hong Kong Stock Exchange, raising HK$990 million and achieving a valuation of HK$19.3 billion, making it the world's highest-valued LiDAR company at that time.
-
March 2024: Mitsubishi Electric Mobility acquired a 15% stake in Seeing Machines, a developer of eye-tracking and driver-monitoring.
| Report Attributes | Details |
|---|---|
| Market Size in 2023 | USD 7.01 Billion |
| Market Size by 2032 | USD 13.8 Billion |
| CAGR | CAGR of 7.98% From 2024 to 2032 |
| Base Year | 2023 |
| Forecast Period | 2024-2032 |
| Historical Data | 2020-2022 |
| Report Scope & Coverage | Market Size, Segments Analysis, Competitive Landscape, Regional Analysis, DROC & SWOT Analysis, Forecast Outlook |
| Key Segments | • By Application (Photoelectric, Linear, Proximity, Rotary, Others) • By End-Use (Automotive, Military & Aerospace, Electronic & Semiconductor, Packaging, Others) |
| Regional Analysis/Coverage | North America (US, Canada, Mexico), Europe (Eastern Europe [Poland, Romania, Hungary, Turkey, Rest of Eastern Europe] Western Europe] Germany, France, UK, Italy, Spain, Netherlands, Switzerland, Austria, Rest of Western Europe]), Asia Pacific (China, India, Japan, South Korea, Vietnam, Singapore, Australia, Rest of Asia Pacific), Middle East & Africa (Middle East [UAE, Egypt, Saudi Arabia, Qatar, Rest of Middle East], Africa [Nigeria, South Africa, Rest of Africa], Latin America (Brazil, Argentina, Colombia, Rest of Latin America) |
| Company Profiles | Honeywell, TE Connectivity, ams OSRAM, STMicroelectronics, Infineon Technologies, Allegro MicroSystems, Texas Instruments, Renesas Electronics, MTS Systems (A PCB Company), SICK AG, Novotechnik, Baumer Group, Bourns, Inc., IFM Electronic, Heidenhain |
