Portable Gas Chromatograph Market Report Scope & Overview:
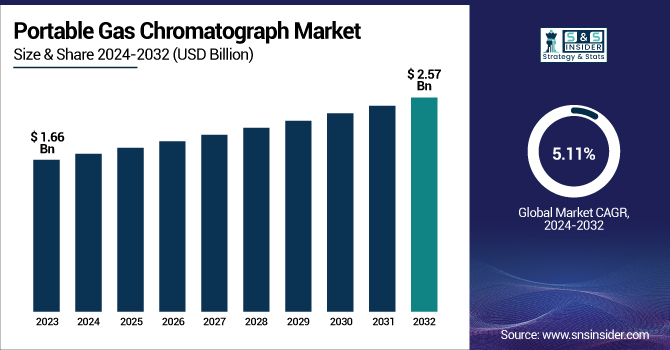
The Portable Gas Chromatograph Market Size was valued at USD 1.66 Billion in 2023 and is expected to reach USD 2.57 Billion by 2032 and grow at a CAGR of 5.11% over the forecast period 2024-2032.
To Get more information on Portable Gas Chromatograph Market - Request Free Sample Report
The portable Gas Chromatograph Market is being propelled by rapid growth due to growing demand for on-site testing in environmental analysis, petrochemicals, food safety testing, and forensic analysis. Growth in regulatory needs, technology innovations in miniaturized GC instruments, and demand for real-time testing are fueling market growth. The leaders are emphasizing innovation, IoT, and AI integration to deliver higher performance Major constraints are high expense and technical nature, but compact and easy-to-use models leading to growing adoption in industries.
The U.S. Portable Gas Chromatograph Market stood at USD 0.45 billion in 2023 and is anticipated to increase to USD 0.65 billion by 2032, growing at a CAGR of 4.38% from 2024 to 2032.
The US Portable Gas Chromatograph Market is growing steadily, fueled by strict environmental regulations, innovation in on-site chemical analysis, and growing applications in oil & gas, pharmaceuticals, and food safety applications. The air quality monitoring standards set by the EPA and strict safety protocols in the manufacturing workplace are some of the growth inducers. Advances such as IoT-integrated and miniaturized GC systems are enhancing efficiency and mobility. The availability of market leaders and increasing R&D investments in real-time gas detection solutions further drive market growth.
Portable Gas Chromatograph Market Dynamics
Key Drivers:
-
Stringent Environmental Regulations Drive Adoption of Portable Gas Chromatographs for On-Site Air Quality and Emission Monitoring
Growing enforcement of eco-friendly regulations by organizations such as the U.S. EPA is driving the market for portable GCs in chemicals, oil & gas, and environmental monitoring segments. Tightening emission standards mandates real-time quality checks of the air, thereby necessitating the use of portable GC systems to analyze on location. Portable GCs facilitate the prompt identification of industrial pollutants, VOCs, and greenhouse gases and assist companies in meeting environmental norms. Moreover, increasing awareness regarding airborne pollutants and occupational health risks is further fueling the use of portable gas chromatography for precise and quick field testing.
Restraint:
-
High Equipment Costs and Maintenance Expenses Limit the Adoption of Portable Gas Chromatographs in Cost-Sensitive Markets
Though having numerous benefits, portable gas chromatographs are still costly, thus restricted in adoption within cost-sensitive markets. The huge initial investment to procure sophisticated GC systems, together with ongoing expenditures on calibration, consumables, and maintenance, presents a big hurdle. Further, the necessity of employing professional experts to drive and analyze GC results contributes to operational costs. Most small and medium-sized businesses (SMEs) are reluctant to invest in premium portable GC systems because of financial constraints, resulting in delayed adoption rates. Manufacturers need to emphasize cost-efficient solutions and ease of use to increase market penetration across various industries.
Opportunity:
-
Technological Advancements in Miniaturized and IoT-Enabled Gas Chromatographs Create Growth Prospects for Real-Time Remote Monitoring Applications
The convergence of the Internet of Things (IoT), artificial intelligence (AI), and miniaturization technology is transforming the portable gas chromatograph industry. The miniaturization of wireless-enabled GC systems enables real-time remote monitoring of air quality and industrial emissions. The advancements in usability, efficiency, and data analysis capabilities make portable GCs more accessible in many industries. Firms that invest in AI-based analytical instruments and automated gas detection equipment are getting ahead. Increasing demand for intelligent, networked GC solutions in environmental protection, industrial hygiene, and homeland security offers a profitable growth opportunity.
Challenge:
-
Technical Complexity and Skilled Workforce Shortage Restrict the Efficient Use of Portable Gas Chromatographs in Field Applications
Field gas chromatographs demand specialized expertise to operate, calibrate, and interpret data properly, posing a problem in field use. The lack of experienced analytical chemists and technicians impacts the adoption rate, especially in the developing world and small-scale industries. Moreover, complexity in the analysis of multi-component gases, sample preparation, and instrument diagnosis discourages non-specialists from obtaining accurate results. Training sessions and easy-to-use software developments are essential in bridging this gap. Firms have to pay attention to streamlining processes and providing simple interfaces so that portable GC technology may be effectively utilized by more users.
Portable Gas Chromatograph Market Segments Analysis
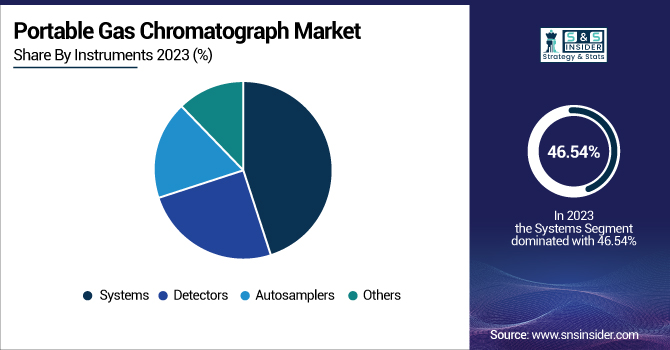
By Instruments
The Systems segment contributed the highest revenue share of 46.54% in 2023 in the Portable Gas Chromatograph Market due to the growing need for combined, high-performance gas chromatography (GC) solutions in oil & gas, pharmaceutical, and environmental monitoring industries. Top companies like Agilent Technologies, Thermo Fisher Scientific, and Shimadzu Corporation have launched cutting-edge portable GC systems with increased automation and real-time data analysis. For instance, Agilent's 990 Micro GC provides fast, on-site gas analysis and Shimadzu's Tracera GC System improves trace-level compound detection. The combination of IoT and AI-driven data processing further enhances market growth, advancing on-the-move gas analysis functionality.
The Detectors segment is anticipated to hold the maximum CAGR of 6.53% due to increasing demand for accurate, selective, and compact detectors in handheld GC systems. Emerging technologies in the form of photoionization detectors (PIDs), flame ionization detectors (FIDs), and mass spectrometry (MS) integration are changing the face of real-time gas analysis. Shimadzu Corporation has just launched higher sensitivity GC-MS detectors for detecting trace-level VOCs, and Thermo Fisher's Instant Connect Detector technology allows for increased portability and performance. These are driving applications in environmental analysis, hazardous material identification, and industrial safety, so detectors are now an integral part of the growing portable gas chromatograph market.
By Type
The Gas-Liquid Chromatography (GLC) sector led the Portable Gas Chromatograph Market in 2023 with a revenue share of 56.20% because it is used extensively in environmental analysis, pharmaceutical, and petrochemical sectors. Players such as Agilent Technologies and PerkinElmer have introduced high-performance miniaturized GC systems for better column efficiency to improve portability and performance. For instance, Agilent's 990 Micro GC provides on-site, real-time gas analysis, which makes it perfect for hazardous gas detection and industrial emissions monitoring.
The Gas-Solid Chromatography (GSC) segment is anticipated to develop at the highest CAGR of 6.10% during the forecast period, driven by its better efficiency in separating permanent gases and volatile compounds. Organizations such as Shimadzu and Thermo Fisher Scientific are advancing in portable solid-state GC technology with the launch of instruments based on adsorption-based separation methods for accurate on-site gas analysis. For instance, Shimadzu's Tracera GC System offers improved trace gas detection, and it is very effective for homeland security and industrial safety applications
By End-Use Industries
The Oil & Gas industry leads the Portable Gas Chromatograph Market with a 41.27% revenue share in 2023, owing to intense environmental policies and the requirement for instant analysis of gases in refineries, pipelines, and exploration camps. Agilent Technologies and PerkinElmer have come up with portable GC systems targeted at finding hydrocarbons, volatile organic compounds (VOCs), and toxic gases in industrial settings. For example, Agilent's 990 Micro GC delivers on-site analysis of gas composition with high accuracy, minimizing oilfield downtime. The need for fast, field-portable chromatographs is growing, meeting EPA emissions regulations and improving operational efficiency in the oil & gas industry.
Food & Agriculture is the most rapidly growing sector in the Portable Gas Chromatograph Market, with an expected 6.25% CAGR growth due to increased food safety concerns, pesticide residue, and detection of contaminants. Shimadzu Corporation and Thermo Fisher Scientific are driving portable GC technology for on-site analysis of food adulterants and agrochemicals. For instance, Shimadzu's Tracera GC System facilitates trace-level detection of food impurities, supporting regulatory compliance with FDA and EFSA regulations. The use of portable gas chromatography in supply chains and at the farm level is leading the way in innovation, providing faster and more efficient quality control for the food and agriculture industry.
Portable Gas Chromatograph Market Regional Outlook
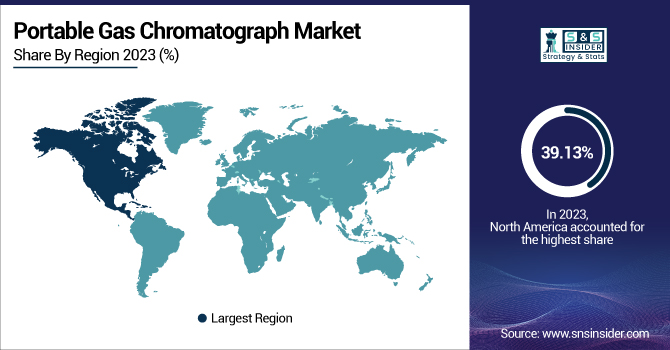
North America led the Portable Gas Chromatograph Market with 39.13% of total revenue in 2023, fueled by strict environmental regulations, robust industrial demand, and technological advancements in real-time gas analysis technologies. The U.S. Environmental Protection Agency (EPA) requires stringent air quality monitoring, driving adoption in oil & gas, pharmaceutical, and food safety applications. Major players like Agilent Technologies and Thermo Fisher Scientific have introduced sophisticated handheld GC systems featuring higher IoT integration and automation. For example, Agilent's 990 Micro GC provides fast gas analysis for field use.
Asia-Pacific is experiencing the highest CAGR of 6.88%, which is being spurred by industrial growth, growing environmental issues, and rising demand for on-site gas analysis solutions. China, India, and Japan are driving market growth through strict emission standards and growing demand for petrochemicals and food safety. Prominent players like Shimadzu Corporation and PerkinElmer have launched affordable, high-performance portable GC models to meet expanding demand. Shimadzu's Tracera GC offers increased sensitivity for environmental analysis. The quick uptake of intelligent analytical equipment in developing economies, aided by government policies, is driving Asia-Pacific's leadership in portable GC technology.
Get Customized Report as per Your Business Requirement - Enquiry Now
Portable Gas Chromatograph Market Key Players are:
-
Emerson Electric Co. – (Rosemount CT5100, Gas Chromatograph 370XA)
-
ABB Ltd. – (PGC5000 Series, EasyLine EL3000)
-
Siemens AG – (MAXUM Edition II, MicroSAM)
-
Elster Group GmbH – (EnCal 3000, GasLab Q2)
-
SRI Instruments – (8610C Gas Chromatograph, Model 310 Portable GC)
-
Agilent Technologies, Inc. – (490 Micro GC, 8860 GC System)
-
Thermo Fisher Scientific – (TRACE 1310 GC, iG50 Portable Gas Chromatograph)
-
Shimadzu Corporation – (Tracera GC, GC-2030)
-
PerkinElmer, Inc. – (Clarus 590 GC, Torino T-9 Portable GC)
-
Vernier Software & Technology – (Vernier Mini GC Plus, Go Direct Mini GC)
-
Ellutia – (200 Series GC, 500 Series GC)
-
Defiant Technologies – (FROG-4000, Cyranose 320)
-
ECO PHYSICS AG – (nCLD AL2, nCLD 855)
-
Eutech Scientific Services, Inc. – (Eutech GC-200, Eutech 3000 Series GC)
-
AMETEK, Inc. – (Process 2000 GC, Dycor Benchtop Mass Spectrometer)
-
Reaction Analytics Inc. – (RA-GC1000, RA-GC2000)
-
Restek Corporation – (Rtx-1 Columns, Rxi-5ms Columns)
-
Bruker – (SCION 456-GC, SCION 8500 GC)
-
Owlstone Inc. – (FAIMS Technology Analyzer, UltraFAIMS)
-
ASAP Analytical – (LC-GC Interface, Tandem GC Analyzer)
Recent Developement
-
March 2024– Emerson introduced the Rosemount 700XA Gas Chromatograph, a high-performance, IoT-integrated gas analysis system designed for continuous online gas composition monitoring. This launch reinforces Emerson’s commitment to automation and digital transformation in gas chromatography by integrating Industry 4.0 capabilities into traditional analytical instruments.
-
February 2024 –ABB introduced the PGC5000B SmartSeries, an AI-powered gas chromatograph designed for real-time emissions monitoring and energy optimization in oil & gas, power generation, and chemical processing industries.
| Report Attributes | Details |
|---|---|
| Market Size in 2023 | USD 1.66 Billion |
| Market Size by 2032 | USD 2.57 Billion |
| CAGR | CAGR of 5.11% From 2024 to 2032 |
| Base Year | 2023 |
| Forecast Period | 2024-2032 |
| Historical Data | 2020-2022 |
| Report Scope & Coverage | Market Size, Segments Analysis, Competitive Landscape, Regional Analysis, DROC & SWOT Analysis, Forecast Outlook |
| Key Segments | •By Instruments – (Systems, Detectors, Autosamplers, Others) •By Type – (Gas-Liquid Chromatography, Gas-Solid Chromatography, Others) •By End-Use Industries – (Oil & Gas, Food & Agriculture, Environmental Biosciences, Others) |
| Regional Analysis/Coverage | North America (US, Canada, Mexico), Europe (Eastern Europe [Poland, Romania, Hungary, Turkey, Rest of Eastern Europe] Western Europe] Germany, France, UK, Italy, Spain, Netherlands, Switzerland, Austria, Rest of Western Europe]), Asia Pacific (China, India, Japan, South Korea, Vietnam, Singapore, Australia, Rest of Asia Pacific), Middle East & Africa (Middle East [UAE, Egypt, Saudi Arabia, Qatar, Rest of Middle East], Africa [Nigeria, South Africa, Rest of Africa], Latin America (Brazil, Argentina, Colombia, Rest of Latin America) |
| Company Profiles | Emerson Electric Co., ABB Ltd., Siemens AG, Elster Group GmbH, SRI Instruments, Agilent Technologies, Inc., Thermo Fisher Scientific, Shimadzu Corporation, PerkinElmer, Inc., Vernier Software & Technology, Ellutia, Defiant Technologies, ECO PHYSICS AG, Eutech Scientific Services, Inc., AMETEK, Inc., Reaction Analytics Inc., Restek Corporation, Bruker, Owlstone Inc., ASAP Analytical |
