Get E-PDF Sample Report on Polyurethanes Market - Request Sample Report
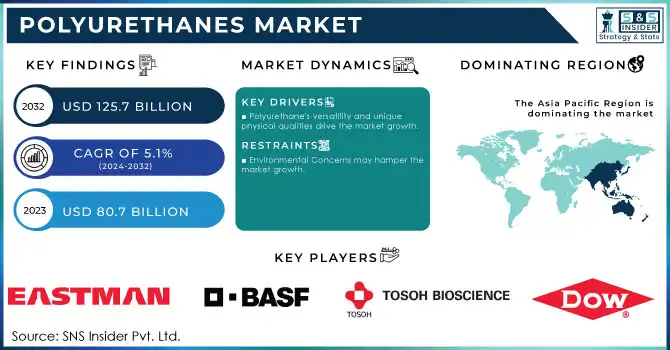
The Polyurethanes Market Size was USD 80.7 billion in 2023 and is expected to reach USD 125.7 billion by 2032 and growing at a CAGR of 5.1% over the forecast period of 2024-2032.
Polyurethanes (PU) market demand is increasingly used in the electronics industry, owing to their better properties as an encapsulant and adhesive that serve the purposes of waterproofing and thermal insulation. As electronic devices become more and more miniaturized and complex, protective materials to deliver strong resistance against environmental factors such as moisture, dust, and temperature fluctuations are required. PU encapsulants are especially prominent due to their excellent dielectric properties, which serve the outstanding performance of sensitive components. Also, PU adhesives have high adhesion and elasticity that can adapt to material thermal expansion, an important characteristic for high-performance electronics such as smartphones, sensors, and electric vehicle components. The booming consumer electronics sector along with the growing penetration of cutting-edge technologies, such as 5G and IoT, are further supporting the need for PU-based products that deliver durability, safety, and efficiency in advanced electronic devices.
Moreover, with the rapid urbanization and large infrastructure development projects, the construction sector in emerging economies such as India, China, etc., is booming. This growth is one of the most important factors driving the demand for polyurethane (PU) materials, especially in Insulation and Sealants.
The increasing focus on green building practices and energy conservation promotion by the government is also expected to drive the PU foam requirement for construction in both residential and commercial constructions in countries such as China. In India also, the growth of the construction industry and increase in government investment in smart cities and urban infrastructure are resulting in increased usage of PU sealants and foams for better thermal resistance and water-tightness.
India, for example, is on track to become the third-largest construction market globally by 2025, fueled by projects like the "Housing for All" initiative, which aims to build affordable homes for urban populations. This push for housing and infrastructure development is expected to boost the demand for PU-based products, including insulation and sealants, due to their energy-efficient and cost-effective properties.
Drivers
Polyurethane's versatility and unique physical qualities drive the market growth.
The inherent properties of polyurethane, which allow for multiple different uses within many markets, largely drive growth for it across multiple industries. Thanks to its versatility and adaptability, it can come in the form of foams, coatings, sealants, and adhesives; meeting the different application requirements in automotive, construction, furniture, and packaging. The flexibility and individualized structure of polyurethane, along with its lightweight and durability, have a rich culture of use in producing items as advanced as automotive parts, as simple as insulation panels, and as every day as mattresses. Moreover, in terms of building and construction, its property of sound insulation has led to the significant demand as insulation material for energy efficiency solution where heat retention is important. China was the number user of polyurethane in 2023, a key material in the country's construction and auto industry, according to Chinese government statistics
Additionally, the recent need for the use of environmentally friendly products has created novel innovations and the advent of bio-based polyurethanes that provide sustainability with performance. Such introduction of bio-based polyurethane resins that are high-performance are changing the landscape of the coatings & insulation market and are promoting a shift towards more efficient & sustainable materials.
Restraint
Environmental Concerns may hamper the market growth.
The challenges of environmental concerns are also among the top restraints of the growing polyurethane (PU) market. Most polyurethanes come from petrochemicals, so there is sustainability concerns related to the manufactured methods and the environmental impact of the waste that remains for a long time. Polyurethane (PU) materials include foams, coatings and adhesives, which can lead to plastic pollution when not disposed of properly or recycled. Recent growing awareness of climate change and resource depletion has pushed regulatory bodies around the world (e.g., REACH regulations by the European Union and national environmental standards) to impose more and more severe rules on the production and disposal of chemical products, including PU.
Opportunity:
Growing demand for low-VOC, environmentally friendly, and long-lasting polyurethane
Polyurethanes Market Segmentation Analysis
By Raw Material Type
Polyol held the largest market share around 42% in 2023. Its volume in the formulation of practically all types of PU products, including foams, coatings, adhesives, and sealants. Polyols are one of the two main building blocks used in synthesizing polyurethane (the other being isocyanates), and polyols are very versatile and widely used in the automotive, construction, and furniture industries. This prominence can be attributed to the growing demand for polyols where flexible and rigid foams account for a major share of the market. The global flexible foams segment, which is widely used for furniture cushions, mattresses, and automotive seating, as well as rigid foams, used for insulation, are also expanding at a steady pace.
By Product Type
Rigid foam held the largest market share around 32% in 2023. It is extensively used in various insulation applications in the construction, refrigeration, and automotive industries. Due to its low thermal conductivity and specific lightweight features, it is perfect for thermal insulation applications where good energy efficiency combined with a saving space concept are criticaligid polyurethane foam is widely used by the construction industry for building insulation as it provides incredible thermal insulation and energy conservation, which, subsequently, is influencing its demand, particularly for energy-efficient construction, across the globe.
By End-User
The building and construction sector held the largest market share around 27% in 2023. Due to the growing need for energy-efficient materials and advanced construction technologies, the building and construction sector accounts for the largest PU market share. Polyurethanes in particular in rigid foam and coatings help, through insulation and sealing applications in buildings, to reduce energy consumption in buildings. Rigid polyurethane foam is one of the main materials that are used in thermal insulation while maintaining the building's temperature control, and reducing energy loss. PU product demand in the construction industry has increased with the global movement towards sustainable construction practices along with stringent energy codes.
In addition, rapid housing and infrastructure growth also taking place in emerging countries like India and China further contributes to boosting this sector. Moreover, the promotion of green building practices and energy-efficient solutions through government incentives is another factor that is likely to fuel the demand in the coming years, thereby further stimulating the adoption of polyurethane-based materials.
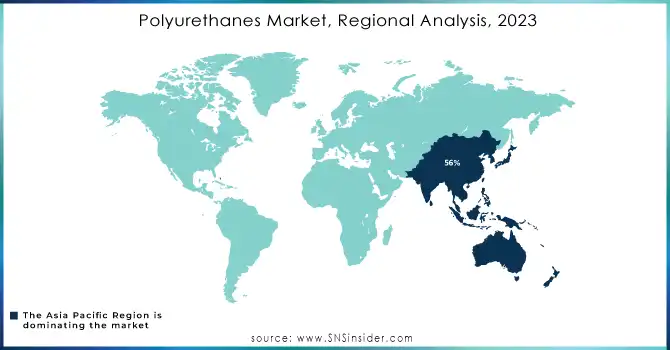
Asia Pacific held the highest market share around 56% in 2023. It is driven by the construction, automotive, and electronics sectors. This increase in demand is predominantly seen for PU products, most notably, rigid and flexible foams due to their application in thermal insulation and packaging, which is further driven by the healthy economic growth in the region and robust infrastructure development, especially in the emerging economies such as China and India. Such growth in urbanization, population, and government investments in housing and commercial infrastructure projects drives the booming construction industry in these countries. Asia Pacific is also the hub of a few global automotive manufacturers wherein PU applications for seating, insulation, and soundproofing are predominant, thereby augmenting regional growth.
Moreover, the growing Asia Pacific emphasis on energy conservation and environmental protection has propelled the demand for PU-based products from key industries in insulation applications, including building materials and refrigeration. In addition, the availability of key PU manufacturers in the region along with supportive government policies such as subsidies for energy-efficient technologies and green building projects are supporting the market growth over the upcoming years. For example, the PU has garnered continued growth due to the market investing in green construction materials and China being the largest PU consumer.
Get Customized Report as per your Business Requirement - Request For Customized Report
Eastman Chemical Company (U.S.) (PU Adhesives)
BASF SE (Elastollan Thermoplastic Polyurethane)
Tosoh Corporation (Japan) (PU Raw Materials)
Huntsman Corporation (Rubinate Polyurethane Systems)
The Dow Chemical Company (VORANOL Polyether Polyols)
Covestro AG (Desmodur Isocyanates)
DIC Corporation (Polyurethane Dispersions)
Mitsui Chemicals (Admer Polyurethane Adhesives)
Wanhua Chemical Group (Wannate Isocyanates)
Lubrizol Corporation (Estane Thermoplastic Polyurethane)
Lanxess (Adiprene and Vibrathane Polyurethanes)
Perstorp Group (Capa™ Polyols)
Recticel (Flexible PU Foams)
Woodbridge Group (Polyurethane Foam Systems)
INOAC Corporation (Automotive PU Foams)
Manali Petrochemicals (PU Systems for Coatings)
Bayer MaterialScience (Baytherm PU Systems)
Armacell (Armaflex Insulation Foams)
Mitsubishi Chemical (Hyperthane Polyurethane)
Trelleborg AB (PU Coatings and Seals)
In June 2023, Recital launched a line of PU insulation boards based on 25% bio-circular raw materials as part of the company´s set of initiatives directed at promoting its carbon emissions by 43%, this innovation underscores the company´s promise to sustainable polyurethane manufacture.
In May 2023, Covestro AG opened a new production line and launched the Desmopan UP thermoplastics polyurethane (TPU) series for protective films for automotive and wind applications..
| Report Attributes | Details |
|---|---|
| Market Size in 2023 | US$ 59.76 Billion |
| Market Size by 2032 | US$ 90.34 Billion |
| CAGR | CAGR of 5.1% From 2024 to 2032 |
| Base Year | 2023 |
| Forecast Period | 2024-2032 |
| Historical Data | 2020-2022 |
| Report Scope & Coverage | Market Size, Segments Analysis, Competitive Landscape, Regional Analysis, DROC & SWOT Analysis, Forecast Outlook |
| Key Segments | • By Raw Material Type (Polyol, MDI, TDI, Others) • By Product Type (Flexible foam, Rigid foam, Coating, Adhesive & sealants, Others) • By End User (Building & construction, Automotive & transportation, Bedding & furniture, Footwear, Appliances & White Good) |
| Regional Analysis/Coverage | North America (US, Canada, Mexico), Europe (Eastern Europe [Poland, Romania, Hungary, Turkey, Rest of Eastern Europe] Western Europe] Germany, France, UK, Italy, Spain, Netherlands, Switzerland, Austria, Rest of Western Europe]), Asia Pacific (China, India, Japan, South Korea, Vietnam, Singapore, Australia, Rest of Asia Pacific), Middle East & Africa (Middle East [UAE, Egypt, Saudi Arabia, Qatar, Rest of Middle East], Africa [Nigeria, South Africa, Rest of Africa], Latin America (Brazil, Argentina, Colombia, Rest of Latin America) |
| Company Profiles | Eastman Chemical Company (U.S.), BASF SE (Germany), Tosoh Corporation (Japan), Huntsman Corporation (U.S), The Dow Chemical Company (U.S), Covestro AG (Germany), DIC Corporation (JAPAN), |
| DRIVERS | • Polyurethane's versatility and unique physical qualities • Polyurethane is becoming more widely used in refrigeration applications. • The bedding was revitalised thanks to memory foam. |
| Restraints | • Environmental problems and dangers of exposure • Demand for acid-epoxy coatings is increasing. |
The growth rate of the Polyurethanes (PU) Market is 5.1% over the forecast period 2024-2032.
Ans: Manufacturers, Consultant, aftermarket players, association, Research institute, private and universities libraries, suppliers and distributors of the product.
Ans: The COVID-19 epidemic has had a significant impact on several key end-use industries in the PU market, including furniture, construction, electronics, automotive, and others. The pandemic and ensuing lockdown have reduced the staff in manufacturing units, resulting in lower polyurethane production. Revenue losses, indebtedness, poorer supply chains, and other challenges have been posed by the new coronavirus to market enterprises. The uncontrollable spread of SARS-CoV-2 around the world has prompted prominent manufacturers to adhere to tight safety standards and maintain effective communication, as the health of their employees has become a top priority. Vendors are also under pressure to undertake competitive measures in order to maintain their market positions, despite the COVID-19 pandemic's obstacles.
Ans: Polyurethane's versatility and unique physical qualities, Polyurethane is becoming more widely used in refrigeration applications and The bedding was revitalised thanks to memory foam are the drivers for Polyurethanes (PU) Market.
Ans: New bio-based polyurethane feedstock and Crude oil price volatility are the challenges faced by the Polyurethanes (PU) Market.
Table of Contents
1. Introduction
1.1 Market Definition
1.2 Scope (Inclusion and Exclusions)
1.3 Research Assumptions
2. Executive Summary
2.1 Market Overview
2.2 Regional Synopsis
2.3 Competitive Summary
3. Research Methodology
3.1 Top-Down Approach
3.2 Bottom-up Approach
3.3. Data Validation
3.4 Primary Interviews
4. Market Dynamics Impact Analysis
4.1 Market Driving Factors Analysis
4.1.1 Drivers
4.1.2 Restraints
4.1.3 Opportunities
4.1.4 Challenges
4.2 PESTLE Analysis
4.3 Porter’s Five Forces Model
5. Statistical Insights and Trends Reporting
5.1 Production Capacity and Utilization, by Country, by Type, 2023
5.2 Feedstock Prices, by Country, by Type, 2023
5.3 Regulatory Impact, by Country, by Type, 2023.
5.4 Environmental Metrics: Emissions Data, Waste Management Practices, and Sustainability Initiatives, by Region
5.5 Innovation and R&D, by Type, 2023
6. Competitive Landscape
6.1 List of Major Companies, By Region
6.2 Market Share Analysis, By Region
6.3 Product Benchmarking
6.3.1 Product specifications and features
6.3.2 Pricing
6.4 Strategic Initiatives
6.4.1 Marketing and promotional activities
6.4.2 Distribution and supply chain strategies
6.4.3 Expansion plans and new product launches
6.4.4 Strategic partnerships and collaborations
6.5 Technological Advancements
6.6 Market Positioning and Branding
7. Polyurethanes (PU) Market Segmentation, by Raw Material Type
7.1 Chapter Overview
7.2 Polyol
7.2.1 Polyol Market Trends Analysis (2020-2032)
7.2.2 Polyol Market Size Estimates and Forecasts to 2032 (USD Billion)
7.3 MDI
7.3.1 MDI Market Trends Analysis (2020-2032)
7.3.2 MDI Market Size Estimates and Forecasts to 2032 (USD Billion)
7.4 TDI
7.4.1 TDI Market Trends Analysis (2020-2032)
7.4.2 TDI Market Size Estimates and Forecasts to 2032 (USD Billion)
7.4 Others
7.4.1 Others Market Trends Analysis (2020-2032)
7.4.2 Others Market Size Estimates and Forecasts to 2032 (USD Billion)
8. Polyurethanes (PU) Market Segmentation, by Product Type
8.1 Chapter Overview
8.2 Flexible foam
8.2.1 Flexible foam Market Trends Analysis (2020-2032)
8.2.2 Flexible foam Market Size Estimates and Forecasts to 2032 (USD Billion)
8.3 Rigid foam
8.3.1 Rigid foam Market Trends Analysis (2020-2032)
8.3.2 Rigid foam Market Size Estimates and Forecasts to 2032 (USD Billion)
8.4 Coating
8.4.1 Coating Market Trends Analysis (2020-2032)
8.4.2 Coating Market Size Estimates and Forecasts to 2032 (USD Billion)
8.5 Adhesive & sealants
8.5.1 Adhesive & sealants Market Trends Analysis (2020-2032)
8.5.2 Adhesive & sealants Market Size Estimates and Forecasts to 2032 (USD Billion)
8.6 Others
8.6.1 Others Market Trends Analysis (2020-2032)
8.6.2 Others Market Size Estimates and Forecasts to 2032 (USD Billion)
9. Polyurethanes (PU) Market Segmentation, by End-User
9.1 Chapter Overview
9.2 Building & construction
9.2.1 Building & construction Market Trends Analysis (2020-2032)
9.2.2 Building & construction Market Size Estimates and Forecasts to 2032 (USD Billion)
9.3 Automotive & Transportation
9.3.1 Automotive & Transportation Market Trends Analysis (2020-2032)
9.3.2 Automotive & Transportation Market Size Estimates and Forecasts to 2032 (USD Billion)
9.4 Bedding & Furniture
9.4.1 Bedding & Furniture Market Trends Analysis (2020-2032)
9.4.2 Bedding & Furniture Market Size Estimates and Forecasts to 2032 (USD Billion)
9.5 Footwear
9.5.1 Footwear Market Trends Analysis (2020-2032)
9.5.2 Footwear Market Size Estimates and Forecasts to 2032 (USD Billion)
9.5 Appliances & white good
9.5.1 Appliances & white good Market Trends Analysis (2020-2032)
9.5.2 Appliances & white good Market Size Estimates and Forecasts to 2032 (USD Billion)
9.5 Others
9.5.1 Others Market Trends Analysis (2020-2032)
9.5.2 Others Market Size Estimates and Forecasts to 2032 (USD Billion)
10. Regional Analysis
10.1 Chapter Overview
10.2 North America
10.2.1 Trends Analysis
10.2.2 North America Polyurethanes (PU) Market Estimates and Forecasts, by Country (2020-2032) (USD Billion)
10.2.3 North America Polyurethanes (PU) Market Estimates and Forecasts, by Raw Material Type (2020-2032) (USD Billion)
10.2.4 North America Polyurethanes (PU) Market Estimates and Forecasts, by Product Type (2020-2032) (USD Billion)
10.2.5 North America Polyurethanes (PU) Market Estimates and Forecasts, by End-User (2020-2032) (USD Billion)
10.2.6 USA
10.2.6.1 USA Polyurethanes (PU) Market Estimates and Forecasts, by Raw Material Type (2020-2032) (USD Billion)
10.2.6.2 USA Polyurethanes (PU) Market Estimates and Forecasts, by Product Type (2020-2032) (USD Billion)
10.2.6.3 USA Polyurethanes (PU) Market Estimates and Forecasts, by End-User (2020-2032) (USD Billion)
10.2.7 Canada
10.2.7.1 Canada Polyurethanes (PU) Market Estimates and Forecasts, by Raw Material Type (2020-2032) (USD Billion)
10.2.7.2 Canada Polyurethanes (PU) Market Estimates and Forecasts, by Product Type (2020-2032) (USD Billion)
10.2.7.3 Canada Polyurethanes (PU) Market Estimates and Forecasts, by End-User (2020-2032) (USD Billion)
10.2.8 Mexico
10.2.8.1 Mexico Polyurethanes (PU) Market Estimates and Forecasts, by Raw Material Type (2020-2032) (USD Billion)
10.2.8.2 Mexico Polyurethanes (PU) Market Estimates and Forecasts, by Product Type (2020-2032) (USD Billion)
10.2.8.3 Mexico Polyurethanes (PU) Market Estimates and Forecasts, by End-User (2020-2032) (USD Billion)
10.3 Europe
10.3.1 Eastern Europe
10.3.1.1 Trends Analysis
10.3.1.2 Eastern Europe Polyurethanes (PU) Market Estimates and Forecasts, by Country (2020-2032) (USD Billion)
10.3.1.3 Eastern Europe Polyurethanes (PU) Market Estimates and Forecasts, by Raw Material Type (2020-2032) (USD Billion)
10.3.1.4 Eastern Europe Polyurethanes (PU) Market Estimates and Forecasts, by Product Type (2020-2032) (USD Billion)
10.3.1.5 Eastern Europe Polyurethanes (PU) Market Estimates and Forecasts, by End-User (2020-2032) (USD Billion)
10.3.1.6 Poland
10.3.1.6.1 Poland Polyurethanes (PU) Market Estimates and Forecasts, by Raw Material Type (2020-2032) (USD Billion)
10.3.1.6.2 Poland Polyurethanes (PU) Market Estimates and Forecasts, by Product Type (2020-2032) (USD Billion)
10.3.1.6.3 Poland Polyurethanes (PU) Market Estimates and Forecasts, by End-User (2020-2032) (USD Billion)
10.3.1.7 Romania
10.3.1.7.1 Romania Polyurethanes (PU) Market Estimates and Forecasts, by Raw Material Type (2020-2032) (USD Billion)
10.3.1.7.2 Romania Polyurethanes (PU) Market Estimates and Forecasts, by Product Type (2020-2032) (USD Billion)
10.3.1.7.3 Romania Polyurethanes (PU) Market Estimates and Forecasts, by End-User (2020-2032) (USD Billion)
10.3.1.8 Hungary
10.3.1.8.1 Hungary Polyurethanes (PU) Market Estimates and Forecasts, by Raw Material Type (2020-2032) (USD Billion)
10.3.1.8.2 Hungary Polyurethanes (PU) Market Estimates and Forecasts, by Product Type (2020-2032) (USD Billion)
10.3.1.8.3 Hungary Polyurethanes (PU) Market Estimates and Forecasts, by End-User (2020-2032) (USD Billion)
10.3.1.9 Turkey
10.3.1.9.1 Turkey Polyurethanes (PU) Market Estimates and Forecasts, by Raw Material Type (2020-2032) (USD Billion)
10.3.1.9.2 Turkey Polyurethanes (PU) Market Estimates and Forecasts, by Product Type (2020-2032) (USD Billion)
10.3.1.9.3 Turkey Polyurethanes (PU) Market Estimates and Forecasts, by End-User (2020-2032) (USD Billion)
10.3.1.10 Rest of Eastern Europe
10.3.1.10.1 Rest of Eastern Europe Polyurethanes (PU) Market Estimates and Forecasts, by Raw Material Type (2020-2032) (USD Billion)
10.3.1.10.2 Rest of Eastern Europe Polyurethanes (PU) Market Estimates and Forecasts, by Product Type (2020-2032) (USD Billion)
10.3.1.10.3 Rest of Eastern Europe Polyurethanes (PU) Market Estimates and Forecasts, by End-User (2020-2032) (USD Billion)
10.3.2 Western Europe
10.3.2.1 Trends Analysis
10.3.2.2 Western Europe Polyurethanes (PU) Market Estimates and Forecasts, by Country (2020-2032) (USD Billion)
10.3.2.3 Western Europe Polyurethanes (PU) Market Estimates and Forecasts, by Raw Material Type (2020-2032) (USD Billion)
10.3.2.4 Western Europe Polyurethanes (PU) Market Estimates and Forecasts, by Product Type (2020-2032) (USD Billion)
10.3.2.5 Western Europe Polyurethanes (PU) Market Estimates and Forecasts, by End-User (2020-2032) (USD Billion)
10.3.2.6 Germany
10.3.2.6.1 Germany Polyurethanes (PU) Market Estimates and Forecasts, by Raw Material Type (2020-2032) (USD Billion)
10.3.2.6.2 Germany Polyurethanes (PU) Market Estimates and Forecasts, by Product Type (2020-2032) (USD Billion)
10.3.2.6.3 Germany Polyurethanes (PU) Market Estimates and Forecasts, by End-User (2020-2032) (USD Billion)
10.3.2.7 France
10.3.2.7.1 France Polyurethanes (PU) Market Estimates and Forecasts, by Raw Material Type (2020-2032) (USD Billion)
10.3.2.7.2 France Polyurethanes (PU) Market Estimates and Forecasts, by Product Type (2020-2032) (USD Billion)
10.3.2.7.3 France Polyurethanes (PU) Market Estimates and Forecasts, by End-User (2020-2032) (USD Billion)
10.3.2.8 UK
10.3.2.8.1 UK Polyurethanes (PU) Market Estimates and Forecasts, by Raw Material Type (2020-2032) (USD Billion)
10.3.2.8.2 UK Polyurethanes (PU) Market Estimates and Forecasts, by Product Type (2020-2032) (USD Billion)
10.3.2.8.3 UK Polyurethanes (PU) Market Estimates and Forecasts, by End-User (2020-2032) (USD Billion)
10.3.2.9 Italy
10.3.2.9.1 Italy Polyurethanes (PU) Market Estimates and Forecasts, by Raw Material Type (2020-2032) (USD Billion)
10.3.2.9.2 Italy Polyurethanes (PU) Market Estimates and Forecasts, by Product Type (2020-2032) (USD Billion)
10.3.2.9.3 Italy Polyurethanes (PU) Market Estimates and Forecasts, by End-User (2020-2032) (USD Billion)
10.3.2.10 Spain
10.3.2.10.1 Spain Polyurethanes (PU) Market Estimates and Forecasts, by Raw Material Type (2020-2032) (USD Billion)
10.3.2.10.2 Spain Polyurethanes (PU) Market Estimates and Forecasts, by Product Type (2020-2032) (USD Billion)
10.3.2.10.3 Spain Polyurethanes (PU) Market Estimates and Forecasts, by End-User (2020-2032) (USD Billion)
10.3.2.11 Netherlands
10.3.2.11.1 Netherlands Polyurethanes (PU) Market Estimates and Forecasts, by Raw Material Type (2020-2032) (USD Billion)
10.3.2.11.2 Netherlands Polyurethanes (PU) Market Estimates and Forecasts, by Product Type (2020-2032) (USD Billion)
10.3.2.11.3 Netherlands Polyurethanes (PU) Market Estimates and Forecasts, by End-User (2020-2032) (USD Billion)
10.3.2.12 Switzerland
10.3.2.12.1 Switzerland Polyurethanes (PU) Market Estimates and Forecasts, by Raw Material Type (2020-2032) (USD Billion)
10.3.2.12.2 Switzerland Polyurethanes (PU) Market Estimates and Forecasts, by Product Type (2020-2032) (USD Billion)
10.3.2.12.3 Switzerland Polyurethanes (PU) Market Estimates and Forecasts, by End-User (2020-2032) (USD Billion)
10.3.2.13 Austria
10.3.2.13.1 Austria Polyurethanes (PU) Market Estimates and Forecasts, by Raw Material Type (2020-2032) (USD Billion)
10.3.2.13.2 Austria Polyurethanes (PU) Market Estimates and Forecasts, by Product Type (2020-2032) (USD Billion)
10.3.2.13.3 Austria Polyurethanes (PU) Market Estimates and Forecasts, by End-User (2020-2032) (USD Billion)
10.3.2.14 Rest of Western Europe
10.3.2.14.1 Rest of Western Europe Polyurethanes (PU) Market Estimates and Forecasts, by Raw Material Type (2020-2032) (USD Billion)
10.3.2.14.2 Rest of Western Europe Polyurethanes (PU) Market Estimates and Forecasts, by Product Type (2020-2032) (USD Billion)
10.3.2.14.3 Rest of Western Europe Polyurethanes (PU) Market Estimates and Forecasts, by End-User (2020-2032) (USD Billion)
10.4 Asia Pacific
10.4.1 Trends Analysis
10.4.2 Asia Pacific Polyurethanes (PU) Market Estimates and Forecasts, by Country (2020-2032) (USD Billion)
10.4.3 Asia Pacific Polyurethanes (PU) Market Estimates and Forecasts, by Raw Material Type (2020-2032) (USD Billion)
10.4.4 Asia Pacific Polyurethanes (PU) Market Estimates and Forecasts, by Product Type (2020-2032) (USD Billion)
10.4.5 Asia Pacific Polyurethanes (PU) Market Estimates and Forecasts, by End-User (2020-2032) (USD Billion)
10.4.6 China
10.4.6.1 China Polyurethanes (PU) Market Estimates and Forecasts, by Raw Material Type (2020-2032) (USD Billion)
10.4.6.2 China Polyurethanes (PU) Market Estimates and Forecasts, by Product Type (2020-2032) (USD Billion)
10.4.6.3 China Polyurethanes (PU) Market Estimates and Forecasts, by End-User (2020-2032) (USD Billion)
10.4.7 India
10.4.7.1 India Polyurethanes (PU) Market Estimates and Forecasts, by Raw Material Type (2020-2032) (USD Billion)
10.4.7.2 India Polyurethanes (PU) Market Estimates and Forecasts, by Product Type (2020-2032) (USD Billion)
10.4.7.3 India Polyurethanes (PU) Market Estimates and Forecasts, by End-User (2020-2032) (USD Billion)
10.4.8 Japan
10.4.8.1 Japan Polyurethanes (PU) Market Estimates and Forecasts, by Raw Material Type (2020-2032) (USD Billion)
10.4.8.2 Japan Polyurethanes (PU) Market Estimates and Forecasts, by Product Type (2020-2032) (USD Billion)
10.4.8.3 Japan Polyurethanes (PU) Market Estimates and Forecasts, by End-User (2020-2032) (USD Billion)
10.4.9 South Korea
10.4.9.1 South Korea Polyurethanes (PU) Market Estimates and Forecasts, by Raw Material Type (2020-2032) (USD Billion)
10.4.9.2 South Korea Polyurethanes (PU) Market Estimates and Forecasts, by Product Type (2020-2032) (USD Billion)
10.4.9.3 South Korea Polyurethanes (PU) Market Estimates and Forecasts, by End-User (2020-2032) (USD Billion)
10.4.10 Vietnam
10.4.10.1 Vietnam Polyurethanes (PU) Market Estimates and Forecasts, by Raw Material Type (2020-2032) (USD Billion)
10.4.10.2 Vietnam Polyurethanes (PU) Market Estimates and Forecasts, by Product Type (2020-2032) (USD Billion)
10.4.10.3 Vietnam Polyurethanes (PU) Market Estimates and Forecasts, by End-User (2020-2032) (USD Billion)
10.4.11 Singapore
10.4.11.1 Singapore Polyurethanes (PU) Market Estimates and Forecasts, by Raw Material Type (2020-2032) (USD Billion)
10.4.11.2 Singapore Polyurethanes (PU) Market Estimates and Forecasts, by Product Type (2020-2032) (USD Billion)
10.4.11.3 Singapore Polyurethanes (PU) Market Estimates and Forecasts, by End-User (2020-2032) (USD Billion)
10.4.12 Australia
10.4.12.1 Australia Polyurethanes (PU) Market Estimates and Forecasts, by Raw Material Type (2020-2032) (USD Billion)
10.4.12.2 Australia Polyurethanes (PU) Market Estimates and Forecasts, by Product Type (2020-2032) (USD Billion)
10.4.12.3 Australia Polyurethanes (PU) Market Estimates and Forecasts, by End-User (2020-2032) (USD Billion)
10.4.13 Rest of Asia Pacific
10.4.13.1 Rest of Asia Pacific Polyurethanes (PU) Market Estimates and Forecasts, by Raw Material Type (2020-2032) (USD Billion)
10.4.13.2 Rest of Asia Pacific Polyurethanes (PU) Market Estimates and Forecasts, by Product Type (2020-2032) (USD Billion)
10.4.13.3 Rest of Asia Pacific Polyurethanes (PU) Market Estimates and Forecasts, by End-User (2020-2032) (USD Billion)
10.5 Middle East and Africa
10.5.1 Middle East
10.5.1.1 Trends Analysis
10.5.1.2 Middle East Polyurethanes (PU) Market Estimates and Forecasts, by Country (2020-2032) (USD Billion)
10.5.1.3 Middle East Polyurethanes (PU) Market Estimates and Forecasts, by Raw Material Type (2020-2032) (USD Billion)
10.5.1.4 Middle East Polyurethanes (PU) Market Estimates and Forecasts, by Product Type (2020-2032) (USD Billion)
10.5.1.5 Middle East Polyurethanes (PU) Market Estimates and Forecasts, by End-User (2020-2032) (USD Billion)
10.5.1.6 UAE
10.5.1.6.1 UAE Polyurethanes (PU) Market Estimates and Forecasts, by Raw Material Type (2020-2032) (USD Billion)
10.5.1.6.2 UAE Polyurethanes (PU) Market Estimates and Forecasts, by Product Type (2020-2032) (USD Billion)
10.5.1.6.3 UAE Polyurethanes (PU) Market Estimates and Forecasts, by End-User (2020-2032) (USD Billion)
10.5.1.7 Egypt
10.5.1.7.1 Egypt Polyurethanes (PU) Market Estimates and Forecasts, by Raw Material Type (2020-2032) (USD Billion)
10.5.1.7.2 Egypt Polyurethanes (PU) Market Estimates and Forecasts, by Product Type (2020-2032) (USD Billion)
10.5.1.7.3 Egypt Polyurethanes (PU) Market Estimates and Forecasts, by End-User (2020-2032) (USD Billion)
10.5.1.8 Saudi Arabia
10.5.1.8.1 Saudi Arabia Polyurethanes (PU) Market Estimates and Forecasts, by Raw Material Type (2020-2032) (USD Billion)
10.5.1.8.2 Saudi Arabia Polyurethanes (PU) Market Estimates and Forecasts, by Product Type (2020-2032) (USD Billion)
10.5.1.8.3 Saudi Arabia Polyurethanes (PU) Market Estimates and Forecasts, by End-User (2020-2032) (USD Billion)
10.5.1.9 Qatar
10.5.1.9.1 Qatar Polyurethanes (PU) Market Estimates and Forecasts, by Raw Material Type (2020-2032) (USD Billion)
10.5.1.9.2 Qatar Polyurethanes (PU) Market Estimates and Forecasts, by Product Type (2020-2032) (USD Billion)
10.5.1.9.3 Qatar Polyurethanes (PU) Market Estimates and Forecasts, by End-User (2020-2032) (USD Billion)
10.5.1.10 Rest of Middle East
10.5.1.10.1 Rest of Middle East Polyurethanes (PU) Market Estimates and Forecasts, by Raw Material Type (2020-2032) (USD Billion)
10.5.1.10.2 Rest of Middle East Polyurethanes (PU) Market Estimates and Forecasts, by Product Type (2020-2032) (USD Billion)
10.5.1.10.3 Rest of Middle East Polyurethanes (PU) Market Estimates and Forecasts, by End-User (2020-2032) (USD Billion)
10.5.2 Africa
10.5.2.1 Trends Analysis
10.5.2.2 Africa Polyurethanes (PU) Market Estimates and Forecasts, by Country (2020-2032) (USD Billion)
10.5.2.3 Africa Polyurethanes (PU) Market Estimates and Forecasts, by Raw Material Type (2020-2032) (USD Billion)
10.5.2.4 Africa Polyurethanes (PU) Market Estimates and Forecasts, by Product Type (2020-2032) (USD Billion)
10.5.2.5 Africa Polyurethanes (PU) Market Estimates and Forecasts, by End-User (2020-2032) (USD Billion)
10.5.2.6 South Africa
10.5.2.6.1 South Africa Polyurethanes (PU) Market Estimates and Forecasts, by Raw Material Type (2020-2032) (USD Billion)
10.5.2.6.2 South Africa Polyurethanes (PU) Market Estimates and Forecasts, by Product Type (2020-2032) (USD Billion)
10.5.2.6.3 South Africa Polyurethanes (PU) Market Estimates and Forecasts, by End-User (2020-2032) (USD Billion)
10.5.2.7 Nigeria
10.5.2.7.1 Nigeria Polyurethanes (PU) Market Estimates and Forecasts, by Raw Material Type (2020-2032) (USD Billion)
10.5.2.7.2 Nigeria Polyurethanes (PU) Market Estimates and Forecasts, by Product Type (2020-2032) (USD Billion)
10.5.2.7.3 Nigeria Polyurethanes (PU) Market Estimates and Forecasts, by End-User (2020-2032) (USD Billion)
10.5.2.8 Rest of Africa
10.5.2.8.1 Rest of Africa Polyurethanes (PU) Market Estimates and Forecasts, by Raw Material Type (2020-2032) (USD Billion)
10.5.2.8.2 Rest of Africa Polyurethanes (PU) Market Estimates and Forecasts, by Product Type (2020-2032) (USD Billion)
10.5.2.8.3 Rest of Africa Polyurethanes (PU) Market Estimates and Forecasts, by End-User (2020-2032) (USD Billion)
10.6 Latin America
10.6.1 Trends Analysis
10.6.2 Latin America Polyurethanes (PU) Market Estimates and Forecasts, by Country (2020-2032) (USD Billion)
10.6.3 Latin America Polyurethanes (PU) Market Estimates and Forecasts, by Raw Material Type (2020-2032) (USD Billion)
10.6.4 Latin America Polyurethanes (PU) Market Estimates and Forecasts, by Product Type (2020-2032) (USD Billion)
10.6.5 Latin America Polyurethanes (PU) Market Estimates and Forecasts, by End-User (2020-2032) (USD Billion)
10.6.6 Brazil
10.6.6.1 Brazil Polyurethanes (PU) Market Estimates and Forecasts, by Raw Material Type (2020-2032) (USD Billion)
10.6.6.2 Brazil Polyurethanes (PU) Market Estimates and Forecasts, by Product Type (2020-2032) (USD Billion)
10.6.6.3 Brazil Polyurethanes (PU) Market Estimates and Forecasts, by End-User (2020-2032) (USD Billion)
10.6.7 Argentina
10.6.7.1 Argentina Polyurethanes (PU) Market Estimates and Forecasts, by Raw Material Type (2020-2032) (USD Billion)
10.6.7.2 Argentina Polyurethanes (PU) Market Estimates and Forecasts, by Product Type (2020-2032) (USD Billion)
10.6.7.3 Argentina Polyurethanes (PU) Market Estimates and Forecasts, by End-User (2020-2032) (USD Billion)
10.6.8 Colombia
10.6.8.1 Colombia Polyurethanes (PU) Market Estimates and Forecasts, by Raw Material Type (2020-2032) (USD Billion)
10.6.8.2 Colombia Polyurethanes (PU) Market Estimates and Forecasts, by Product Type (2020-2032) (USD Billion)
10.6.8.3 Colombia Polyurethanes (PU) Market Estimates and Forecasts, by End-User (2020-2032) (USD Billion)
10.6.9 Rest of Latin America
10.6.9.1 Rest of Latin America Polyurethanes (PU) Market Estimates and Forecasts, by Raw Material Type (2020-2032) (USD Billion)
10.6.9.2 Rest of Latin America Polyurethanes (PU) Market Estimates and Forecasts, by Product Type (2020-2032) (USD Billion)
10.6.9.3 Rest of Latin America Polyurethanes (PU) Market Estimates and Forecasts, by End-User (2020-2032) (USD Billion)
11. Company Profiles
11.1 Eastman Chemical Company
11.1.1 Company Overview
11.1.2 Financial
11.1.3 Products/ Services Offered
11.1.4 SWOT Analysis
11.2 BASF SE
11.2.1 Company Overview
11.2.2 Financial
11.2.3 Products/ Services Offered
11.2.4 SWOT Analysis
11.3 Tosoh Corporation
11.3.1 Company Overview
11.3.2 Financial
11.3.3 Products/ Services Offered
11.3.4 SWOT Analysis
11.4 Huntsman Corporation
11.4.1 Company Overview
11.4.2 Financial
11.4.3 Products/ Services Offered
11.4.4 SWOT Analysis
11.5 The Dow Chemical Company
11.5.1 Company Overview
11.5.2 Financial
11.5.3 Products/ Services Offered
11.5.4 SWOT Analysis
11.6 Covestro AG
11.6.1 Company Overview
11.6.2 Financial
11.6.3 Products/ Services Offered
11.6.4 SWOT Analysis
11.7 DIC Corporation
11.7.1 Company Overview
11.7.2 Financial
11.7.3 Products/ Services Offered
11.7.4 SWOT Analysis
11.8 Mitsui Chemicals
11.8.1 Company Overview
11.8.2 Financial
11.8.3 Products/ Services Offered
11.8.4 SWOT Analysis
11.9 Wanhua Chemical Group
11.9.1 Company Overview
11.9.2 Financial
11.9.3 Products/ Services Offered
11.9.4 SWOT Analysis
11.10 Lubrizol Corporation
11.10.1 Company Overview
11.10.2 Financial
11.10.3 Products/ Services Offered
11.10.4 SWOT Analysis
12. Use Cases and Best Practices
13. Conclusion
An accurate research report requires proper strategizing as well as implementation. There are multiple factors involved in the completion of good and accurate research report and selecting the best methodology to compete the research is the toughest part. Since the research reports we provide play a crucial role in any company’s decision-making process, therefore we at SNS Insider always believe that we should choose the best method which gives us results closer to reality. This allows us to reach at a stage wherein we can provide our clients best and accurate investment to output ratio.
Each report that we prepare takes a timeframe of 350-400 business hours for production. Starting from the selection of titles through a couple of in-depth brain storming session to the final QC process before uploading our titles on our website we dedicate around 350 working hours. The titles are selected based on their current market cap and the foreseen CAGR and growth.
The 5 steps process:
Step 1: Secondary Research:
Secondary Research or Desk Research is as the name suggests is a research process wherein, we collect data through the readily available information. In this process we use various paid and unpaid databases which our team has access to and gather data through the same. This includes examining of listed companies’ annual reports, Journals, SEC filling etc. Apart from this our team has access to various associations across the globe across different industries. Lastly, we have exchange relationships with various university as well as individual libraries.

Step 2: Primary Research
When we talk about primary research, it is a type of study in which the researchers collect relevant data samples directly, rather than relying on previously collected data. This type of research is focused on gaining content specific facts that can be sued to solve specific problems. Since the collected data is fresh and first hand therefore it makes the study more accurate and genuine.
We at SNS Insider have divided Primary Research into 2 parts.
Part 1 wherein we interview the KOLs of major players as well as the upcoming ones across various geographic regions. This allows us to have their view over the market scenario and acts as an important tool to come closer to the accurate market numbers. As many as 45 paid and unpaid primary interviews are taken from both the demand and supply side of the industry to make sure we land at an accurate judgement and analysis of the market.
This step involves the triangulation of data wherein our team analyses the interview transcripts, online survey responses and observation of on filed participants. The below mentioned chart should give a better understanding of the part 1 of the primary interview.

Part 2: In this part of primary research the data collected via secondary research and the part 1 of the primary research is validated with the interviews from individual consultants and subject matter experts.
Consultants are those set of people who have at least 12 years of experience and expertise within the industry whereas Subject Matter Experts are those with at least 15 years of experience behind their back within the same space. The data with the help of two main processes i.e., FGDs (Focused Group Discussions) and IDs (Individual Discussions). This gives us a 3rd party nonbiased primary view of the market scenario making it a more dependable one while collation of the data pointers.
Step 3: Data Bank Validation
Once all the information is collected via primary and secondary sources, we run that information for data validation. At our intelligence centre our research heads track a lot of information related to the market which includes the quarterly reports, the daily stock prices, and other relevant information. Our data bank server gets updated every fortnight and that is how the information which we collected using our primary and secondary information is revalidated in real time.

Step 4: QA/QC Process
After all the data collection and validation our team does a final level of quality check and quality assurance to get rid of any unwanted or undesired mistakes. This might include but not limited to getting rid of the any typos, duplication of numbers or missing of any important information. The people involved in this process include technical content writers, research heads and graphics people. Once this process is completed the title gets uploader on our platform for our clients to read it.
Step 5: Final QC/QA Process:
This is the last process and comes when the client has ordered the study. In this process a final QA/QC is done before the study is emailed to the client. Since we believe in giving our clients a good experience of our research studies, therefore, to make sure that we do not lack at our end in any way humanly possible we do a final round of quality check and then dispatch the study to the client.
By Raw Material Type
Polyol
MDI
TDI
Others
By Product Type
Flexible foam
Rigid foam
Coating
Adhesive & sealants
Others
By End-User
Building & construction
Automotive & Transportation
Bedding & Furniture
Footwear
Appliances & white good
Others
Request for Segment Customization as per your Business Requirement: Segment Customization Request
Regional Coverage:
North America
US
Canada
Mexico
Europe
Eastern Europe
Poland
Romania
Hungary
Turkey
Rest of Eastern Europe
Western Europe
Germany
France
UK
Italy
Spain
Netherlands
Switzerland
Austria
Rest of Western Europe
Asia Pacific
China
India
Japan
South Korea
Vietnam
Singapore
Australia
Rest of Asia Pacific
Middle East & Africa
Middle East
UAE
Egypt
Saudi Arabia
Qatar
Rest of Middle East
Africa
Nigeria
South Africa
Rest of Africa
Latin America
Brazil
Argentina
Colombia
Rest of Latin America
Request for Country Level Research Report: Country Level Customization Request
Available Customization
With the given market data, SNS Insider offers customization as per the company’s specific needs. The following customization options are available for the report:
Product Analysis
Criss-Cross segment analysis (e.g. Product X Application)
Product Matrix which gives a detailed comparison of product portfolio of each company
Geographic Analysis
Additional countries in any of the regions
Company Information
Detailed analysis and profiling of additional market players (Up to five)
The Advanced Insulation Materials Market was valued at USD 8.20 Bn in 2023 and is expected to reach USD 14.68 Bn by 2032, at a CAGR of 6.70% from 2024-2032.
The Bromelain Market Size was valued at USD 27.6 Million in 2023. It is expected to grow to USD 50.4 Million by 2032 and grow at a CAGR of 6.9% by 2024-2032.
The Adipic Acid Market size was valued at USD 5.20 billion in 2023. It is estimated to hit USD 7.46 billion by 2032 and grow at a CAGR of 4.09% over the forecast period of 2024-2032.
The Antifreeze Market size was valued at USD 5.5 Billion in 2023. It is expected to grow to USD 9.9 Billion by 2032 & grow at a CAGR of 6.9% over the forecast period of 2024-2032.
Bromobenzene Market Size was valued at USD 1,231.30 Million in 2023 and is expected to reach USD 1,853.90 Million by 2032, at a CAGR of 4.70% from 2024-2032.
Steel Wire Market was valued at USD 102.1 billion in 2023 and is expected to reach USD 167.4 billion by 2032, growing at a CAGR of 5.7% from 2024 to 2032.

Hi! Click one of our member below to chat on Phone
© 2025 All Rights Reserved by SNS Insider Pvt Ltd


