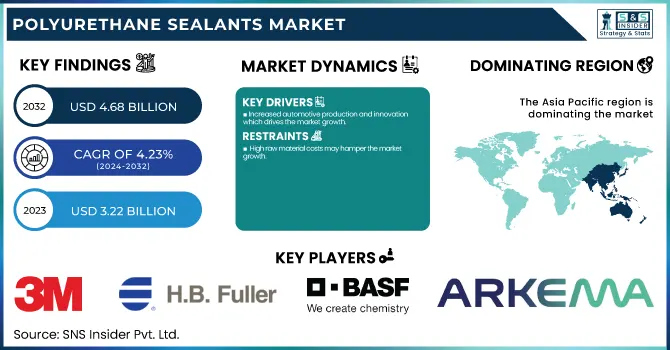
The Polyurethane Sealants Market size was USD 3.22 Billion in 2023 and is expected to reach USD 4.68 Billion by 2032 and grow at a CAGR of 4.23 % over the forecast period of 2024-2032. The report covers key trends in the market include the rising adoption of polyurethane sealants for their superior durability, flexibility, and weather resistance. In construction, the use of polyurethane sealants in both residential and commercial buildings is growing due to their ability to provide long-lasting performance in sealing joints, windows, and doors. We analyze trends in the existing and future market, explore pricing strategies, and examine the key drivers influencing the pricing dynamics. Our report provides a detailed overview of key patents shaping the industry landscape.
To Get more information on Polyurethane Sealants Market - Request Free Sample Report
Drivers
Increased automotive production and innovation which drives the market growth.
Rapid growth in automotive production and manufacturing along with automotive innovation is a major propellant for the growth of Polyurethane Sealants Market. In vehicle assembly, these sealants are important sealing materials used for windows, sunroofs, windshields and joints. The right materials for the job; along with their durable, weather-resistant, and adaptable properties across a number of different automotive components, ensure optimal vehicle lifespan and strength. In addition, advances in automotive design such as lightweight materials and more sophisticated vehicle architectures have led to an increased demand for high-performance sealants that are designed to deliver under the most extreme conditions. Additionally, the increased emphasis on fuel economy, safety, and aesthetics leads to increased requirements for advanced sealants that assist with noise, thermal and acoustic insulation, and corrosion resistance. The automotive industry keeps on seeing modern automobile technologies being developed each passing year, for example, independent vehicles, and electric powertrains, and that will prompt more demand for high-performance polyurethane sealants, further driving the development of the referenced market.
Restraint
High raw material costs may hamper the market growth.
The significant increases and fluctuations in the prices of these raw materials owing to either disruption of supply chain, astronomical rise in prices of crude oil or limitations in the production capability of the desired chemicals, will lead to the vegan to sustain their profit margins, by increasing the costs of the polyurethane products where these raw materials are required. The changes in those prices affect the total production costs for the manufacturers and, respectively, the pricing of end products. The increase in the price of raw materials may compel the manufacturers to raise the price of polyurethane sealants, which can lead to a decline in demand, especially in price-sensitive regions.
Opportunity
Increasing construction and infrastructure activities which create the opportunity in the market.
The growing number of construction and infrastructure activities create a lucrative opportunity for the Polyurethane Sealants Market. With further development in urbanization, both home and business sectors are moving toward durable, weather-resistant, and energy-efficient materials. Construction professionals appreciate polyurethane sealants for their combination of strong adhesion, flexibility, and durability used for windows, doors, joints, and facade sealing. These fittings help the energy efficiency of the buildings by providing a perfect air-tight seal which is must to avoid temperature loss and furthermore conserving energy. Along with huge infrastructure projects (road, bridge, air, and rail) expansion, polyurethane sealants are more common than ever to ensure the certainty of structural strength, while also preventing wear and corrosion by way of environmental-induced stresses. The rugged characteristics of these sealants, their tolerance to extreme temperatures, moisture, and UV exposure makes it perfectly suitable for construction and infrastructure projects where the conditions are harsh.
Challenges
Complexity in manufacturing and application may create the challenge for the market.
The application versatility and high performance of polyurethane sealants are the largest hindrances to the market owing to their complex nature in both manufacture and application. Polyurethane sealants should be formulated exactly, and knowledge is needed on how to manufacture them in a way that can produce consistent quality and performance of the product. To gain the best results, manufacturers need to control variables like humidity, temperature, and curing times. This complexity increases production costs and drives lead time, challenging manufacturers in the ability to scale production rapidly. Moreover, the application process can also be complicated, since the process involves critical surface preparation, controlled environmental conditions, and careful handling during the installation process for suitable bonding and durability of the product.
By Type
One Component segment held the largest market share around 68% in 2023. It is easy to use, economical, and is suitable for application in wide ranges of applications. One component sealant is like instant coffee; there is no need to mix hardeners or catalysts with the sealants, and therefore are the most convenient type of sealants, for professionals and do-it-yourselfers alike. They gained their popularity among different industries such as construction, automotive, and manufacturing, all due to this simple application. Additionally, they are appealing because, when they cure upon exposure to moisture or air, they can save a lot of time over two-component systems, which require more complex mixing and curing processes. Moreover, One Component sealants have outstanding adhesion, flexibility, and weather resistance which makes them excellent for sealing joints, gaps, and seams in windows, doors, facades, and automotive parts.
By End-Use Industry
The Building & Construction segment held the largest market share around 34% in 2023. Increasing demand for durable, weather-resistant, and energy-efficient materials in construction projects. This industry employs polyurethane sealants relatively frequently since they possess significant adhesion capacity, flexibility, and toughness that make them an excellent choice for moisture, UV, and extreme temperature resistance to ensure durability and structural integrity of buildings. Joint sealants are vital for sealing joints, windows, doors, facades, and other leaks prone areas to avoid the loss of energy-efficient and structural integrity because of air and water leaks. The increasing urbanization across the globe, the growing development of infrastructure, and a surge in the demand for green building practices will contribute to the increasing demand for high-performance sealants.
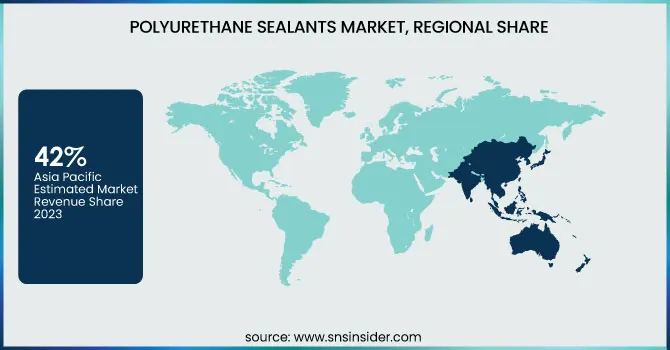
Asia Pacific held the largest market share around 42% in 2023. The growing construction and manufacturing activities in China, India, Japan, South Korea, etc. are anticipated to fuel the demand for high-performance sealants in these countries. Another factor driving residential and commercial construction is the expanding middle class and rising disposable income; this trend has also risen the demand for dependable, weather-resistant sealants for buildings, automotive, and infrastructure. The soaring automotive industry in the region is further helping the demand for polyurethane sealants in vehicle assembly, specifically for electric vehicles (EVs) and lightweight structures. Moreover, polyurethane sealants in Asia-Pacific are benefitting from government initiatives to expand the infrastructure, like smart city projects and the development of large transportation networks.
Get Customized Report as per Your Business Requirement - Enquiry Now
Key Players
3M (Scotch-Weld, 3M VHB Tape)
Arkema N.V. (Bostik) (Bostik Thermogrip, Bostik 1000)
Sika AG (Sikaflex, Sikadur)
H.B. Fuller (ProPoxy, FullerBond)
Henkel AG & Co.KGaA (Loctite, Teroson)
BASF SE (BASF Elastopor, BASF Polyurethane)
The Dow Chemical Company (DOWSIL, DOW Brand Sealants)
MAPEI S.p.A (MapeSeal, Mapelastic)
Asian Paints Ltd. (Apcolite, Royale Glitz)
ITW Polymers Sealants North America, Inc (Polyseamseal, Devcon)
Huntsman Corporation (Araldite, Huntsman Epoxy)
Momentive Performance Materials (Momentive Silicones, Momentive Epoxies)
Wacker Chemie AG (Silicone Sealant, Wacker Silicone Fluid)
AkzoNobel N.V. (Dulux, International Paint)
RPM International Inc. (Rust-Oleum, DAP)
BASF Polyurethanes (BASF PU Systems, Elastopan)
SABIC (LEXAN Polycarbonate, SABIC PP)
Tremco Incorporated (Tremco Sealants, Tremco Coatings)
DowDuPont (Corian, DuPont Tyvek)
Saint-Gobain (Weber, Isover)
Recent Development:
In November 2023, Henkel launched the first bio-based PUR adhesives for load-bearing timber construction in November 2023. Loctite engineered wood adhesives, HB S ECO and CR 821 ECO reduce CO₂ equivalent emissions by over 60% versus fossil-based solutions, aligning with our customers' growing need of providing sustainable construction materials.
In March 2023, Bostik opened a new technology center in Shanghai to increase its capacity for research and development. Bostik's Asia Technology Center (ATC) is expanded by this facility, which seeks to improve the company's capacity to provide cutting-edge adhesive and sealant solutions that are suited to the demands of the Asian market.
| Report Attributes | Details |
|---|---|
| Market Size in 2023 | USD 3.22 Billion |
| Market Size by 2032 | USD 4.68 Billion |
| CAGR | CAGR of4.23% From 2024 to 2032 |
| Base Year | 2023 |
| Forecast Period | 2024-2032 |
| Historical Data | 2020-2022 |
| Report Scope & Coverage | Market Size, Segments Analysis, Competitive Landscape, Regional Analysis, DROC & SWOT Analysis, Forecast Outlook |
| Key Segments | • By Type (One-Component and Two-Component) • By End-Use Industry, (Building and Construction, Automotive, General Industrial, Marine) |
| Regional Analysis/Coverage | North America (US, Canada, Mexico), Europe (Eastern Europe [Poland, Romania, Hungary, Turkey, Rest of Eastern Europe] Western Europe] Germany, France, UK, Italy, Spain, Netherlands, Switzerland, Austria, Rest of Western Europe]), Asia Pacific (China, India, Japan, South Korea, Vietnam, Singapore, Australia, Rest of Asia Pacific), Middle East & Africa (Middle East [UAE, Egypt, Saudi Arabia, Qatar, Rest of Middle East], Africa [Nigeria, South Africa, Rest of Africa], Latin America (Brazil, Argentina, Colombia, Rest of Latin America) |
| Company Profiles | 3M, Arkema N.V., Sika AG, H.B. Fuller, Henkel AG & Co.KGaA, BASF SE, The Dow Chemical Company, MAPEI S.p.A, Asian Paints Ltd., ITW Polymers Sealants North America, Inc, Huntsman Corporation, Momentive Performance Materials, Wacker Chemie AG, AkzoNobel N.V., RPM International Inc., BASF Polyurethanes, SABIC, Tremco Incorporated, DowDuPont, Saint-Gobain |
Ans: The Polyurethane Sealants Market was valued at USD 3.22 Billion in 2023.
Ans: The expected CAGR of the global Polyurethane Sealants Market during the forecast period is 4.23%.
Ans: The Building & Construction will grow rapidly in the Polyurethane Sealants Market from 2024-2032.
Ans: Increased automotive production and innovation which drives the market growth.
Ans: Asia Pacific led the Polyurethane Sealants Market in the region with the highest revenue share in 2023.
Table of Contents:
1. Introduction
1.1 Market Definition
1.2 Scope (Inclusion and Exclusions)
1.3 Research Assumptions
2. Executive Summary
2.1 Market Overview
2.2 Regional Synopsis
2.3 Competitive Summary
3. Research Methodology
3.1 Top-Down Approach
3.2 Bottom-up Approach
3.3. Data Validation
3.4 Primary Interviews
4. Market Dynamics Impact Analysis
3.1 Market Driving Factors Analysis
3.1.2 Drivers
3.1.2 Restraints
3.1.3 Opportunities
3.1.4 Challenges
3.2 PESTLE Analysis
3.3 Porter’s Five Forces Model
5. Statistical Insights and Trends Reporting
5.1 Production Capacity and Utilization, by Country, By Type, 2023
5.2 Feedstock Prices, by Country, By Type, 2023
5.3 Regulatory Impact, by Country, By Type 2023.
5.4 Environmental Metrics: Emissions Data, Waste Management Practices, and Sustainability Initiatives, by Region
5.5 Innovation and R&D, Type, 2023
6. Competitive Landscape
6.1 List of Major Companies, By Region
6.2 Market Share Analysis, By Region
6.3 Product Benchmarking
6.3.1 Product specifications and features
6.3.2 Pricing
6.4 Strategic Initiatives
6.4.1 Marketing and promotional activities
6.4.2 Distribution and Supply Chain Strategies
6.4.3 Expansion Plans and New Product Launches
6.4.4 Strategic partnerships and collaborations
6.5 Technological Advancements
6.6 Market Positioning and Branding
7. Polyurethane Sealants Market Segmentation, By Type
7.1 Chapter Overview
7.2 One Component
7.2.1 One Component Trends Analysis (2020-2032)
7.2.2 One Component Market Size Estimates and Forecasts to 2032 (USD Billion)
7.3 Two Component
7.3.1 Two Component Market Trends Analysis (2020-2032)
7.3.2 Two Component Market Size Estimates and Forecasts to 2032 (USD Billion)
8. Polyurethane Sealants Market Segmentation, by End-Use Industry
8.1 Chapter Overview
8.2 Building & Construction
8.2.1 Building & Construction Market Trends Analysis (2020-2032)
8.2.2 Building & Construction Market Size Estimates and Forecasts to 2032 (USD Billion)
8.3 Automotive
8.3.1 Automotive Market Trends Analysis (2020-2032)
8.3.2 Automotive Market Size Estimates and Forecasts to 2032 (USD Billion)
8.4 General Industrial
8.4.1 General Industrial Market Trends Analysis (2020-2032)
8.4.2 General Industrial Market Size Estimates and Forecasts to 2032 (USD Billion)
8.5 Marine
8.5.1 Marine Market Trends Analysis (2020-2032)
8.5.2 Marine Market Size Estimates and Forecasts to 2032 (USD Billion)
9. Regional Analysis
9.1 Chapter Overview
9.2 North America
9.2.1 Trends Analysis
9.2.2 North America Polyurethane Sealants Market Estimates and Forecasts, by Country (2020-2032) (USD Billion)
9.2.3 North America Polyurethane Sealants Market Estimates and Forecasts, By Type (2020-2032) (USD Billion)
9.2.4 North America Polyurethane Sealants Market Estimates and Forecasts, by End-Use Industry (2020-2032) (USD Billion)
9.2.5 USA
9.2.5.1 USA Polyurethane Sealants Market Estimates and Forecasts, By Type (2020-2032) (USD Billion)
9.2.5.2 USA Polyurethane Sealants Market Estimates and Forecasts, by End-Use Industry (2020-2032) (USD Billion)
9.2.6 Canada
9.2.6.1 Canada Polyurethane Sealants Market Estimates and Forecasts, By Type (2020-2032) (USD Billion)
9.2.6.2 Canada Polyurethane Sealants Market Estimates and Forecasts, by End-Use Industry (2020-2032) (USD Billion)
9.2.7 Mexico
9.2.7.1 Mexico Polyurethane Sealants Market Estimates and Forecasts, By Type (2020-2032) (USD Billion)
9.2.7.2 Mexico Polyurethane Sealants Market Estimates and Forecasts, by End-Use Industry (2020-2032) (USD Billion)
9.3 Europe
9.3.1 Eastern Europe
9.3.1.1 Trends Analysis
9.3.1.2 Eastern Europe Polyurethane Sealants Market Estimates and Forecasts, by Country (2020-2032) (USD Billion)
9.3.1.3 Eastern Europe Polyurethane Sealants Market Estimates and Forecasts, By Type (2020-2032) (USD Billion)
9.3.1.4 Eastern Europe Polyurethane Sealants Market Estimates and Forecasts, by End-Use Industry (2020-2032) (USD Billion)
9.3.1.5 Poland
9.3.1.5.1 Poland Polyurethane Sealants Market Estimates and Forecasts, By Type (2020-2032) (USD Billion)
9.3.1.5.2 Poland Polyurethane Sealants Market Estimates and Forecasts, by End-Use Industry (2020-2032) (USD Billion)
9.3.1.6 Romania
9.3.1.6.1 Romania Polyurethane Sealants Market Estimates and Forecasts, By Type (2020-2032) (USD Billion)
9.3.1.6.2 Romania Polyurethane Sealants Market Estimates and Forecasts, by End-Use Industry (2020-2032) (USD Billion)
9.3.1.7 Hungary
9.3.1.7.1 Hungary Polyurethane Sealants Market Estimates and Forecasts, By Type (2020-2032) (USD Billion)
9.3.1.7.2 Hungary Polyurethane Sealants Market Estimates and Forecasts, by End-Use Industry (2020-2032) (USD Billion)
9.3.1.8 Turkey
9.3.1.8.1 Turkey Polyurethane Sealants Market Estimates and Forecasts, By Type (2020-2032) (USD Billion)
9.3.1.8.2 Turkey Polyurethane Sealants Market Estimates and Forecasts, by End-Use Industry (2020-2032) (USD Billion)
9.3.1.9 Rest of Eastern Europe
9.3.1.9.1 Rest of Eastern Europe Polyurethane Sealants Market Estimates and Forecasts, By Type (2020-2032) (USD Billion)
9.3.1.9.2 Rest of Eastern Europe Polyurethane Sealants Market Estimates and Forecasts, by End-Use Industry (2020-2032) (USD Billion)
9.3.2 Western Europe
9.3.2.1 Trends Analysis
9.3.2.2 Western Europe Polyurethane Sealants Market Estimates and Forecasts, by Country (2020-2032) (USD Billion)
9.3.2.3 Western Europe Polyurethane Sealants Market Estimates and Forecasts, By Type (2020-2032) (USD Billion)
9.3.2.4 Western Europe Polyurethane Sealants Market Estimates and Forecasts, by End-Use Industry (2020-2032) (USD Billion)
9.3.2.5 Germany
9.3.2.5.1 Germany Polyurethane Sealants Market Estimates and Forecasts, By Type (2020-2032) (USD Billion)
9.3.2.5.2 Germany Polyurethane Sealants Market Estimates and Forecasts, by End-Use Industry (2020-2032) (USD Billion)
9.3.2.6 France
9.3.2.6.1 France Polyurethane Sealants Market Estimates and Forecasts, By Type (2020-2032) (USD Billion)
9.3.2.6.2 France Polyurethane Sealants Market Estimates and Forecasts, by End-Use Industry (2020-2032) (USD Billion)
9.3.2.7 UK
9.3.2.7.1 UK Polyurethane Sealants Market Estimates and Forecasts, By Type (2020-2032) (USD Billion)
9.3.2.7.2 UK Polyurethane Sealants Market Estimates and Forecasts, by End-Use Industry (2020-2032) (USD Billion)
9.3.2.8 Italy
9.3.2.8.1 Italy Polyurethane Sealants Market Estimates and Forecasts, By Type (2020-2032) (USD Billion)
9.3.2.8.2 Italy Polyurethane Sealants Market Estimates and Forecasts, by End-Use Industry (2020-2032) (USD Billion)
9.3.2.9 Spain
9.3.2.9.1 Spain Polyurethane Sealants Market Estimates and Forecasts, By Type (2020-2032) (USD Billion)
9.3.2.9.2 Spain Polyurethane Sealants Market Estimates and Forecasts, by End-Use Industry (2020-2032) (USD Billion)
9.3.2.10 Netherlands
9.3.2.10.1 Netherlands Polyurethane Sealants Market Estimates and Forecasts, By Type (2020-2032) (USD Billion)
9.3.2.10.2 Netherlands Polyurethane Sealants Market Estimates and Forecasts, by End-Use Industry (2020-2032) (USD Billion)
9.3.2.11 Switzerland
9.3.2.11.1 Switzerland Polyurethane Sealants Market Estimates and Forecasts, By Type (2020-2032) (USD Billion)
9.3.2.11.2 Switzerland Polyurethane Sealants Market Estimates and Forecasts, by End-Use Industry (2020-2032) (USD Billion)
9.3.2.12 Austria
9.3.2.12.1 Austria Polyurethane Sealants Market Estimates and Forecasts, By Type (2020-2032) (USD Billion)
9.3.2.12.2 Austria Polyurethane Sealants Market Estimates and Forecasts, by End-Use Industry (2020-2032) (USD Billion)
9.3.2.13 Rest of Western Europe
9.3.2.13.1 Rest of Western Europe Polyurethane Sealants Market Estimates and Forecasts, By Type (2020-2032) (USD Billion)
9.3.2.13.2 Rest of Western Europe Polyurethane Sealants Market Estimates and Forecasts, by End-Use Industry (2020-2032) (USD Billion)
9.4 Asia Pacific
9.4.1 Trends Analysis
9.4.2 Asia Pacific Polyurethane Sealants Market Estimates and Forecasts, by Country (2020-2032) (USD Billion)
9.4.3 Asia Pacific Polyurethane Sealants Market Estimates and Forecasts, By Type (2020-2032) (USD Billion)
9.4.4 Asia Pacific Polyurethane Sealants Market Estimates and Forecasts, by End-Use Industry (2020-2032) (USD Billion)
9.4.5 China
9.4.5.1 China Polyurethane Sealants Market Estimates and Forecasts, By Type (2020-2032) (USD Billion)
9.4.5.2 China Polyurethane Sealants Market Estimates and Forecasts, by End-Use Industry (2020-2032) (USD Billion)
9.4.6 India
9.4.5.1 India Polyurethane Sealants Market Estimates and Forecasts, By Type (2020-2032) (USD Billion)
9.4.5.2 India Polyurethane Sealants Market Estimates and Forecasts, by End-Use Industry (2020-2032) (USD Billion)
9.4.5 Japan
9.4.5.1 Japan Polyurethane Sealants Market Estimates and Forecasts, By Type (2020-2032) (USD Billion)
9.4.5.2 Japan Polyurethane Sealants Market Estimates and Forecasts, by End-Use Industry (2020-2032) (USD Billion)
9.4.6 South Korea
9.4.6.1 South Korea Polyurethane Sealants Market Estimates and Forecasts, By Type (2020-2032) (USD Billion)
9.4.6.2 South Korea Polyurethane Sealants Market Estimates and Forecasts, by End-Use Industry (2020-2032) (USD Billion)
9.4.7 Vietnam
9.4.7.1 Vietnam Polyurethane Sealants Market Estimates and Forecasts, By Type (2020-2032) (USD Billion)
9.2.7.2 Vietnam Polyurethane Sealants Market Estimates and Forecasts, by End-Use Industry (2020-2032) (USD Billion)
9.4.8 Singapore
9.4.8.1 Singapore Polyurethane Sealants Market Estimates and Forecasts, By Type (2020-2032) (USD Billion)
9.4.8.2 Singapore Polyurethane Sealants Market Estimates and Forecasts, by End-Use Industry (2020-2032) (USD Billion)
9.4.9 Australia
9.4.9.1 Australia Polyurethane Sealants Market Estimates and Forecasts, By Type (2020-2032) (USD Billion)
9.4.9.2 Australia Polyurethane Sealants Market Estimates and Forecasts, by End-Use Industry (2020-2032) (USD Billion)
9.4.10 Rest of Asia Pacific
9.4.10.1 Rest of Asia Pacific Polyurethane Sealants Market Estimates and Forecasts, By Type (2020-2032) (USD Billion)
9.4.10.2 Rest of Asia Pacific Polyurethane Sealants Market Estimates and Forecasts, by End-Use Industry (2020-2032) (USD Billion)
9.5 Middle East and Africa
9.5.1 Middle East
9.5.1.1 Trends Analysis
9.5.1.2 Middle East Polyurethane Sealants Market Estimates and Forecasts, by Country (2020-2032) (USD Billion)
9.5.1.3 Middle East Polyurethane Sealants Market Estimates and Forecasts, By Type (2020-2032) (USD Billion)
9.5.1.4 Middle East Polyurethane Sealants Market Estimates and Forecasts, by End-Use Industry (2020-2032) (USD Billion)
9.5.1.5 UAE
9.5.1.5.1 UAE Polyurethane Sealants Market Estimates and Forecasts, By Type (2020-2032) (USD Billion)
9.5.1.5.2 UAE Polyurethane Sealants Market Estimates and Forecasts, by End-Use Industry (2020-2032) (USD Billion)
9.5.1.6 Egypt
9.5.1.6.1 Egypt Polyurethane Sealants Market Estimates and Forecasts, By Type (2020-2032) (USD Billion)
9.5.1.6.2 Egypt Polyurethane Sealants Market Estimates and Forecasts, by End-Use Industry (2020-2032) (USD Billion)
9.5.1.7 Saudi Arabia
9.5.1.7.1 Saudi Arabia Polyurethane Sealants Market Estimates and Forecasts, By Type (2020-2032) (USD Billion)
9.5.1.7.2 Saudi Arabia Polyurethane Sealants Market Estimates and Forecasts, by End-Use Industry (2020-2032) (USD Billion)
9.5.1.8 Qatar
9.5.1.8.1 Qatar Polyurethane Sealants Market Estimates and Forecasts, By Type (2020-2032) (USD Billion)
9.5.1.8.2 Qatar Polyurethane Sealants Market Estimates and Forecasts, by End-Use Industry (2020-2032) (USD Billion)
9.5.1.9 Rest of Middle East
9.5.1.9.1 Rest of Middle East Polyurethane Sealants Market Estimates and Forecasts, By Type (2020-2032) (USD Billion)
9.5.1.9.2 Rest of Middle East Polyurethane Sealants Market Estimates and Forecasts, by End-Use Industry (2020-2032) (USD Billion)
9.5.2 Africa
9.5.2.1 Trends Analysis
9.5.2.2 Africa Polyurethane Sealants Market Estimates and Forecasts, by Country (2020-2032) (USD Billion)
9.5.2.3 Africa Polyurethane Sealants Market Estimates and Forecasts, By Type (2020-2032) (USD Billion)
9.5.2.4 Africa Polyurethane Sealants Market Estimates and Forecasts, by End-Use Industry (2020-2032) (USD Billion)
9.5.2.5 South Africa
9.5.2.5.1 South Africa Polyurethane Sealants Market Estimates and Forecasts, By Type (2020-2032) (USD Billion)
9.5.2.5.2 South Africa Polyurethane Sealants Market Estimates and Forecasts, by End-Use Industry (2020-2032) (USD Billion)
9.5.2.6 Nigeria
9.5.2.6.1 Nigeria Polyurethane Sealants Market Estimates and Forecasts, By Type (2020-2032) (USD Billion)
9.5.2.6.2 Nigeria Polyurethane Sealants Market Estimates and Forecasts, by End-Use Industry (2020-2032) (USD Billion)
9.6 Latin America
9.6.1 Trends Analysis
9.6.2 Latin America Polyurethane Sealants Market Estimates and Forecasts, by Country (2020-2032) (USD Billion)
9.6.3 Latin America Polyurethane Sealants Market Estimates and Forecasts, By Type (2020-2032) (USD Billion)
9.6.4 Latin America Polyurethane Sealants Market Estimates and Forecasts, by End-Use Industry (2020-2032) (USD Billion)
9.6.5 Brazil
9.6.5.1 Brazil Polyurethane Sealants Market Estimates and Forecasts, By Type (2020-2032) (USD Billion)
9.6.5.2 Brazil Polyurethane Sealants Market Estimates and Forecasts, by End-Use Industry (2020-2032) (USD Billion)
9.6.6 Argentina
9.6.6.1 Argentina Polyurethane Sealants Market Estimates and Forecasts, By Type (2020-2032) (USD Billion)
9.6.6.2 Argentina Polyurethane Sealants Market Estimates and Forecasts, by End-Use Industry (2020-2032) (USD Billion)
9.6.7 Colombia
9.6.7.1 Colombia Polyurethane Sealants Market Estimates and Forecasts, By Type (2020-2032) (USD Billion)
9.6.7.2 Colombia Polyurethane Sealants Market Estimates and Forecasts, by End-Use Industry (2020-2032) (USD Billion)
9.6.8 Rest of Latin America
9.6.8.1 Rest of Latin America Polyurethane Sealants Market Estimates and Forecasts, By Type (2020-2032) (USD Billion)
9.6.8.2 Rest of Latin America Polyurethane Sealants Market Estimates and Forecasts, by End-Use Industry (2020-2032) (USD Billion)
10. Company Profiles
10.1 3M
10.1.1 Company Overview
10.1.2 Financial
10.1.3 Product / Services Offered
10.1.4 SWOT Analysis
10.2 Arkema N.V.
10.2.1 Company Overview
10.2.2 Financial
10.2.3 Product/ Services Offered
10.2.4 SWOT Analysis
10.3 Sika AG
10.3.1 Company Overview
10.3.2 Financial
10.3.3 Product/ Services Offered
10.3.4 SWOT Analysis
10.4 H.B. Fuller
10.4.1 Company Overview
10.4.2 Financial
10.4.3 Product/ Services Offered
10.4.4 SWOT Analysis
10.5 Henkel AG & Co. KGaA
10.5.1 Company Overview
10.5.2 Financial
10.5.3 Product/ Services Offered
10.5.4 SWOT Analysis
10.6 BASF SE
10.6.1 Company Overview
10.6.2 Financial
10.6.3 Product/ Services Offered
10.6.4 SWOT Analysis
10.7 The Dow Chemical Company
10.7.1 Company Overview
10.7.2 Financial
10.7.3 Product/ Services Offered
10.7.4 SWOT Analysis
10.8 MAPEI S.p.A
10.8.1 Company Overview
10.8.2 Financial
10.8.3 Product/ Services Offered
10.8.4 SWOT Analysis
10.9 Asian Paints Ltd.
10.9.1 Company Overview
10.9.2 Financial
10.9.3 Product/ Services Offered
10.9.4 SWOT Analysis
10.10 Huntsman Corporation
10.10.1 Company Overview
10.10.2 Financial
10.10.3 Product/ Services Offered
10.10.4 SWOT Analysis
11. Use Cases and Best Practices
12. Conclusion
An accurate research report requires proper strategizing as well as implementation. There are multiple factors involved in the completion of good and accurate research report and selecting the best methodology to compete the research is the toughest part. Since the research reports we provide play a crucial role in any company’s decision-making process, therefore we at SNS Insider always believe that we should choose the best method which gives us results closer to reality. This allows us to reach at a stage wherein we can provide our clients best and accurate investment to output ratio.
Each report that we prepare takes a timeframe of 350-400 business hours for production. Starting from the selection of titles through a couple of in-depth brain storming session to the final QC process before uploading our titles on our website we dedicate around 350 working hours. The titles are selected based on their current market cap and the foreseen CAGR and growth.
The 5 steps process:
Step 1: Secondary Research:
Secondary Research or Desk Research is as the name suggests is a research process wherein, we collect data through the readily available information. In this process we use various paid and unpaid databases which our team has access to and gather data through the same. This includes examining of listed companies’ annual reports, Journals, SEC filling etc. Apart from this our team has access to various associations across the globe across different industries. Lastly, we have exchange relationships with various university as well as individual libraries.

Step 2: Primary Research
When we talk about primary research, it is a type of study in which the researchers collect relevant data samples directly, rather than relying on previously collected data. This type of research is focused on gaining content specific facts that can be sued to solve specific problems. Since the collected data is fresh and first hand therefore it makes the study more accurate and genuine.
We at SNS Insider have divided Primary Research into 2 parts.
Part 1 wherein we interview the KOLs of major players as well as the upcoming ones across various geographic regions. This allows us to have their view over the market scenario and acts as an important tool to come closer to the accurate market numbers. As many as 45 paid and unpaid primary interviews are taken from both the demand and supply side of the industry to make sure we land at an accurate judgement and analysis of the market.
This step involves the triangulation of data wherein our team analyses the interview transcripts, online survey responses and observation of on filed participants. The below mentioned chart should give a better understanding of the part 1 of the primary interview.

Part 2: In this part of primary research the data collected via secondary research and the part 1 of the primary research is validated with the interviews from individual consultants and subject matter experts.
Consultants are those set of people who have at least 12 years of experience and expertise within the industry whereas Subject Matter Experts are those with at least 15 years of experience behind their back within the same space. The data with the help of two main processes i.e., FGDs (Focused Group Discussions) and IDs (Individual Discussions). This gives us a 3rd party nonbiased primary view of the market scenario making it a more dependable one while collation of the data pointers.
Step 3: Data Bank Validation
Once all the information is collected via primary and secondary sources, we run that information for data validation. At our intelligence centre our research heads track a lot of information related to the market which includes the quarterly reports, the daily stock prices, and other relevant information. Our data bank server gets updated every fortnight and that is how the information which we collected using our primary and secondary information is revalidated in real time.

Step 4: QA/QC Process
After all the data collection and validation our team does a final level of quality check and quality assurance to get rid of any unwanted or undesired mistakes. This might include but not limited to getting rid of the any typos, duplication of numbers or missing of any important information. The people involved in this process include technical content writers, research heads and graphics people. Once this process is completed the title gets uploader on our platform for our clients to read it.
Step 5: Final QC/QA Process:
This is the last process and comes when the client has ordered the study. In this process a final QA/QC is done before the study is emailed to the client. Since we believe in giving our clients a good experience of our research studies, therefore, to make sure that we do not lack at our end in any way humanly possible we do a final round of quality check and then dispatch the study to the client.
Key Segments:
By Type
One Component
Two Component
By End-Use Industry
Building & Construction
Automotive
General Industrial
Marine
Request for Segment Customization as per your Business Requirement: Segment Customization Request
Regional Coverage:
North America
US
Canada
Mexico
Europe
Eastern Europe
Poland
Romania
Hungary
Turkey
Rest of Eastern Europe
Western Europe
Germany
France
UK
Italy
Spain
Netherlands
Switzerland
Austria
Rest of Western Europe
Asia Pacific
China
India
Japan
South Korea
Vietnam
Singapore
Australia
Rest of Asia Pacific
Middle East & Africa
Middle East
UAE
Egypt
Saudi Arabia
Qatar
Rest of Middle East
Africa
Nigeria
South Africa
Rest of Africa
Latin America
Brazil
Argentina
Colombia
Rest of Latin America
Request for Country Level Research Report: Country Level Customization Request
Available Customization
With the given market data, SNS Insider offers customization as per the company’s specific needs. The following customization options are available for the report:
Product Analysis
Criss-Cross segment analysis (e.g. Product X Application)
Product Matrix which gives a detailed comparison of product portfolio of each company
Geographic Analysis
Additional countries in any of the regions
Company Information
Detailed analysis and profiling of additional market players (Up to five)
The Bioethanol Yeast Market Size was valued at USD 17.5 Billion in 2023 and is expected to reach USD 57.3 Billion by 2032, at a CAGR of 14.1% from 2024-2032.
Roof Coating Market was valued at USD 2.66 Billion in 2023 and is expected to reach USD 3.64 Billion by 2032, growing at a CAGR of 3.54% from 2024 to 2032.
The Rheology Modifiers Market size was USD 8.40 billion in 2023 and is expected to reach USD 11.99 billion by 2032 and grow at a CAGR of 4.04% over the forecast period of 2024-2032.
The Aspartic Acid Market Size was USD 107.7 million in 2023 and is expected to reach USD 193.1 million by 2032 and grow at a CAGR of 6.7% by 2024-2032.
The Heat-Resistant coatings market size was valued at USD 6.80 billion in 2023 and is expected to reach USD 10.60 billion by 2032 and grow at a CAGR of 5.06% over the forecast period 2024-2032.
The Offshore Drilling Fluid Market Size was valued at USD 4.10 Billion in 2023 and is expected to reach USD 6.36 Billion by 2032, growing at a CAGR of 5.01% over the forecast period of 2024-2032.

Hi! Click one of our member below to chat on Phone
© 2025 All Rights Reserved by SNS Insider Pvt Ltd


