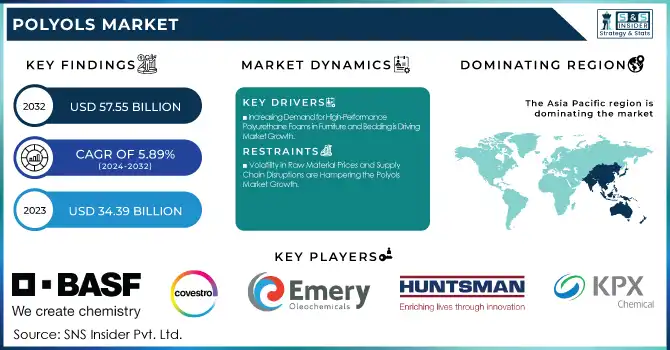
The Polyols Market Size was valued at USD 34.39 Billion in 2023 and is expected to reach USD 57.55 Billion by 2032, growing at a CAGR of 5.89% over the forecast period of 2024-2032.
To Get more information on Polyols Market - Request Free Sample Report
The Polyols Market is evolving with growing demand across construction, automotive, and consumer goods industries. Our report explores the production capacities of key manufacturers, revealing regional supply strengths and competitive landscapes. A thorough pricing analysis of polyols highlights cost variations driven by raw materials, energy expenses, and trade policies. Investment patterns shape market expansion, and the report uncovers investment and funding trends, tracking capital flows and R&D initiatives. Efficiency remains a critical factor, making the yield and efficiency of different polyol types a focal point, comparing production processes and cost-effectiveness. Additionally, regulatory frameworks like REACH and EPA regulations influence sustainability and compliance costs. Our analysis delivers a comprehensive view of these essential factors shaping the polyols industry.
Drivers
Increasing Demand for High-Performance Polyurethane Foams in Furniture and Bedding is Driving Market Growth
The rising consumer preference for high-quality and durable furniture and bedding products has significantly increased the demand for polyurethane foams, which are primarily derived from polyols. These foams offer superior cushioning, comfort, and resilience, making them ideal for use in mattresses, sofas, and ergonomic seating solutions. The furniture and bedding industry have witnessed a shift toward premium and luxury products, particularly in developed economies, driving the adoption of high-performance polyols-based foams. Additionally, growing urbanization and rising disposable incomes in emerging markets have fueled the expansion of the furniture industry, further boosting polyol consumption. Technological advancements in foam production, including the development of low-emission and non-toxic polyurethane foams, have enhanced their appeal among health-conscious consumers. The increasing adoption of memory foams and pressure-relieving mattresses in the healthcare sector is another key factor contributing to market growth. With an increasing number of consumers prioritizing sleep quality and ergonomic comfort, the demand for polyols-based foams in furniture and bedding applications is expected to continue rising.
Restraints
Volatility in Raw Material Prices and Supply Chain Disruptions are Hampering the Polyols Market Growth
The polyols market is highly dependent on the availability and pricing of raw materials, particularly petrochemical-based feedstocks such as propylene oxide and ethylene oxide. Fluctuations in crude oil prices, driven by geopolitical tensions, trade policies, and supply chain disruptions, significantly impact the production costs of synthetic polyols. The ongoing global supply chain crisis, exacerbated by the COVID-19 pandemic and geopolitical conflicts, has led to transportation bottlenecks and increased procurement costs for raw materials. Moreover, stringent environmental regulations on petrochemical refineries and carbon emissions have resulted in fluctuating production capacities, further affecting the supply and pricing of polyols. Small and medium-sized manufacturers, in particular, face challenges in maintaining stable profit margins due to unpredictable raw material costs. These uncertainties hinder long-term investment decisions and limit the expansion of polyols production facilities, slowing overall market growth.
Opportunities
Advancements in Bio-Based Polyols and Green Chemistry are Creating New Market Growth Avenues
The growing focus on sustainability has led to significant research and development efforts in bio-based polyols, presenting a major growth opportunity for the market. Innovations in green chemistry, including the development of polyols derived from plant oils, castor oil, and lignocellulosic biomass, are gaining traction as viable alternatives to petroleum-based counterparts. Several manufacturers are investing in next-generation bio-polyols with improved performance characteristics, lower carbon footprints, and cost competitiveness. The increasing demand for biodegradable and non-toxic polyurethane applications in packaging, healthcare, and automotive industries is expected to drive the adoption of bio-based polyols. Moreover, favourable government policies promoting bio-based chemicals and financial incentives for sustainable product development are accelerating market expansion.
Challenge
High Initial Investment Costs for Bio-Based Polyols Production is Slowing Market Adoption
Despite the growing demand for sustainable alternatives, the production of bio-based polyols requires significant capital investment in feedstock processing, specialized equipment, and advanced refining technologies. The high costs associated with research and development, along with limited commercial-scale production facilities, have made bio-based polyols more expensive than their synthetic counterparts. Additionally, the complexity of raw material sourcing and processing poses challenges in achieving consistent quality and supply reliability. These cost barriers hinder the widespread adoption of bio-based polyols, particularly among small and medium-sized manufacturers with limited financial resources.
By Source
Synthetic polyols dominated the polyols market in 2023 with a market share of 85.2%. The dominance of synthetic polyols is attributed to their cost-effectiveness, superior performance characteristics, and widespread availability compared to bio-based alternatives. Synthetic polyols, primarily derived from petrochemicals such as propylene oxide and ethylene oxide, offer consistent quality and higher efficiency in polyurethane foam production, which is crucial for industries such as automotive, construction, and furniture. According to the American Chemistry Council (ACC), synthetic polyols continue to witness strong demand due to their application in energy-efficient insulation foams and high-performance adhesives. Additionally, despite increasing environmental concerns, regulatory bodies such as the Environmental Protection Agency (EPA) and the European Chemicals Agency (ECHA) have provided exemptions or phased regulations for certain synthetic polyols, ensuring their continued market dominance.
By Type
Polyether polyols dominated the polyols market in 2023 with a market share of 72.3%. Polyether polyols are preferred due to their superior hydrolytic stability, flexibility, and compatibility with various polyurethane applications. Their dominance is driven by their extensive use in both flexible and rigid polyurethane foams, which are essential in construction insulation, automotive seating, and furniture applications. The U.S. Department of Energy (DOE) has emphasized the importance of energy-efficient insulation materials in green building initiatives, further fueling demand for polyether polyols in rigid foam production. Additionally, major polyurethane foam manufacturers, including BASF and Dow, have continued investing in polyether polyols production, strengthening their market position. Their cost-effectiveness and ease of processing make them the preferred choice over polyester polyols in various industrial applications.
By Application
Rigid foam dominated the polyols market in 2023 with a market share of 38.5%. The increasing demand for rigid polyurethane foam in insulation applications across the construction and refrigeration industries has been a major growth driver. Government regulations, such as the U.S. Department of Energy’s energy efficiency standards, have encouraged the adoption of high-performance insulation materials to reduce energy consumption in buildings. Additionally, the European Union’s directive on nearly zero-energy buildings (NZEB) has further increased the need for polyurethane-based rigid foams. Organizations such as the American Society of Heating, Refrigerating and Air-Conditioning Engineers (ASHRAE) have highlighted the effectiveness of rigid polyurethane foam in thermal insulation, supporting its growing adoption. The expansion of cold storage facilities and refrigeration infrastructure globally has also contributed to its dominance in the polyols market.
By End-Use Industry
Building & construction dominated the polyols market in 2023 with a market share of 36.5%. The growing emphasis on energy-efficient infrastructure, coupled with increasing urbanization, has driven the demand for polyurethane-based insulation materials in the construction sector. Regulatory bodies such as the International Energy Agency (IEA) and the U.S. Green Building Council (USGBC) have been actively promoting the use of high-performance insulation solutions, including polyurethane rigid foams, to enhance building energy efficiency. Additionally, government initiatives such as tax incentives for green buildings in North America and Europe have further accelerated the adoption of polyols-based construction materials. The rising investments in smart cities, sustainable housing projects, and commercial infrastructure development continue to reinforce the dominance of the building and construction sector in the polyols market.
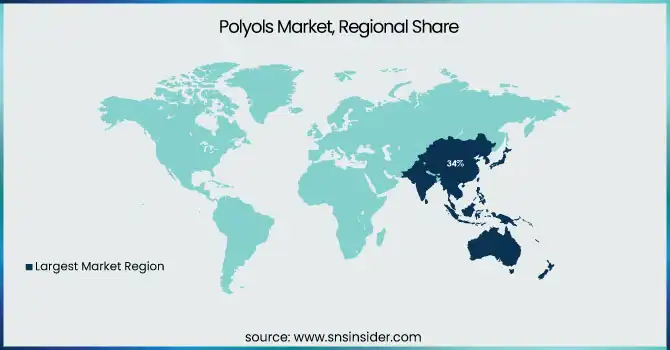
Asia Pacific dominated the polyols market in 2023 with a market share of 34%. The region's dominance is driven by its expanding construction, automotive, and consumer goods industries, which heavily rely on polyols-based polyurethane products. China leads the market due to its vast polyurethane foam production capacity, with the China Polyurethane Industry Association reporting steady growth in domestic consumption, particularly in insulation and furniture applications. The automotive sector in China, the world’s largest vehicle producer, further boosts polyols demand for seating and interior applications. India follows, witnessing a surge in polyurethane foam usage in residential and commercial construction, fueled by government-led infrastructure initiatives such as "Housing for All." Additionally, Japan and South Korea remain key players, with significant investments in high-performance polyurethane applications for electronics and automotive manufacturing. The presence of global manufacturers like BASF, Covestro, and Wanhua Chemical, which continue expanding production facilities in the region, reinforces Asia Pacific’s leading position in the polyols market.
North America emerged as the fastest-growing region in the polyols market, with a significant growth rate during the forecast period. The region’s growth is driven by increasing demand for sustainable and energy-efficient polyurethane-based products, particularly in insulation and automotive applications. The U.S. dominates the North American polyols market, supported by stringent energy efficiency regulations from the Environmental Protection Agency (EPA) and the U.S. Department of Energy (DOE), which promote the adoption of polyurethane insulation materials in buildings. The U.S. automotive industry also significantly contributes to polyols demand, with major manufacturers such as Ford and General Motors incorporating polyurethane foams for lightweighting initiatives. Canada follows with rapid growth in green building projects and government incentives for eco-friendly construction materials. Meanwhile, Mexico’s expanding automotive manufacturing sector, supported by foreign investments from companies like Volkswagen and Toyota, further fuels the regional demand for polyols, positioning North America as the fastest-growing polyols market globally.
Get Customized Report as per Your Business Requirement - Enquiry Now
Key Players
BASF SE (Lupranol, Lupraphen, Pluracol)
Coim Spa (Diexter, Isoexter, Novacote Polyol)
Covestro AG (Arcol, Desmophen, Acclaim)
Emery Oleochemicals (EMEROX, Infigreen, LOXIOL)
Huntsman Corporation / Huntsman International LLC (Jeffol, Terol, Rubinate)
Jayant Agro-Organics Pvt. Ltd. (Jaypol, Bioprene, Pripol)
KPX Chemical Co., Ltd. (KPX Polyol, Terol, KPX Rigid Polyol)
Manali Petrochemicals Limited (Manol, Manapol, MPL Polyol)
Mitsui Chemicals (TAFMER, Excerex, Mitsui Polyol)
Perstorp Holding AB (Boltorn, Curalite, Polyolester)
PCC Group (Rokopol, Rokoflex, Rokopol RF)
Polygreen Chemicals (Greenpolyol, Biopolyol, Ecoflex Polyol)
Purinova Sp. z o.o. (Purios, Polios, Purinova Polyol)
Repsol SA (Repsol Pol, Repsolflex, Alcupol)
Shell Chemicals / Shell Plc (Caradol, Helios, Shell Polyglycol)
Stepan Company (Stepanpol, Stepanol, STEP-FLEX)
The Dow Chemical Company / Dow Inc. (Voranol, VORAPEL, VORASTAR)
Tosoh Corporation (Tolonate, Tocomate, Tosoh Polyol)
Wanhua Chemical Group Co., Ltd. (WANOL, Wannate, Wanhua Polyol)
Yadong Chemical Group (YD-Flex, Yadong Polyol, YD-PU Polyol)
Recent Highlights
October 2024: Manali Petrochemicals expanded its propylene glycol and polyester polyol production capacity in India to meet rising demand for polyurethane products across various industries, reinforcing its position in the polyols market.
April 2024: Sanyo Chemical partnered with Econic Technologies to develop CO₂-based polyols, promoting carbon neutrality by incorporating CO₂ into polyol production and reducing reliance on fossil fuels for more sustainable polyurethane applications.
May 2024: MOL inaugurated a €1.3 billion polyols complex in Hungary, enhancing Europe’s polyols industry by producing high-quality polyols for automotive and construction applications, aiming to reduce import dependency and strengthen MOL’s market position.
Report Attributes | Details |
---|---|
Market Size in 2023 | USD 34.39 Billion |
Market Size by 2032 | USD 57.55 Billion |
CAGR | CAGR of 5.89% From 2024 to 2032 |
Base Year | 2023 |
Forecast Period | 2024-2032 |
Historical Data | 2020-2022 |
Report Scope & Coverage | Market Size, Segments Analysis, Competitive Landscape, Regional Analysis, DROC & SWOT Analysis, Forecast Outlook |
Key Segments | •By Source (Synthetic, Bio-based) •By Type (Polyether Polyols, Polyester Polyols) •By Application (Rigid Foam, Flexible Foam, Coatings, Adhesives & Sealants, Elastomers, Plasticizers, Others) •By End-Use Industry (Building & Construction, Automotive, Furnishings & Bedding, Packaging, Electronics & Electricals, Consumer Goods, Others) |
Regional Analysis/Coverage | North America (US, Canada, Mexico), Europe (Eastern Europe [Poland, Romania, Hungary, Turkey, Rest of Eastern Europe] Western Europe] Germany, France, UK, Italy, Spain, Netherlands, Switzerland, Austria, Rest of Western Europe]), Asia Pacific (China, India, Japan, South Korea, Vietnam, Singapore, Australia, Rest of Asia Pacific), Middle East & Africa (Middle East [UAE, Egypt, Saudi Arabia, Qatar, Rest of Middle East], Africa [Nigeria, South Africa, Rest of Africa], Latin America (Brazil, Argentina, Colombia, Rest of Latin America) |
Company Profiles | Dow Inc., BASF SE, Covestro AG, Shell Plc, Huntsman International LLC, Wanhua Chemical Group Co., Ltd., Stepan Company, Repsol SA, Mitsui Chemicals, Perstorp Holding AB and other key players |
Ans: The Polyols Market was valued at USD 34.39 billion in 2023.
Ans: The Polyols Market is expected to reach USD 57.55 billion by 2032, growing at a CAGR of 5.89%.
Ans: The Polyols Market pricing is affected by raw material costs, energy expenses, and trade policies.
Ans: The Polyols Market is shifting towards bio-based polyols due to green chemistry and environmental regulations.
Ans: The Polyols Market includes key players like BASF, Covestro, Dow, Huntsman, and Wanhua Chemical.
Table of Contents:
1. Introduction
1.1 Market Definition
1.2 Scope (Inclusion and Exclusions)
1.3 Research Assumptions
2. Executive Summary
2.1 Market Overview
2.2 Regional Synopsis
2.3 Competitive Summary
3. Research Methodology
3.1 Top-Down Approach
3.2 Bottom-up Approach
3.3. Data Validation
3.4 Primary Interviews
4. Market Dynamics Impact Analysis
4.1 Market Driving Factors Analysis
4.1.1 Drivers
4.1.2 Restraints
4.1.3 Opportunities
4.1.4 Challenges
4.2 PESTLE Analysis
4.3 Porter’s Five Forces Model
5. Statistical Insights and Trends Reporting
5.1 Production Capacities of Key Manufacturers
5.2 Pricing Analysis of Polyols
5.3 Investment & Funding Trends
5.4 Yield & Efficiency of Different Polyol Sources
5.5 Impact of REACH & EPA Regulations
6. Competitive Landscape
6.1 List of Major Companies, By Region
6.2 Market Share Analysis, By Region
6.3 Product Benchmarking
6.3.1 Product specifications and features
6.3.2 Pricing
6.4 Strategic Initiatives
6.4.1 Marketing and promotional activities
6.4.2 Distribution and supply chain strategies
6.4.3 Expansion plans and new product launches
6.4.4 Strategic partnerships and collaborations
6.5 Technological Advancements
6.6 Market Positioning and Branding
7. Polyols Market Segmentation, by Source
7.1 Chapter Overview
7.2 Synthetic
7.2.1 Synthetic Market Trends Analysis (2020-2032)
7.2.2 Synthetic Market Size Estimates and Forecasts to 2032 (USD Billion)
7.3 Bio-based
7.3.1 Bio-based Market Trends Analysis (2020-2032)
7.3.2 Bio-based Market Size Estimates and Forecasts to 2032 (USD Billion)
8. Polyols Market Segmentation, by Type
8.1 Chapter Overview
8.2 Polyether Polyols
8.2.1 Polyether Polyols Market Trends Analysis (2020-2032)
8.2.2 Polyether Polyols Market Size Estimates and Forecasts to 2032 (USD Billion)
8.3 Polyester Polyols
8.3.1 Polyester Polyols Market Trends Analysis (2020-2032)
8.3.2 Polyester Polyols Market Size Estimates and Forecasts to 2032 (USD Billion)
9. Polyols Market Segmentation, by Application
9.1 Chapter Overview
9.2 Rigid Foam
9.2.1 Rigid Foam Market Trends Analysis (2020-2032)
9.2.2 Rigid Foam Market Size Estimates and Forecasts to 2032 (USD Billion)
9.3 Flexible Foam
9.3.1 Flexible Foam Market Trends Analysis (2020-2032)
9.3.2 Flexible Foam Market Size Estimates and Forecasts to 2032 (USD Billion)
9.4 Coatings
9.4.1 Coatings Market Trends Analysis (2020-2032)
9.4.2 Coatings Market Size Estimates and Forecasts to 2032 (USD Billion)
9.5 Adhesives & Sealants
9.5.1 Adhesives & Sealants Market Trends Analysis (2020-2032)
9.5.2 Adhesives & Sealants Market Size Estimates and Forecasts to 2032 (USD Billion)
9.6 Elastomers
9.6.1 Elastomers Market Trends Analysis (2020-2032)
9.6.2 Elastomers Market Size Estimates and Forecasts to 2032 (USD Billion)
9.7 Plasticizers
9.7.1 Plasticizers Market Trends Analysis (2020-2032)
9.7.2 Plasticizers Market Size Estimates and Forecasts to 2032 (USD Billion)
9.8 Others
9.8.1 Others Market Trends Analysis (2020-2032)
9.8.2 Others Market Size Estimates and Forecasts to 2032 (USD Billion)
10. Polyols Market Segmentation, by End-Use Industry
10.1 Chapter Overview
10.2 Building & Construction
10.2.1 Building & Construction Market Trends Analysis (2020-2032)
10.2.2 Building & Construction Market Size Estimates and Forecasts to 2032 (USD Billion)
10.3 Automotive
10.3.1 Automotive Market Trends Analysis (2020-2032)
10.3.2 Automotive Market Size Estimates and Forecasts to 2032 (USD Billion)
10.4 Furnishings & Bedding
10.4.1 Furnishings & Bedding Market Trends Analysis (2020-2032)
10.4.2 Furnishings & Bedding Market Size Estimates and Forecasts to 2032 (USD Billion)
10.5 Packaging
10.5.1 Packaging Market Trends Analysis (2020-2032)
10.5.2 Packaging Market Size Estimates and Forecasts to 2032 (USD Billion)
10.6 Electronics & Electricals
10.6.1 Electronics & Electricals Market Trends Analysis (2020-2032)
10.6.2 Electronics & Electricals Market Size Estimates and Forecasts to 2032 (USD Billion)
10.7 Consumer Goods
10.7.1 Consumer Goods Market Trends Analysis (2020-2032)
10.7.2 Consumer Goods Market Size Estimates and Forecasts to 2032 (USD Billion)
10.8 Others
10.8.1 Others Market Trends Analysis (2020-2032)
10.8.2 Others Market Size Estimates and Forecasts to 2032 (USD Billion)
11. Regional Analysis
11.1 Chapter Overview
11.2 North America
11.2.1 Trends Analysis
11.2.2 North America Polyols Market Estimates and Forecasts, by Country (2020-2032) (USD Billion)
11.2.3 North America Polyols Market Estimates and Forecasts, by Source (2020-2032) (USD Billion)
11.2.4 North America Polyols Market Estimates and Forecasts, by Type (2020-2032) (USD Billion)
11.2.5 North America Polyols Market Estimates and Forecasts, by Application (2020-2032) (USD Billion)
11.2.6 North America Polyols Market Estimates and Forecasts, by End-Use Industry (2020-2032) (USD Billion)
11.2.7 USA
11.2.7.1 USA Polyols Market Estimates and Forecasts, by Source (2020-2032) (USD Billion)
11.2.7.2 USA Polyols Market Estimates and Forecasts, by Type (2020-2032) (USD Billion)
11.2.7.3 USA Polyols Market Estimates and Forecasts, by Application (2020-2032) (USD Billion)
11.2.7.4 USA Polyols Market Estimates and Forecasts, by End-Use Industry (2020-2032) (USD Billion)
11.2.8 Canada
11.2.8.1 Canada Polyols Market Estimates and Forecasts, by Source (2020-2032) (USD Billion)
11.2.8.2 Canada Polyols Market Estimates and Forecasts, by Type (2020-2032) (USD Billion)
11.2.8.3 Canada Polyols Market Estimates and Forecasts, by Application (2020-2032) (USD Billion)
11.2.8.4 Canada Polyols Market Estimates and Forecasts, by End-Use Industry (2020-2032) (USD Billion)
11.2.9 Mexico
11.2.9.1 Mexico Polyols Market Estimates and Forecasts, by Source (2020-2032) (USD Billion)
11.2.9.2 Mexico Polyols Market Estimates and Forecasts, by Type (2020-2032) (USD Billion)
11.2.9.3 Mexico Polyols Market Estimates and Forecasts, by Application (2020-2032) (USD Billion)
11.2.9.4 Mexico Polyols Market Estimates and Forecasts, by End-Use Industry (2020-2032) (USD Billion)
11.3 Europe
11.3.1 Eastern Europe
11.3.1.1 Trends Analysis
11.3.1.2 Eastern Europe Polyols Market Estimates and Forecasts, by Country (2020-2032) (USD Billion)
11.3.1.3 Eastern Europe Polyols Market Estimates and Forecasts, by Source (2020-2032) (USD Billion)
11.3.1.4 Eastern Europe Polyols Market Estimates and Forecasts, by Type (2020-2032) (USD Billion)
11.3.1.5 Eastern Europe Polyols Market Estimates and Forecasts, by Application (2020-2032) (USD Billion)
11.3.1.6 Eastern Europe Polyols Market Estimates and Forecasts, by End-Use Industry (2020-2032) (USD Billion)
11.3.1.7 Poland
11.3.1.7.1 Poland Polyols Market Estimates and Forecasts, by Source (2020-2032) (USD Billion)
11.3.1.7.2 Poland Polyols Market Estimates and Forecasts, by Type (2020-2032) (USD Billion)
11.3.1.7.3 Poland Polyols Market Estimates and Forecasts, by Application (2020-2032) (USD Billion)
11.3.1.7.4 Poland Polyols Market Estimates and Forecasts, by End-Use Industry (2020-2032) (USD Billion)
11.3.1.8 Romania
11.3.1.8.1 Romania Polyols Market Estimates and Forecasts, by Source (2020-2032) (USD Billion)
11.3.1.8.2 Romania Polyols Market Estimates and Forecasts, by Type (2020-2032) (USD Billion)
11.3.1.8.3 Romania Polyols Market Estimates and Forecasts, by Application (2020-2032) (USD Billion)
11.3.1.8.4 Romania Polyols Market Estimates and Forecasts, by End-Use Industry (2020-2032) (USD Billion)
11.3.1.9 Hungary
11.3.1.9.1 Hungary Polyols Market Estimates and Forecasts, by Source (2020-2032) (USD Billion)
11.3.1.9.2 Hungary Polyols Market Estimates and Forecasts, by Type (2020-2032) (USD Billion)
11.3.1.9.3 Hungary Polyols Market Estimates and Forecasts, by Application (2020-2032) (USD Billion)
11.3.1.9.4 Hungary Polyols Market Estimates and Forecasts, by End-Use Industry (2020-2032) (USD Billion)
11.3.1.10 Turkey
11.3.1.10.1 Turkey Polyols Market Estimates and Forecasts, by Source (2020-2032) (USD Billion)
11.3.1.10.2 Turkey Polyols Market Estimates and Forecasts, by Type (2020-2032) (USD Billion)
11.3.1.10.3 Turkey Polyols Market Estimates and Forecasts, by Application (2020-2032) (USD Billion)
11.3.1.10.4 Turkey Polyols Market Estimates and Forecasts, by End-Use Industry (2020-2032) (USD Billion)
11.3.1.11 Rest of Eastern Europe
11.3.1.11.1 Rest of Eastern Europe Polyols Market Estimates and Forecasts, by Source (2020-2032) (USD Billion)
11.3.1.11.2 Rest of Eastern Europe Polyols Market Estimates and Forecasts, by Type (2020-2032) (USD Billion)
11.3.1.11.3 Rest of Eastern Europe Polyols Market Estimates and Forecasts, by Application (2020-2032) (USD Billion)
11.3.1.11.4 Rest of Eastern Europe Polyols Market Estimates and Forecasts, by End-Use Industry (2020-2032) (USD Billion)
11.3.2 Western Europe
11.3.2.1 Trends Analysis
11.3.2.2 Western Europe Polyols Market Estimates and Forecasts, by Country (2020-2032) (USD Billion)
11.3.2.3 Western Europe Polyols Market Estimates and Forecasts, by Source (2020-2032) (USD Billion)
11.3.2.4 Western Europe Polyols Market Estimates and Forecasts, by Type (2020-2032) (USD Billion)
11.3.2.5 Western Europe Polyols Market Estimates and Forecasts, by Application (2020-2032) (USD Billion)
11.3.2.6 Western Europe Polyols Market Estimates and Forecasts, by End-Use Industry (2020-2032) (USD Billion)
11.3.2.7 Germany
11.3.2.7.1 Germany Polyols Market Estimates and Forecasts, by Source (2020-2032) (USD Billion)
11.3.2.7.2 Germany Polyols Market Estimates and Forecasts, by Type (2020-2032) (USD Billion)
11.3.2.7.3 Germany Polyols Market Estimates and Forecasts, by Application (2020-2032) (USD Billion)
11.3.2.7.4 Germany Polyols Market Estimates and Forecasts, by End-Use Industry (2020-2032) (USD Billion)
11.3.2.8 France
11.3.2.8.1 France Polyols Market Estimates and Forecasts, by Source (2020-2032) (USD Billion)
11.3.2.8.2 France Polyols Market Estimates and Forecasts, by Type (2020-2032) (USD Billion)
11.3.2.8.3 France Polyols Market Estimates and Forecasts, by Application (2020-2032) (USD Billion)
11.3.2.8.4 France Polyols Market Estimates and Forecasts, by End-Use Industry (2020-2032) (USD Billion)
11.3.2.9 UK
11.3.2.9.1 UK Polyols Market Estimates and Forecasts, by Source (2020-2032) (USD Billion)
11.3.2.9.2 UK Polyols Market Estimates and Forecasts, by Type (2020-2032) (USD Billion)
11.3.2.9.3 UK Polyols Market Estimates and Forecasts, by Application (2020-2032) (USD Billion)
11.3.2.9.4 UK Polyols Market Estimates and Forecasts, by End-Use Industry (2020-2032) (USD Billion)
11.3.2.10 Italy
11.3.2.10.1 Italy Polyols Market Estimates and Forecasts, by Source (2020-2032) (USD Billion)
11.3.2.10.2 Italy Polyols Market Estimates and Forecasts, by Type (2020-2032) (USD Billion)
11.3.2.10.3 Italy Polyols Market Estimates and Forecasts, by Application (2020-2032) (USD Billion)
11.3.2.10.4 Italy Polyols Market Estimates and Forecasts, by End-Use Industry (2020-2032) (USD Billion)
11.3.2.11 Spain
11.3.2.11.1 Spain Polyols Market Estimates and Forecasts, by Source (2020-2032) (USD Billion)
11.3.2.11.2 Spain Polyols Market Estimates and Forecasts, by Type (2020-2032) (USD Billion)
11.3.2.11.3 Spain Polyols Market Estimates and Forecasts, by Application (2020-2032) (USD Billion)
11.3.2.11.4 Spain Polyols Market Estimates and Forecasts, by End-Use Industry (2020-2032) (USD Billion)
11.3.2.12 Netherlands
11.3.2.12.1 Netherlands Polyols Market Estimates and Forecasts, by Source (2020-2032) (USD Billion)
11.3.2.12.2 Netherlands Polyols Market Estimates and Forecasts, by Type (2020-2032) (USD Billion)
11.3.2.12.3 Netherlands Polyols Market Estimates and Forecasts, by Application (2020-2032) (USD Billion)
11.3.2.12.4 Netherlands Polyols Market Estimates and Forecasts, by End-Use Industry (2020-2032) (USD Billion)
11.3.2.13 Switzerland
11.3.2.13.1 Switzerland Polyols Market Estimates and Forecasts, by Source (2020-2032) (USD Billion)
11.3.2.13.2 Switzerland Polyols Market Estimates and Forecasts, by Type (2020-2032) (USD Billion)
11.3.2.13.3 Switzerland Polyols Market Estimates and Forecasts, by Application (2020-2032) (USD Billion)
11.3.2.13.4 Switzerland Polyols Market Estimates and Forecasts, by End-Use Industry (2020-2032) (USD Billion)
11.3.2.14 Austria
11.3.2.14.1 Austria Polyols Market Estimates and Forecasts, by Source (2020-2032) (USD Billion)
11.3.2.14.2 Austria Polyols Market Estimates and Forecasts, by Type (2020-2032) (USD Billion)
11.3.2.14.3 Austria Polyols Market Estimates and Forecasts, by Application (2020-2032) (USD Billion)
11.3.2.14.4 Austria Polyols Market Estimates and Forecasts, by End-Use Industry (2020-2032) (USD Billion)
11.3.2.15 Rest of Western Europe
11.3.2.15.1 Rest of Western Europe Polyols Market Estimates and Forecasts, by Source (2020-2032) (USD Billion)
11.3.2.15.2 Rest of Western Europe Polyols Market Estimates and Forecasts, by Type (2020-2032) (USD Billion)
11.3.2.15.3 Rest of Western Europe Polyols Market Estimates and Forecasts, by Application (2020-2032) (USD Billion)
11.3.2.15.4 Rest of Western Europe Polyols Market Estimates and Forecasts, by End-Use Industry (2020-2032) (USD Billion)
11.4 Asia Pacific
11.4.1 Trends Analysis
11.4.2 Asia Pacific Polyols Market Estimates and Forecasts, by Country (2020-2032) (USD Billion)
11.4.3 Asia Pacific Polyols Market Estimates and Forecasts, by Source (2020-2032) (USD Billion)
11.4.4 Asia Pacific Polyols Market Estimates and Forecasts, by Type (2020-2032) (USD Billion)
11.4.5 Asia Pacific Polyols Market Estimates and Forecasts, by Application (2020-2032) (USD Billion)
11.4.6 Asia Pacific Polyols Market Estimates and Forecasts, by End-Use Industry (2020-2032) (USD Billion)
11.4.7 China
11.4.7.1 China Polyols Market Estimates and Forecasts, by Source (2020-2032) (USD Billion)
11.4.7.2 China Polyols Market Estimates and Forecasts, by Type (2020-2032) (USD Billion)
11.4.7.3 China Polyols Market Estimates and Forecasts, by Application (2020-2032) (USD Billion)
11.4.7.4 China Polyols Market Estimates and Forecasts, by End-Use Industry (2020-2032) (USD Billion)
11.4.8 India
11.4.8.1 India Polyols Market Estimates and Forecasts, by Source (2020-2032) (USD Billion)
11.4.8.2 India Polyols Market Estimates and Forecasts, by Type (2020-2032) (USD Billion)
11.4.8.3 India Polyols Market Estimates and Forecasts, by Application (2020-2032) (USD Billion)
11.4.8.4 India Polyols Market Estimates and Forecasts, by End-Use Industry (2020-2032) (USD Billion)
11.4.9 Japan
11.4.9.1 Japan Polyols Market Estimates and Forecasts, by Source (2020-2032) (USD Billion)
11.4.9.2 Japan Polyols Market Estimates and Forecasts, by Type (2020-2032) (USD Billion)
11.4.9.3 Japan Polyols Market Estimates and Forecasts, by Application (2020-2032) (USD Billion)
11.4.9.4 Japan Polyols Market Estimates and Forecasts, by End-Use Industry (2020-2032) (USD Billion)
11.4.10 South Korea
11.4.10.1 South Korea Polyols Market Estimates and Forecasts, by Source (2020-2032) (USD Billion)
11.4.10.2 South Korea Polyols Market Estimates and Forecasts, by Type (2020-2032) (USD Billion)
11.4.10.3 South Korea Polyols Market Estimates and Forecasts, by Application (2020-2032) (USD Billion)
11.4.10.4 South Korea Polyols Market Estimates and Forecasts, by End-Use Industry (2020-2032) (USD Billion)
11.4.11 Vietnam
11.4.11.1 Vietnam Polyols Market Estimates and Forecasts, by Source (2020-2032) (USD Billion)
11.4.11.2 Vietnam Polyols Market Estimates and Forecasts, by Type (2020-2032) (USD Billion)
11.4.11.3 Vietnam Polyols Market Estimates and Forecasts, by Application (2020-2032) (USD Billion)
11.4.11.4 Vietnam Polyols Market Estimates and Forecasts, by End-Use Industry (2020-2032) (USD Billion)
11.4.12 Singapore
11.4.12.1 Singapore Polyols Market Estimates and Forecasts, by Source (2020-2032) (USD Billion)
11.4.12.2 Singapore Polyols Market Estimates and Forecasts, by Type (2020-2032) (USD Billion)
11.4.12.3 Singapore Polyols Market Estimates and Forecasts, by Application (2020-2032) (USD Billion)
11.4.12.4 Singapore Polyols Market Estimates and Forecasts, by End-Use Industry (2020-2032) (USD Billion)
11.4.13 Australia
11.4.13.1 Australia Polyols Market Estimates and Forecasts, by Source (2020-2032) (USD Billion)
11.4.13.2 Australia Polyols Market Estimates and Forecasts, by Type (2020-2032) (USD Billion)
11.4.13.3 Australia Polyols Market Estimates and Forecasts, by Application (2020-2032) (USD Billion)
11.4.13.4 Australia Polyols Market Estimates and Forecasts, by End-Use Industry (2020-2032) (USD Billion)
11.4.14 Rest of Asia Pacific
11.4.14.1 Rest of Asia Pacific Polyols Market Estimates and Forecasts, by Source (2020-2032) (USD Billion)
11.4.14.2 Rest of Asia Pacific Polyols Market Estimates and Forecasts, by Type (2020-2032) (USD Billion)
11.4.14.3 Rest of Asia Pacific Polyols Market Estimates and Forecasts, by Application (2020-2032) (USD Billion)
11.4.14.4 Rest of Asia Pacific Polyols Market Estimates and Forecasts, by End-Use Industry (2020-2032) (USD Billion)
11.5 Middle East and Africa
11.5.1 Middle East
11.5.1.1 Trends Analysis
11.5.1.2 Middle East Polyols Market Estimates and Forecasts, by Country (2020-2032) (USD Billion)
11.5.1.3 Middle East Polyols Market Estimates and Forecasts, by Source (2020-2032) (USD Billion)
11.5.1.4 Middle East Polyols Market Estimates and Forecasts, by Type (2020-2032) (USD Billion)
11.5.1.5 Middle East Polyols Market Estimates and Forecasts, by Application (2020-2032) (USD Billion)
11.5.1.6 Middle East Polyols Market Estimates and Forecasts, by End-Use Industry (2020-2032) (USD Billion)
11.5.1.7 UAE
11.5.1.7.1 UAE Polyols Market Estimates and Forecasts, by Source (2020-2032) (USD Billion)
11.5.1.7.2 UAE Polyols Market Estimates and Forecasts, by Type (2020-2032) (USD Billion)
11.5.1.7.3 UAE Polyols Market Estimates and Forecasts, by Application (2020-2032) (USD Billion)
11.5.1.7.4 UAE Polyols Market Estimates and Forecasts, by End-Use Industry (2020-2032) (USD Billion)
11.5.1.8 Egypt
11.5.1.8.1 Egypt Polyols Market Estimates and Forecasts, by Source (2020-2032) (USD Billion)
11.5.1.8.2 Egypt Polyols Market Estimates and Forecasts, by Type (2020-2032) (USD Billion)
11.5.1.8.3 Egypt Polyols Market Estimates and Forecasts, by Application (2020-2032) (USD Billion)
11.5.1.8.4 Egypt Polyols Market Estimates and Forecasts, by End-Use Industry (2020-2032) (USD Billion)
11.5.1.9 Saudi Arabia
11.5.1.9.1 Saudi Arabia Polyols Market Estimates and Forecasts, by Source (2020-2032) (USD Billion)
11.5.1.9.2 Saudi Arabia Polyols Market Estimates and Forecasts, by Type (2020-2032) (USD Billion)
11.5.1.9.3 Saudi Arabia Polyols Market Estimates and Forecasts, by Application (2020-2032) (USD Billion)
11.5.1.9.4 Saudi Arabia Polyols Market Estimates and Forecasts, by End-Use Industry (2020-2032) (USD Billion)
11.5.1.10 Qatar
11.5.1.10.1 Qatar Polyols Market Estimates and Forecasts, by Source (2020-2032) (USD Billion)
11.5.1.10.2 Qatar Polyols Market Estimates and Forecasts, by Type (2020-2032) (USD Billion)
11.5.1.10.3 Qatar Polyols Market Estimates and Forecasts, by Application (2020-2032) (USD Billion)
11.5.1.10.4 Qatar Polyols Market Estimates and Forecasts, by End-Use Industry (2020-2032) (USD Billion)
11.5.1.11 Rest of Middle East
11.5.1.11.1 Rest of Middle East Polyols Market Estimates and Forecasts, by Source (2020-2032) (USD Billion)
11.5.1.11.2 Rest of Middle East Polyols Market Estimates and Forecasts, by Type (2020-2032) (USD Billion)
11.5.1.11.3 Rest of Middle East Polyols Market Estimates and Forecasts, by Application (2020-2032) (USD Billion)
11.5.1.11.4 Rest of Middle East Polyols Market Estimates and Forecasts, by End-Use Industry (2020-2032) (USD Billion)
11.5.2 Africa
11.5.2.1 Trends Analysis
11.5.2.2 Africa Polyols Market Estimates and Forecasts, by Country (2020-2032) (USD Billion)
11.5.2.3 Africa Polyols Market Estimates and Forecasts, by Source (2020-2032) (USD Billion)
11.5.2.4 Africa Polyols Market Estimates and Forecasts, by Type (2020-2032) (USD Billion)
11.5.2.5 Africa Polyols Market Estimates and Forecasts, by Application (2020-2032) (USD Billion)
11.5.2.6 Africa Polyols Market Estimates and Forecasts, by End-Use Industry (2020-2032) (USD Billion)
11.5.2.7 South Africa
11.5.2.7.1 South Africa Polyols Market Estimates and Forecasts, by Source (2020-2032) (USD Billion)
11.5.2.7.2 South Africa Polyols Market Estimates and Forecasts, by Type (2020-2032) (USD Billion)
11.5.2.7.3 South Africa Polyols Market Estimates and Forecasts, by Application (2020-2032) (USD Billion)
11.5.2.7.4 South Africa Polyols Market Estimates and Forecasts, by End-Use Industry (2020-2032) (USD Billion)
11.5.2.8 Nigeria
11.5.2.8.1 Nigeria Polyols Market Estimates and Forecasts, by Source (2020-2032) (USD Billion)
11.5.2.8.2 Nigeria Polyols Market Estimates and Forecasts, by Type (2020-2032) (USD Billion)
11.5.2.8.3 Nigeria Polyols Market Estimates and Forecasts, by Application (2020-2032) (USD Billion)
11.5.2.8.4 Nigeria Polyols Market Estimates and Forecasts, by End-Use Industry (2020-2032) (USD Billion)
11.5.2.9 Rest of Africa
11.5.2.9.1 Rest of Africa Polyols Market Estimates and Forecasts, by Source (2020-2032) (USD Billion)
11.5.2.9.2 Rest of Africa Polyols Market Estimates and Forecasts, by Type (2020-2032) (USD Billion)
11.5.2.9.3 Rest of Africa Polyols Market Estimates and Forecasts, by Application (2020-2032) (USD Billion)
11.5.2.9.4 Rest of Africa Polyols Market Estimates and Forecasts, by End-Use Industry (2020-2032) (USD Billion)
11.6 Latin America
11.6.1 Trends Analysis
11.6.2 Latin America Polyols Market Estimates and Forecasts, by Country (2020-2032) (USD Billion)
11.6.3 Latin America Polyols Market Estimates and Forecasts, by Source (2020-2032) (USD Billion)
11.6.4 Latin America Polyols Market Estimates and Forecasts, by Type (2020-2032) (USD Billion)
11.6.5 Latin America Polyols Market Estimates and Forecasts, by Application (2020-2032) (USD Billion)
11.6.6 Latin America Polyols Market Estimates and Forecasts, by End-Use Industry (2020-2032) (USD Billion)
11.6.7 Brazil
11.6.7.1 Brazil Polyols Market Estimates and Forecasts, by Source (2020-2032) (USD Billion)
11.6.7.2 Brazil Polyols Market Estimates and Forecasts, by Type (2020-2032) (USD Billion)
11.6.7.3 Brazil Polyols Market Estimates and Forecasts, by Application (2020-2032) (USD Billion)
11.6.7.4 Brazil Polyols Market Estimates and Forecasts, by End-Use Industry (2020-2032) (USD Billion)
11.6.8 Argentina
11.6.8.1 Argentina Polyols Market Estimates and Forecasts, by Source (2020-2032) (USD Billion)
11.6.8.2 Argentina Polyols Market Estimates and Forecasts, by Type (2020-2032) (USD Billion)
11.6.8.3 Argentina Polyols Market Estimates and Forecasts, by Application (2020-2032) (USD Billion)
11.6.8.4 Argentina Polyols Market Estimates and Forecasts, by End-Use Industry (2020-2032) (USD Billion)
11.6.9 Colombia
11.6.9.1 Colombia Polyols Market Estimates and Forecasts, by Source (2020-2032) (USD Billion)
11.6.9.2 Colombia Polyols Market Estimates and Forecasts, by Type (2020-2032) (USD Billion)
11.6.9.3 Colombia Polyols Market Estimates and Forecasts, by Application (2020-2032) (USD Billion)
11.6.9.4 Colombia Polyols Market Estimates and Forecasts, by End-Use Industry (2020-2032) (USD Billion)
11.6.10 Rest of Latin America
11.6.10.1 Rest of Latin America Polyols Market Estimates and Forecasts, by Source (2020-2032) (USD Billion)
11.6.10.2 Rest of Latin America Polyols Market Estimates and Forecasts, by Type (2020-2032) (USD Billion)
11.6.10.3 Rest of Latin America Polyols Market Estimates and Forecasts, by Application (2020-2032) (USD Billion)
11.6.10.4 Rest of Latin America Polyols Market Estimates and Forecasts, by End-Use Industry (2020-2032) (USD Billion)
12. Company Profiles
12.1 Dow Inc.
12.1.1 Company Overview
12.1.2 Financial
12.1.3 Products/ Services Offered
12.1.4 SWOT Analysis
12.2 BASF SE
12.2.1 Company Overview
12.2.2 Financial
12.2.3 Products/ Services Offered
12.2.4 SWOT Analysis
12.3 Covestro AG
12.3.1 Company Overview
12.3.2 Financial
12.3.3 Products/ Services Offered
12.3.4 SWOT Analysis
12.4 Shell Plc
12.4.1 Company Overview
12.4.2 Financial
12.4.3 Products/ Services Offered
12.4.4 SWOT Analysis
12.5 Huntsman International LLC
12.5.1 Company Overview
12.5.2 Financial
12.5.3 Products/ Services Offered
12.5.4 SWOT Analysis
12.6 Wanhua Chemical Group Co., Ltd.
12.6.1 Company Overview
12.6.2 Financial
12.6.3 Products/ Services Offered
12.6.4 SWOT Analysis
12.7 Stepan Company
12.7.1 Company Overview
12.7.2 Financial
12.7.3 Products/ Services Offered
12.7.4 SWOT Analysis
12.8 Repsol SA
12.8.1 Company Overview
12.8.2 Financial
12.8.3 Products/ Services Offered
12.8.4 SWOT Analysis
12.9 Mitsui Chemicals
12.9.1 Company Overview
12.9.2 Financial
12.9.3 Products/ Services Offered
12.9.4 SWOT Analysis
12.10 Perstorp Holding AB
12.10.1 Company Overview
12.10.2 Financial
12.10.3 Products/ Services Offered
12.10.4 SWOT Analysis
13. Use Cases and Best Practices
14. Conclusion
An accurate research report requires proper strategizing as well as implementation. There are multiple factors involved in the completion of good and accurate research report and selecting the best methodology to compete the research is the toughest part. Since the research reports we provide play a crucial role in any company’s decision-making process, therefore we at SNS Insider always believe that we should choose the best method which gives us results closer to reality. This allows us to reach at a stage wherein we can provide our clients best and accurate investment to output ratio.
Each report that we prepare takes a timeframe of 350-400 business hours for production. Starting from the selection of titles through a couple of in-depth brain storming session to the final QC process before uploading our titles on our website we dedicate around 350 working hours. The titles are selected based on their current market cap and the foreseen CAGR and growth.
The 5 steps process:
Step 1: Secondary Research:
Secondary Research or Desk Research is as the name suggests is a research process wherein, we collect data through the readily available information. In this process we use various paid and unpaid databases which our team has access to and gather data through the same. This includes examining of listed companies’ annual reports, Journals, SEC filling etc. Apart from this our team has access to various associations across the globe across different industries. Lastly, we have exchange relationships with various university as well as individual libraries.
Step 2: Primary Research
When we talk about primary research, it is a type of study in which the researchers collect relevant data samples directly, rather than relying on previously collected data. This type of research is focused on gaining content specific facts that can be sued to solve specific problems. Since the collected data is fresh and first hand therefore it makes the study more accurate and genuine.
We at SNS Insider have divided Primary Research into 2 parts.
Part 1 wherein we interview the KOLs of major players as well as the upcoming ones across various geographic regions. This allows us to have their view over the market scenario and acts as an important tool to come closer to the accurate market numbers. As many as 45 paid and unpaid primary interviews are taken from both the demand and supply side of the industry to make sure we land at an accurate judgement and analysis of the market.
This step involves the triangulation of data wherein our team analyses the interview transcripts, online survey responses and observation of on filed participants. The below mentioned chart should give a better understanding of the part 1 of the primary interview.
Part 2: In this part of primary research the data collected via secondary research and the part 1 of the primary research is validated with the interviews from individual consultants and subject matter experts.
Consultants are those set of people who have at least 12 years of experience and expertise within the industry whereas Subject Matter Experts are those with at least 15 years of experience behind their back within the same space. The data with the help of two main processes i.e., FGDs (Focused Group Discussions) and IDs (Individual Discussions). This gives us a 3rd party nonbiased primary view of the market scenario making it a more dependable one while collation of the data pointers.
Step 3: Data Bank Validation
Once all the information is collected via primary and secondary sources, we run that information for data validation. At our intelligence centre our research heads track a lot of information related to the market which includes the quarterly reports, the daily stock prices, and other relevant information. Our data bank server gets updated every fortnight and that is how the information which we collected using our primary and secondary information is revalidated in real time.
Step 4: QA/QC Process
After all the data collection and validation our team does a final level of quality check and quality assurance to get rid of any unwanted or undesired mistakes. This might include but not limited to getting rid of the any typos, duplication of numbers or missing of any important information. The people involved in this process include technical content writers, research heads and graphics people. Once this process is completed the title gets uploader on our platform for our clients to read it.
Step 5: Final QC/QA Process:
This is the last process and comes when the client has ordered the study. In this process a final QA/QC is done before the study is emailed to the client. Since we believe in giving our clients a good experience of our research studies, therefore, to make sure that we do not lack at our end in any way humanly possible we do a final round of quality check and then dispatch the study to the client.
Key Segments:
By Source
Synthetic
Bio-based
By Type
Polyether Polyols
Polyester Polyols
By Application
Rigid Foam
Flexible Foam
Coatings
Adhesives & Sealants
Elastomers
Plasticizers
Others
By End-Use Industry
Building & Construction
Automotive
Furnishings & Bedding
Packaging
Electronics & Electricals
Consumer Goods
Others
Request for Segment Customization as per your Business Requirement: Segment Customization Request
Regional Coverage:
North America
US
Canada
Mexico
Europe
Eastern Europe
Poland
Romania
Hungary
Turkey
Rest of Eastern Europe
Western Europe
Germany
France
UK
Italy
Spain
Netherlands
Switzerland
Austria
Rest of Western Europe
Asia Pacific
China
India
Japan
South Korea
Vietnam
Singapore
Australia
Rest of Asia Pacific
Middle East & Africa
Middle East
UAE
Egypt
Saudi Arabia
Qatar
Rest of Middle East
Africa
Nigeria
South Africa
Rest of Africa
Latin America
Brazil
Argentina
Colombia
Rest of Latin America
Request for Country Level Research Report: Country Level Customization Request
Available Customization
With the given market data, SNS Insider offers customization as per the company’s specific needs. The following customization options are available for the report:
Detailed Volume Analysis
Criss-Cross segment analysis (e.g. Product X Application)
Competitive Product Benchmarking
Geographic Analysis
Additional countries in any of the regions
Customized Data Representation
Detailed analysis and profiling of additional market players
The Jojoba Oil Market Size was USD 140.87 million in 2023. It is estimated to hit USD 270.08 million by 2032 and grow at a CAGR of 7.50% by 2024-2032.
Rare Earth Metals Market size was valued at USD 7.66 billion in 2023 and is expected to reach USD 16.26 billion by 2032, at a CAGR of 8.75% from 2024-2032.
The Aerospace Materials Market size was valued at USD 46.24 billion in 2023 and is expected to reach USD 96.22 billion by 2032 and grow at a CAGR of 8.49% over the forecast period of 2024-2032.
The Biofuel Enzymes Market Size was valued at USD 655.1 million in 2023, and will reach USD 1,220.2 million by 2032, and grow at a CAGR of 7.2% by 2024-2032.
The Optical Coating Market Size was valued at USD 15.63 Billion in 2023 and is expected to reach USD 26.90 Billion by 2032, growing at a CAGR of 6.22% over the forecast period of 2024-2032.
The Sodium Benzoate Market size was valued at USD 1.3 Billion in 2023. It is expected to grow to USD 2.3 Billion by 2032 and grow at a CAGR of 6.4% over the forecast period of 2024-2032.
Hi! Click one of our member below to chat on Phone