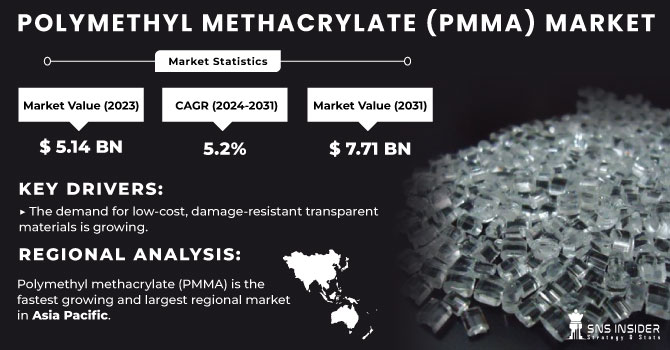
The Polymethyl Methacrylate (PMMA) market size was valued at USD 5.68 billion in 2023 and is expected to reach USD 8.46 billion by 2032 and grow at a CAGR of 4.53% over the forecast period 2024-2032. The Polymethyl Methacrylate (PMMA) Market Report provides in-depth statistical insights and trend analysis, covering global production capacity and utilization by country and type in 2023. It examines feedstock price fluctuations, particularly methyl methacrylate (MMA), and their impact on production costs. The report highlights regulatory and environmental compliance, focusing on sustainability initiatives and emission control measures. Additionally, it explores demand trends across key applications, including automotive, construction, and electronics. Technological advancements and R&D investments in bio-based and high-performance PMMA are analyzed, along with recycling and circular economy initiatives shaping the future of the market.
Get more information on Polymethyl Methacrylate (PMMA) Market - Request Sample Report
Drivers
Rising demand in automotive & transportation drives the market share.
The growth in automotive & transportation has a notable influence on the growth of the polymethyl methacrylate (PMMA) market, where manufacturers started to use PMMA for lightweight and durable vehicle components. Due to its high optical clarity, scratch resistance, and impact strength, PMMA has found its use quite popular in automotive glazing, headlamp covers, interior trims, and lighting systems, including LED. Consequently, the PMMA market has gained traction with a rising global focus on electrical vehicles (EVs) and fuel-efficient automobiles, given that reducing automotive weight directly contributes to energy efficiency and enhances performance. Moreover, PMMA has excellent weather and UV-resistant properties and is, therefore, a material of choice for exterior applications where it can not only improve vehicle appearance but also improve vehicle durability. Automakers are on the lookout for new solutions that would improve sustainability while looking chic and modern, further driving the share of PMMA in the automotive business.
Restraint
High raw material costs may hamper the market growth.
High raw material costs, particularly the price volatility of methyl methacrylate (MMA), a key feedstock for PMMA production, pose a significant restraint on market growth. Fluctuations in crude oil prices, supply chain disruptions, and geopolitical tensions directly impact the cost of MMA, leading to increased production expenses for manufacturers. Additionally, the energy-intensive nature of PMMA production further adds to the overall manufacturing costs. These rising costs are often passed on to end-users, making PMMA less competitive compared to alternative materials like polycarbonate (PC) and glass. As a result, industries such as automotive, construction, and electronics, which rely heavily on PMMA for lightweight and durable applications, may seek cost-effective substitutes, thereby limiting market expansion.
Opportunities
Advancements in 3D Printing & Additive Manufacturing create an opportunity for the market.
The increasing implementation of 3D printing and additive manufacturing is creating pathways for the growth of the Polymethyl Methacrylate (PMMA) market. The impressive optical clarity along with durability and light-weight properties of PMMA, allow quick realisation of prototypes as well as use in a medical implant and customized manufacturing from various industries. Growing penetration of advanced 3D printing technologies is mainly driven by increasing demand for precision components in the automotive, aerospace, and healthcare sectors which in turn escalates utilization of PMMA-based filaments and PMMA-based resins. Further, the manufacturing technology enables the integration of bio-based & recyclable PMMA formulations, which helps to meet sustainability targets and this also boosts the demand for PMMA in additive manufacturing applications.
Challenges
Limited recycling & circular economy initiatives are major challenges for the polymethyl methacrylate (PMMA) market.
The availability of recycling infrastructure and circular economy initiatives presents a major problem for the Polymethyl Methacrylate (PMMA) market. PMMA does not lend itself to recycling because mechanical processing is not practiced on an industrial scale and chemical depolymerization is complex and expensive. The low availability of effective recycling cannot, however, cope with the growing volumes of plastic waste, which poses a threat to the environment and has provided some stimulus for regulation. The adoption of PMMA recycling is compounded by the fact that consumer awareness is low, and collection systems are sparse. Increasing sustainability regulations, coupled with industrywide goals to decarbonize products, are now pushing manufacturers to invest in affordable and scalable recycling technologies.
By Form
The Extruded Sheets accounted for the highest revenue share of around 44% in 2023. This is owing to their low cost, high versatility, and better optical properties. With properties like lightweight, impact-resistant, and weather durable, these sheets have become one of the most widely used materials in various industries including automotive, construction, signage & displays, and electronics. Extruded sheets are preferred for large-scale operations because of their even thickness, reduced Process ability, and lower production costs as compared to cast sheets. This is further driving the increasing use of high-performance transparent materials due to their benefits in architectural glazing, LED lighting, and protective barriers. Furthermore, the development of more UV-resistant and anti-scratch coatings makes extruded PMMA sheets ever more durable and ensures their stronghold on the giant slice of the market.
By Grade
Extruded Sheets held the largest market share around 63% in 2023. It is owing to its versatility, cost-effectiveness, and wide-ranging applications across various industries. High transparency, weather-resistant, easy-to-fabricate grade PMMA ideal for automotive components, signage, lighting fixtures, and consumer goods. Along with all these advantages, the cost can also be a target when compared to high-performance grades. This fact directly contributes to its mass production rather than its low volume. The growing need for aesthetic and durable materials used in construction, retail displays, and medical equipment also helps to bolster the market standing of GP-grade PMMA.
By End-Use Industry
Signs & Displays segment held the largest market share around 32% in 2023. PMMA has been used for many years in advertising boards, retail displays, illuminated signs, and also billboards due to its high light transmission, good strength, and UV resistance making it suitable for indoor and outdoor applications. Particularly due to the growing demand for attention-grabbing, durable, and energy-efficient signage solutions in the retail sector, transportation hubs, and corporate branding, its adoption is additionally stimulated. Moreover, the growth of digital signage, LED displays, and point-of-sale advertising has increased the demand for premium quality PM MA sheets and films making it the most used type available in the market.
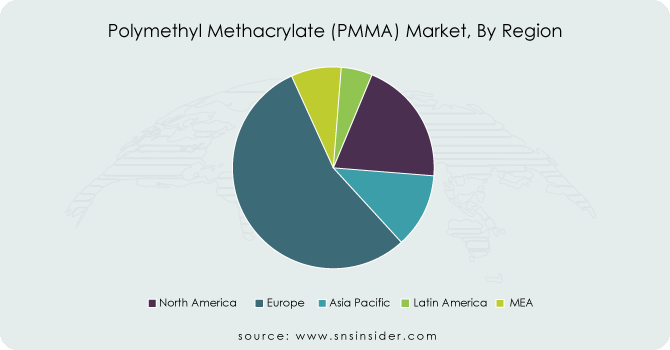
North America led the largest market share around 34% in 2023. PMMA demand has been driven by a well-established manufacturing sector, high adoption of advanced materials, and an increasing number of infrastructure projects in the region. PMMA is majorly used in the automotive industry in U.S. and Canada for weight-effective glazing, interior components, and LED lighting applications due to stringent fuel efficiency regulations. In addition, increased demand for high-quality signage and display solutions from the rapidly growing retail and advertising sector has consolidated the position of North America in the market. Factors such as a high number of global OEMs of PMMA, increasing R&D investments, and a resin-type high focus on sustainable alternatives also led the region to hold its dominant status in the global PMMA market.
Asia Pacific held a significant market share. This is due to the growing demand for lightweight and durable materials in assorted applications including electronics, signage & displays, and healthcare. Additionally, high growth in the adoption of High-Performance Plastics coupled with, a strong manufacturing-based economy and effective production across Eastern Asia have contributed further in promoting the market growth in the region. Moreover, the initiatives taken by the governments to promote the development of infrastructure and the growing consumer electronics industry are further aiding the consumption of PMMA. Surging adoption of energy-efficient LED lighting and premium advertising displays have further enhanced regional demand for PMMA and made Asia Pacific, a significant shareholder of the global PMMA market.
Get Customized Report as per your Business Requirement - Request For Customized Report
Mitsubishi Rayon Co. Ltd. (Acrypet, Shinkolite)
Polycasa N.V. (Polycasa Cast, Polycasa XT)
Gehr Plastics, Inc. (Gehr PMMA, Gehr XT)
Saudi Arabia Basic Industries Corporation (LUCITE, Plexiglas)
CHI MEI Corporation (Acrylic Resin, Wonderlite)
Arkema SA (Altuglas, Oroglas)
Kuraray Group (Acrylite, Parapet)
Evonik Industries AG (Plexiglas, Acrylite)
Sumitomo Chemical Co. Ltd. (Sumipex, Acryl-S)
Asahi Kasei Corporation (Asacryl, Acryrex)
Kolon Industries Inc. (Acrypoly, Kolon PMMA)
The Dow Chemical Company (Plexiglas, Lucite)
LG Chem Ltd. (LG PMMA, LUPOY)
Toray Industries, Inc. (Toraylite, Toray PMMA)
Trinseo S.A. (Plexiglas, Calibre)
Plaskolite LLC (OPTIX, DURAPLEX)
SABIC Innovative Plastics (Lexan, Cycolac)
Röhm GmbH (Plexiglas, DEGLAS)
Unigel Group (Unigel PMMA, Acrylite)
Perspex International Ltd. (Perspex, Spectrum)
In June 2024, Trinseo S.A. opened a depolymerization plant in Italy to enhance PMMA recycling efforts. This initiative supports the circular economy by enabling efficient material recovery and reuse. The project aligns with the company's commitment to sustainable and eco-friendly solutions.
In March 2024, SABIC launched LNP ELCRES SLX1271SR, a scratch-resistant PMMA-based resin tailored for automotive applications. This innovation enhances durability and surface protection, catering to the industry's demand for high-performance materials.
| Report Attributes | Details |
|---|---|
| Market Size in 2023 | US$ 5.68 Billion |
| Market Size by 2032 | US$ 8.46 Billion |
| CAGR | CAGR of 4.53% From 2024 to 2032 |
| Base Year | 2023 |
| Forecast Period | 2024-2032 |
| Historical Data | 2020-2022 |
| Report Scope & Coverage | Market Size, Segments Analysis, Competitive Landscape, Regional Analysis, DROC & SWOT Analysis, Forecast Outlook |
| Key Segments | • By Form (Extruded sheet, Cast acrylic sheet, Pellets, Beads, Others) • By Grade (General purpose grade, Optical grade) • By End-use Industry (Automotive, Building & Construction, Lighting Fixtures, Electrical & Electronics, Marine, Healthcare, Agriculture, Consumer Goods, Others) |
| Regional Analysis/Coverage | North America (US, Canada, Mexico), Europe (Eastern Europe [Poland, Romania, Hungary, Turkey, Rest of Eastern Europe] Western Europe] Germany, France, UK, Italy, Spain, Netherlands, Switzerland, Austria, Rest of Western Europe]), Asia Pacific (China, India, Japan, South Korea, Vietnam, Singapore, Australia, Rest of Asia Pacific), Middle East & Africa (Middle East [UAE, Egypt, Saudi Arabia, Qatar, Rest of Middle East], Africa [Nigeria, South Africa, Rest of Africa], Latin America (Brazil, Argentina, Colombia, Rest of Latin America) |
| Company Profiles | Mitsubishi Rayon Co. Ltd., Polycasa N.V., Gehr Plastics, Inc., Saudi Arabia Basic Industries Corporation, CHI MEI Corporation, Arkema SA, Kuraray Group, Evonik Industries AG, Sumitomo Chemical Co. Ltd., Asahi Kasei Corporation, Kolon Industries Inc., The Dow Chemical Company, LG Chem Ltd., Toray Industries, Inc., Trinseo S.A., Plaskolite LLC, SABIC Innovative Plastics, Röhm GmbH, Unigel Group, Perspex International Ltd. |
Ans: Manufacturers, Consultant, aftermarket players, association, Research institute, private and universities libraries, suppliers and distributors of the product.
Ans: Rising demand in automotive & transportation drives the market share.
Ans: Mitsubishi Rayon Co. Ltd. (Japan), Polycasa N.V. (Belgium), Gehr Plastics, Inc. (U.S.), Saudi Arabia Basic Industries Corporation (Saudi Arabia), CHI MEI Corporation (Taiwan), Arkema SA (France), Kuraray Group (Japan), Evonik Industries AG (Germany), Sumitomo Chemical Co. Ltd. (Japan), Asahi Kasei Corporation (Japan), Kolon Industries, Inc. (South Korea) and The Dow Chemical Company (U.S.)
Ans: Requiring high rigidity, Availability of low-cost substitutes and Raw materials are in short supply are the restraints for Polymethyl Methacrylate (PMMA) Market.
Ans: The Polymethyl Methacrylate (PMMA) market size was valued at USD 5.68 billion in 2023 and is expected to reach USD 8.46 billion by 2032 and grow at a CAGR of 4.53% over the forecast period 2024-2032
Table of Contents
1. Introduction
1.1 Market Definition
1.2 Scope (Inclusion and Exclusions)
1.3 Research Assumptions
2. Executive Summary
2.1 Market Overview
2.2 Regional Synopsis
2.3 Competitive Summary
3. Research Methodology
3.1 Top-Down Approach
3.2 Bottom-up Approach
3.3. Data Validation
3.4 Primary Interviews
4. Market Dynamics Impact Analysis
4.1 Market Driving Factors Analysis
4.1.1 Drivers
4.1.2 Restraints
4.1.3 Opportunities
4.1.4 Challenges
4.2 PESTLE Analysis
4.3 Porter’s Five Forces Model
5. Statistical Insights and Trends Reporting
5.1 By Production Capacity and Utilization, by Country, By Type, 2023
5.2 Feedstock Prices, by Country, By Type, 2023
5.3 Regulatory Impact, by l Country, By Type, 2023.
5.4 Environmental Metrics: Emissions Data, Waste Management Practices, and Sustainability Initiatives, by Region
5.5 Innovation and R&D, Type, 2023
6. Competitive Landscape
6.1 List of Major Companies, By Region
6.2 Market Share Analysis, By Region
6.3 Product Benchmarking
6.3.1 Product specifications and features
6.3.2 Pricing
6.4 Strategic Initiatives
6.4.1 Marketing and promotional activities
6.4.2 Distribution and Supply Chain Strategies
6.4.3 Expansion plans and new Product launches
6.4.4 Strategic partnerships and collaborations
6.5 Technological Advancements
6.6 Market Positioning and Branding
7. Polymethyl Methacrylate (PMMA) Market Segmentation, By Form
7.1 Chapter Overview
7.2 Extruded Sheets
7.2.1 Extruded Sheets Market Trends Analysis (2020-2032)
7.2.2 Extruded Sheets Market Size Estimates and Forecasts to 2032 (USD Billion)
7.3 Beads
7.3.1 Beads Market Trends Analysis (2020-2032)
7.3.2 Beads Market Size Estimates and Forecasts to 2032 (USD Billion)
7.4 Pellets
7.4.1 Pellets Market Trends Analysis (2020-2032)
7.4.2 Pellets Market Size Estimates and Forecasts to 2032 (USD Billion)
7.5 Cast Acrylic Sheets
7.5.1 Cast Acrylic Sheets Market Trends Analysis (2020-2032)
7.5.2 Cast Acrylic Sheets Market Size Estimates and Forecasts to 2032 (USD Billion)
7.6 Others
7.6.1 Others Market Trends Analysis (2020-2032)
7.6.2 Others Market Size Estimates and Forecasts to 2032 (USD Billion)
8. Polymethyl Methacrylate (PMMA) Market Segmentation, By Grade
8.1 Chapter Overview
8.2 General Purpose Grade
8.2.1 General Purpose Grade Market Trends Analysis (2020-2032)
8.2.2 General Purpose Grade Market Size Estimates and Forecasts to 2032 (USD Billion)
8.3 Optical Grade
8.3.1 Optical Grade Market Trends Analysis (2020-2032)
8.3.2 Optical Grade Market Size Estimates and Forecasts to 2032 (USD Billion)
9. Polymethyl Methacrylate (PMMA) Market Segmentation, by End-Use Industry
9.1 Chapter Overview
9.2 Automotive
9.2.1 Automotive Market Trends Analysis (2020-2032)
9.2.2 Automotive Market Size Estimates and Forecasts to 2032 (USD Billion)
9.3 Building & Construction
9.3.1 Building & Construction Market Trends Analysis (2020-2032)
9.3.2 Building & Construction Market Size Estimates and Forecasts to 2032 (USD Billion)
9.4 Lighting Fixtures
9.4.1 Lighting Fixtures Market Trends Analysis (2020-2032)
9.4.2 Lighting Fixtures Market Size Estimates and Forecasts to 2032 (USD Billion)
9.5 Electrical & Electronics
9.5.1 Electrical & Electronics Market Trends Analysis (2020-2032)
9.5.2 Electrical & Electronics Market Size Estimates and Forecasts to 2032 (USD Billion)
9.6 Signs & Displays
9.6.1 Signs & Displays Market Trends Analysis (2020-2032)
9.6.2 Signs & Displays Market Size Estimates and Forecasts to 2032 (USD Billion)
9.7 Healthcare
9.7.1 Healthcare Market Trends Analysis (2020-2032)
9.7.2 Healthcare Market Size Estimates and Forecasts to 2032 (USD Billion)
9.8 Agriculture
9.8.1 Agriculture Market Trends Analysis (2020-2032)
9.8.2 Agriculture Market Size Estimates and Forecasts to 2032 (USD Billion)
9.9 Consumer Goods
9.9.1 Consumer Goods Market Trends Analysis (2020-2032)
9.9.2 Consumer Goods Market Size Estimates and Forecasts to 2032 (USD Billion)
9.10 Others
9.10.1 Others Market Trends Analysis (2020-2032)
9.10.2 Others Market Size Estimates and Forecasts to 2032 (USD Billion)
10. Regional Analysis
10.1 Chapter Overview
10.2 North America
10.2.1 Trends Analysis
10.2.2 North America Polymethyl Methacrylate (PMMA) Market Estimates and Forecasts, by Country (2020-2032) (USD Billion)
10.2.3 North America Polymethyl Methacrylate (PMMA) Market Estimates and Forecasts, By Form (2020-2032) (USD Billion)
10.2.4 North America Polymethyl Methacrylate (PMMA) Market Estimates and Forecasts, By Grade (2020-2032) (USD Billion)
10.2.5 North America Polymethyl Methacrylate (PMMA) Market Estimates and Forecasts, by End-Use Industry (2020-2032) (USD Billion)
10.2.6 USA
10.2.6.1 USA Polymethyl Methacrylate (PMMA) Market Estimates and Forecasts, By Form (2020-2032) (USD Billion)
10.2.6.2 USA Polymethyl Methacrylate (PMMA) Market Estimates and Forecasts, By Grade (2020-2032) (USD Billion)
10.2.6.3 USA Polymethyl Methacrylate (PMMA) Market Estimates and Forecasts, by End-Use Industry (2020-2032) (USD Billion)
10.2.7 Canada
10.2.7.1 Canada Polymethyl Methacrylate (PMMA) Market Estimates and Forecasts, By Form (2020-2032) (USD Billion)
10.2.7.2 Canada Polymethyl Methacrylate (PMMA) Market Estimates and Forecasts, By Grade (2020-2032) (USD Billion)
10.2.7.3 Canada Polymethyl Methacrylate (PMMA) Market Estimates and Forecasts, by End-Use Industry (2020-2032) (USD Billion)
10.2.8 Mexico
10.2.8.1 Mexico Polymethyl Methacrylate (PMMA) Market Estimates and Forecasts, By Form (2020-2032) (USD Billion)
10.2.8.2 Mexico Polymethyl Methacrylate (PMMA) Market Estimates and Forecasts, By Grade (2020-2032) (USD Billion)
10.2.8.3 Mexico Polymethyl Methacrylate (PMMA) Market Estimates and Forecasts, by End-Use Industry (2020-2032) (USD Billion)
10.3 Europe
10.3.1 Eastern Europe
10.3.1.1 Trends Analysis
10.3.1.2 Eastern Europe Polymethyl Methacrylate (PMMA) Market Estimates and Forecasts, by Country (2020-2032) (USD Billion)
10.3.1.3 Eastern Europe Polymethyl Methacrylate (PMMA) Market Estimates and Forecasts, By Form (2020-2032) (USD Billion)
10.3.1.4 Eastern Europe Polymethyl Methacrylate (PMMA) Market Estimates and Forecasts, By Grade (2020-2032) (USD Billion)
10.3.1.5 Eastern Europe Polymethyl Methacrylate (PMMA) Market Estimates and Forecasts, by End-Use Industry (2020-2032) (USD Billion)
10.3.1.6 Poland
10.3.1.6.1 Poland Polymethyl Methacrylate (PMMA) Market Estimates and Forecasts, By Form (2020-2032) (USD Billion)
10.3.1.6.2 Poland Polymethyl Methacrylate (PMMA) Market Estimates and Forecasts, By Grade (2020-2032) (USD Billion)
10.3.1.6.3 Poland Polymethyl Methacrylate (PMMA) Market Estimates and Forecasts, by End-Use Industry (2020-2032) (USD Billion)
10.3.1.7 Romania
10.3.1.7.1 Romania Polymethyl Methacrylate (PMMA) Market Estimates and Forecasts, By Form (2020-2032) (USD Billion)
10.3.1.7.2 Romania Polymethyl Methacrylate (PMMA) Market Estimates and Forecasts, By Grade (2020-2032) (USD Billion)
10.3.1.7.3 Romania Polymethyl Methacrylate (PMMA) Market Estimates and Forecasts, by End-Use Industry (2020-2032) (USD Billion)
10.3.1.8 Hungary
10.3.1.8.1 Hungary Polymethyl Methacrylate (PMMA) Market Estimates and Forecasts, By Form (2020-2032) (USD Billion)
10.3.1.8.2 Hungary Polymethyl Methacrylate (PMMA) Market Estimates and Forecasts, By Grade (2020-2032) (USD Billion)
10.3.1.8.3 Hungary Polymethyl Methacrylate (PMMA) Market Estimates and Forecasts, by End-Use Industry (2020-2032) (USD Billion)
10.3.1.9 Turkey
10.3.1.9.1 Turkey Polymethyl Methacrylate (PMMA) Market Estimates and Forecasts, By Form (2020-2032) (USD Billion)
10.3.1.9.2 Turkey Polymethyl Methacrylate (PMMA) Market Estimates and Forecasts, By Grade (2020-2032) (USD Billion)
10.3.1.9.3 Turkey Polymethyl Methacrylate (PMMA) Market Estimates and Forecasts, by End-Use Industry (2020-2032) (USD Billion)
10.3.1.10 Rest of Eastern Europe
10.3.1.10.1 Rest of Eastern Europe Polymethyl Methacrylate (PMMA) Market Estimates and Forecasts, By Form (2020-2032) (USD Billion)
10.3.1.10.2 Rest of Eastern Europe Polymethyl Methacrylate (PMMA) Market Estimates and Forecasts, By Grade (2020-2032) (USD Billion)
10.3.1.10.3 Rest of Eastern Europe Polymethyl Methacrylate (PMMA) Market Estimates and Forecasts, by End-Use Industry (2020-2032) (USD Billion)
10.3.2 Western Europe
10.3.2.1 Trends Analysis
10.3.2.2 Western Europe Polymethyl Methacrylate (PMMA) Market Estimates and Forecasts, by Country (2020-2032) (USD Billion)
10.3.2.3 Western Europe Polymethyl Methacrylate (PMMA) Market Estimates and Forecasts, By Form (2020-2032) (USD Billion)
10.3.2.4 Western Europe Polymethyl Methacrylate (PMMA) Market Estimates and Forecasts, By Grade (2020-2032) (USD Billion)
10.3.2.5 Western Europe Polymethyl Methacrylate (PMMA) Market Estimates and Forecasts, by End-Use Industry (2020-2032) (USD Billion)
10.3.2.6 Germany
10.3.2.6.1 Germany Polymethyl Methacrylate (PMMA) Market Estimates and Forecasts, By Form (2020-2032) (USD Billion)
10.3.2.6.2 Germany Polymethyl Methacrylate (PMMA) Market Estimates and Forecasts, By Grade (2020-2032) (USD Billion)
10.3.2.6.3 Germany Polymethyl Methacrylate (PMMA) Market Estimates and Forecasts, by End-Use Industry (2020-2032) (USD Billion)
10.3.2.7 France
10.3.2.7.1 France Polymethyl Methacrylate (PMMA) Market Estimates and Forecasts, By Form (2020-2032) (USD Billion)
10.3.2.7.2 France Polymethyl Methacrylate (PMMA) Market Estimates and Forecasts, By Grade (2020-2032) (USD Billion)
10.3.2.7.3 France Polymethyl Methacrylate (PMMA) Market Estimates and Forecasts, by End-Use Industry (2020-2032) (USD Billion)
10.3.2.8 UK
10.3.2.8.1 UK Polymethyl Methacrylate (PMMA) Market Estimates and Forecasts, By Form (2020-2032) (USD Billion)
10.3.2.8.2 UK Polymethyl Methacrylate (PMMA) Market Estimates and Forecasts, By Grade (2020-2032) (USD Billion)
10.3.2.8.3 UK Polymethyl Methacrylate (PMMA) Market Estimates and Forecasts, by End-Use Industry (2020-2032) (USD Billion)
10.3.2.9 Italy
10.3.2.9.1 Italy Polymethyl Methacrylate (PMMA) Market Estimates and Forecasts, By Form (2020-2032) (USD Billion)
10.3.2.9.2 Italy Polymethyl Methacrylate (PMMA) Market Estimates and Forecasts, By Grade (2020-2032) (USD Billion)
10.3.2.9.3 Italy Polymethyl Methacrylate (PMMA) Market Estimates and Forecasts, by End-Use Industry (2020-2032) (USD Billion)
10.3.2.10 Spain
10.3.2.10.1 Spain Polymethyl Methacrylate (PMMA) Market Estimates and Forecasts, By Form (2020-2032) (USD Billion)
10.3.2.10.2 Spain Polymethyl Methacrylate (PMMA) Market Estimates and Forecasts, By Grade (2020-2032) (USD Billion)
10.3.2.10.3 Spain Polymethyl Methacrylate (PMMA) Market Estimates and Forecasts, by End-Use Industry (2020-2032) (USD Billion)
10.3.2.11 Netherlands
10.3.2.11.1 Netherlands Polymethyl Methacrylate (PMMA) Market Estimates and Forecasts, By Form (2020-2032) (USD Billion)
10.3.2.11.2 Netherlands Polymethyl Methacrylate (PMMA) Market Estimates and Forecasts, By Grade (2020-2032) (USD Billion)
10.3.2.11.3 Netherlands Polymethyl Methacrylate (PMMA) Market Estimates and Forecasts, by End-Use Industry (2020-2032) (USD Billion)
10.3.2.12 Switzerland
10.3.2.12.1 Switzerland Polymethyl Methacrylate (PMMA) Market Estimates and Forecasts, By Form (2020-2032) (USD Billion)
10.3.2.12.2 Switzerland Polymethyl Methacrylate (PMMA) Market Estimates and Forecasts, By Grade (2020-2032) (USD Billion)
10.3.2.12.3 Switzerland Polymethyl Methacrylate (PMMA) Market Estimates and Forecasts, by End-Use Industry (2020-2032) (USD Billion)
10.3.2.13 Austria
10.3.2.13.1 Austria Polymethyl Methacrylate (PMMA) Market Estimates and Forecasts, By Form (2020-2032) (USD Billion)
10.3.2.13.2 Austria Polymethyl Methacrylate (PMMA) Market Estimates and Forecasts, By Grade (2020-2032) (USD Billion)
10.3.2.13.3 Austria Polymethyl Methacrylate (PMMA) Market Estimates and Forecasts, by End-Use Industry (2020-2032) (USD Billion)
10.3.2.14 Rest of Western Europe
10.3.2.14.1 Rest of Western Europe Polymethyl Methacrylate (PMMA) Market Estimates and Forecasts, By Form (2020-2032) (USD Billion)
10.3.2.14.2 Rest of Western Europe Polymethyl Methacrylate (PMMA) Market Estimates and Forecasts, By Grade (2020-2032) (USD Billion)
10.3.2.14.3 Rest of Western Europe Polymethyl Methacrylate (PMMA) Market Estimates and Forecasts, by End-Use Industry (2020-2032) (USD Billion)
10.4 Asia Pacific
10.4.1 Trends Analysis
10.4.2 Asia Pacific Polymethyl Methacrylate (PMMA) Market Estimates and Forecasts, by Country (2020-2032) (USD Billion)
10.4.3 Asia Pacific Polymethyl Methacrylate (PMMA) Market Estimates and Forecasts, By Form (2020-2032) (USD Billion)
10.4.4 Asia Pacific Polymethyl Methacrylate (PMMA) Market Estimates and Forecasts, By Grade (2020-2032) (USD Billion)
10.4.5 Asia Pacific Polymethyl Methacrylate (PMMA) Market Estimates and Forecasts, by End-Use Industry (2020-2032) (USD Billion)
10.4.6 China
10.4.6.1 China Polymethyl Methacrylate (PMMA) Market Estimates and Forecasts, By Form (2020-2032) (USD Billion)
10.4.6.2 China Polymethyl Methacrylate (PMMA) Market Estimates and Forecasts, By Grade (2020-2032) (USD Billion)
10.4.6.3 China Polymethyl Methacrylate (PMMA) Market Estimates and Forecasts, by End-Use Industry (2020-2032) (USD Billion)
10.4.7 India
10.4.7.1 India Polymethyl Methacrylate (PMMA) Market Estimates and Forecasts, By Form (2020-2032) (USD Billion)
10.4.7.2 India Polymethyl Methacrylate (PMMA) Market Estimates and Forecasts, By Grade (2020-2032) (USD Billion)
10.4.7.3 India Polymethyl Methacrylate (PMMA) Market Estimates and Forecasts, by End-Use Industry (2020-2032) (USD Billion)
10.4.8 Japan
10.4.8.1 Japan Polymethyl Methacrylate (PMMA) Market Estimates and Forecasts, By Form (2020-2032) (USD Billion)
10.4.8.2 Japan Polymethyl Methacrylate (PMMA) Market Estimates and Forecasts, By Grade (2020-2032) (USD Billion)
10.4.8.3 Japan Polymethyl Methacrylate (PMMA) Market Estimates and Forecasts, by End-Use Industry (2020-2032) (USD Billion)
10.4.9 South Korea
10.4.9.1 South Korea Polymethyl Methacrylate (PMMA) Market Estimates and Forecasts, By Form (2020-2032) (USD Billion)
10.4.9.2 South Korea Polymethyl Methacrylate (PMMA) Market Estimates and Forecasts, By Grade (2020-2032) (USD Billion)
10.4.9.3 South Korea Polymethyl Methacrylate (PMMA) Market Estimates and Forecasts, by End-Use Industry (2020-2032) (USD Billion)
10.4.10 Vietnam
10.4.10.1 Vietnam Polymethyl Methacrylate (PMMA) Market Estimates and Forecasts, By Form (2020-2032) (USD Billion)
10.4.10.2 Vietnam Polymethyl Methacrylate (PMMA) Market Estimates and Forecasts, By Grade (2020-2032) (USD Billion)
10.4.10.3 Vietnam Polymethyl Methacrylate (PMMA) Market Estimates and Forecasts, by End-Use Industry (2020-2032) (USD Billion)
10.4.11 Singapore
10.4.11.1 Singapore Polymethyl Methacrylate (PMMA) Market Estimates and Forecasts, By Form (2020-2032) (USD Billion)
10.4.11.2 Singapore Polymethyl Methacrylate (PMMA) Market Estimates and Forecasts, By Grade (2020-2032) (USD Billion)
10.4.11.3 Singapore Polymethyl Methacrylate (PMMA) Market Estimates and Forecasts, by End-Use Industry (2020-2032) (USD Billion)
10.4.12 Australia
10.4.12.1 Australia Polymethyl Methacrylate (PMMA) Market Estimates and Forecasts, By Form (2020-2032) (USD Billion)
10.4.12.2 Australia Polymethyl Methacrylate (PMMA) Market Estimates and Forecasts, By Grade (2020-2032) (USD Billion)
10.4.12.3 Australia Polymethyl Methacrylate (PMMA) Market Estimates and Forecasts, by End-Use Industry (2020-2032) (USD Billion)
10.4.13 Rest of Asia Pacific
10.4.13.1 Rest of Asia Pacific Polymethyl Methacrylate (PMMA) Market Estimates and Forecasts, By Form (2020-2032) (USD Billion)
10.4.13.2 Rest of Asia Pacific Polymethyl Methacrylate (PMMA) Market Estimates and Forecasts, By Grade (2020-2032) (USD Billion)
10.4.13.3 Rest of Asia Pacific Polymethyl Methacrylate (PMMA) Market Estimates and Forecasts, by End-Use Industry (2020-2032) (USD Billion)
10.5 Middle East and Africa
10.5.1 Middle East
10.5.1.1 Trends Analysis
10.5.1.2 Middle East Polymethyl Methacrylate (PMMA) Market Estimates and Forecasts, by Country (2020-2032) (USD Billion)
10.5.1.3 Middle East Polymethyl Methacrylate (PMMA) Market Estimates and Forecasts, By Form (2020-2032) (USD Billion)
10.5.1.4 Middle East Polymethyl Methacrylate (PMMA) Market Estimates and Forecasts, By Grade (2020-2032) (USD Billion)
10.5.1.5 Middle East Polymethyl Methacrylate (PMMA) Market Estimates and Forecasts, by End-Use Industry (2020-2032) (USD Billion)
10.5.1.6 UAE
10.5.1.6.1 UAE Polymethyl Methacrylate (PMMA) Market Estimates and Forecasts, By Form (2020-2032) (USD Billion)
10.5.1.6.2 UAE Polymethyl Methacrylate (PMMA) Market Estimates and Forecasts, By Grade (2020-2032) (USD Billion)
10.5.1.6.3 UAE Polymethyl Methacrylate (PMMA) Market Estimates and Forecasts, by End-Use Industry (2020-2032) (USD Billion)
10.5.1.7 Egypt
10.5.1.7.1 Egypt Polymethyl Methacrylate (PMMA) Market Estimates and Forecasts, By Form (2020-2032) (USD Billion)
10.5.1.7.2 Egypt Polymethyl Methacrylate (PMMA) Market Estimates and Forecasts, By Grade (2020-2032) (USD Billion)
10.5.1.7.3 Egypt Polymethyl Methacrylate (PMMA) Market Estimates and Forecasts, by End-Use Industry (2020-2032) (USD Billion)
10.5.1.8 Saudi Arabia
10.5.1.8.1 Saudi Arabia Polymethyl Methacrylate (PMMA) Market Estimates and Forecasts, By Form (2020-2032) (USD Billion)
10.5.1.8.2 Saudi Arabia Polymethyl Methacrylate (PMMA) Market Estimates and Forecasts, By Grade (2020-2032) (USD Billion)
10.5.1.8.3 Saudi Arabia Polymethyl Methacrylate (PMMA) Market Estimates and Forecasts, by End-Use Industry (2020-2032) (USD Billion)
10.5.1.9 Qatar
10.5.1.9.1 Qatar Polymethyl Methacrylate (PMMA) Market Estimates and Forecasts, By Form (2020-2032) (USD Billion)
10.5.1.9.2 Qatar Polymethyl Methacrylate (PMMA) Market Estimates and Forecasts, By Grade (2020-2032) (USD Billion)
10.5.1.9.3 Qatar Polymethyl Methacrylate (PMMA) Market Estimates and Forecasts, by End-Use Industry (2020-2032) (USD Billion)
10.5.1.10 Rest of Middle East
10.5.1.10.1 Rest of Middle East Polymethyl Methacrylate (PMMA) Market Estimates and Forecasts, By Form (2020-2032) (USD Billion)
10.5.1.10.2 Rest of Middle East Polymethyl Methacrylate (PMMA) Market Estimates and Forecasts, By Grade (2020-2032) (USD Billion)
10.5.1.10.3 Rest of Middle East Polymethyl Methacrylate (PMMA) Market Estimates and Forecasts, by End-Use Industry (2020-2032) (USD Billion)
10.5.2 Africa
10.5.2.1 Trends Analysis
10.5.2.2 Africa Polymethyl Methacrylate (PMMA) Market Estimates and Forecasts, by Country (2020-2032) (USD Billion)
10.5.2.3 Africa Polymethyl Methacrylate (PMMA) Market Estimates and Forecasts, By Form (2020-2032) (USD Billion)
10.5.2.4 Africa Polymethyl Methacrylate (PMMA) Market Estimates and Forecasts, By Grade (2020-2032) (USD Billion)
10.5.2.5 Africa Polymethyl Methacrylate (PMMA) Market Estimates and Forecasts, by End-Use Industry (2020-2032) (USD Billion)
10.5.2.6 South Africa
10.5.2.6.1 South Africa Polymethyl Methacrylate (PMMA) Market Estimates and Forecasts, By Form (2020-2032) (USD Billion)
10.5.2.6.2 South Africa Polymethyl Methacrylate (PMMA) Market Estimates and Forecasts, By Grade (2020-2032) (USD Billion)
10.5.2.6.3 South Africa Polymethyl Methacrylate (PMMA) Market Estimates and Forecasts, by End-Use Industry (2020-2032) (USD Billion)
10.5.2.7 Nigeria
10.5.2.7.1 Nigeria Polymethyl Methacrylate (PMMA) Market Estimates and Forecasts, By Form (2020-2032) (USD Billion)
10.5.2.7.2 Nigeria Polymethyl Methacrylate (PMMA) Market Estimates and Forecasts, By Grade (2020-2032) (USD Billion)
10.5.2.7.3 Nigeria Polymethyl Methacrylate (PMMA) Market Estimates and Forecasts, by End-Use Industry (2020-2032) (USD Billion)
10.5.2.8 Rest of Africa
10.5.2.8.1 Rest of Africa Polymethyl Methacrylate (PMMA) Market Estimates and Forecasts, By Form (2020-2032) (USD Billion)
10.5.2.8.2 Rest of Africa Polymethyl Methacrylate (PMMA) Market Estimates and Forecasts, By Grade (2020-2032) (USD Billion)
10.5.2.8.3 Rest of Africa Polymethyl Methacrylate (PMMA) Market Estimates and Forecasts, by End-Use Industry (2020-2032) (USD Billion)
10.6 Latin America
10.6.1 Trends Analysis
10.6.2 Latin America Polymethyl Methacrylate (PMMA) Market Estimates and Forecasts, by Country (2020-2032) (USD Billion)
10.6.3 Latin America Polymethyl Methacrylate (PMMA) Market Estimates and Forecasts, By Form (2020-2032) (USD Billion)
10.6.4 Latin America Polymethyl Methacrylate (PMMA) Market Estimates and Forecasts, By Grade (2020-2032) (USD Billion)
10.6.5 Latin America Polymethyl Methacrylate (PMMA) Market Estimates and Forecasts, by End-Use Industry (2020-2032) (USD Billion)
10.6.6 Brazil
10.6.6.1 Brazil Polymethyl Methacrylate (PMMA) Market Estimates and Forecasts, By Form (2020-2032) (USD Billion)
10.6.6.2 Brazil Polymethyl Methacrylate (PMMA) Market Estimates and Forecasts, By Grade (2020-2032) (USD Billion)
10.6.6.3 Brazil Polymethyl Methacrylate (PMMA) Market Estimates and Forecasts, by End-Use Industry (2020-2032) (USD Billion)
10.6.7 Argentina
10.6.7.1 Argentina Polymethyl Methacrylate (PMMA) Market Estimates and Forecasts, By Form (2020-2032) (USD Billion)
10.6.7.2 Argentina Polymethyl Methacrylate (PMMA) Market Estimates and Forecasts, By Grade (2020-2032) (USD Billion)
10.6.7.3 Argentina Polymethyl Methacrylate (PMMA) Market Estimates and Forecasts, by End-Use Industry (2020-2032) (USD Billion)
10.6.8 Colombia
10.6.8.1 Colombia Polymethyl Methacrylate (PMMA) Market Estimates and Forecasts, By Form (2020-2032) (USD Billion)
10.6.8.2 Colombia Polymethyl Methacrylate (PMMA) Market Estimates and Forecasts, By Grade (2020-2032) (USD Billion)
10.6.8.3 Colombia Polymethyl Methacrylate (PMMA) Market Estimates and Forecasts, by End-Use Industry (2020-2032) (USD Billion)
10.6.9 Rest of Latin America
10.6.9.1 Rest of Latin America Polymethyl Methacrylate (PMMA) Market Estimates and Forecasts, By Form (2020-2032) (USD Billion)
10.6.9.2 Rest of Latin America Polymethyl Methacrylate (PMMA) Market Estimates and Forecasts, By Grade (2020-2032) (USD Billion)
10.6.9.3 Rest of Latin America Polymethyl Methacrylate (PMMA) Market Estimates and Forecasts, by End-Use Industry (2020-2032) (USD Billion)
11. Company Profiles
11.1 Mitsubishi Rayon Co. Ltd.
11.1.1 Company Overview
11.1.2 Financial
11.1.3 Product/ Services Offered
11.1.4 SWOT Analysis
11.2 Polycasa N.V.
11.2.1 Company Overview
11.2.2 Financial
11.2.3 Product/ Services Offered
11.2.4 SWOT Analysis
11.3 Gehr Plastics, Inc.
11.3.1 Company Overview
11.3.2 Financial
11.3.3 Product/ Services Offered
11.3.4 SWOT Analysis
11.4 Saudi Arabia Basic Industries Corporation
11.4.1 Company Overview
11.4.2 Financial
11.4.3 Product/ Services Offered
11.4.4 SWOT Analysis
11.5 CHI MEI Corporation
11.5.1 Company Overview
11.5.2 Financial
11.5.3 Product/ Services Offered
11.5.4 SWOT Analysis
11.6 Arkema SA
11.6.1 Company Overview
11.6.2 Financial
11.6.3 Product/ Services Offered
11.6.4 SWOT Analysis
11.7 Kuraray Group
11.7.1 Company Overview
11.7.2 Financial
11.7.3 Product/ Services Offered
11.7.4 SWOT Analysis
11.8 Evonik Industries AG
11.8.1 Company Overview
11.8.2 Financial
11.8.3 Product/ Services Offered
11.8.4 SWOT Analysis
11.9 Sumitomo Chemical Co. Ltd.
11.9.1 Company Overview
11.9.2 Financial
11.9.3 Product/ Services Offered
11.9.4 SWOT Analysis
11.10 Asahi Kasei Corporation
11.10.1 Company Overview
11.10.2 Financial
11.10.3 Product/ Services Offered
11.10.4 SWOT Analysis
12. Use Cases and Best Practices
13. Conclusion
An accurate research report requires proper strategizing as well as implementation. There are multiple factors involved in the completion of good and accurate research report and selecting the best methodology to compete the research is the toughest part. Since the research reports we provide play a crucial role in any company’s decision-making process, therefore we at SNS Insider always believe that we should choose the best method which gives us results closer to reality. This allows us to reach at a stage wherein we can provide our clients best and accurate investment to output ratio.
Each report that we prepare takes a timeframe of 350-400 business hours for production. Starting from the selection of titles through a couple of in-depth brain storming session to the final QC process before uploading our titles on our website we dedicate around 350 working hours. The titles are selected based on their current market cap and the foreseen CAGR and growth.
The 5 steps process:
Step 1: Secondary Research:
Secondary Research or Desk Research is as the name suggests is a research process wherein, we collect data through the readily available information. In this process we use various paid and unpaid databases which our team has access to and gather data through the same. This includes examining of listed companies’ annual reports, Journals, SEC filling etc. Apart from this our team has access to various associations across the globe across different industries. Lastly, we have exchange relationships with various university as well as individual libraries.

Step 2: Primary Research
When we talk about primary research, it is a type of study in which the researchers collect relevant data samples directly, rather than relying on previously collected data. This type of research is focused on gaining content specific facts that can be sued to solve specific problems. Since the collected data is fresh and first hand therefore it makes the study more accurate and genuine.
We at SNS Insider have divided Primary Research into 2 parts.
Part 1 wherein we interview the KOLs of major players as well as the upcoming ones across various geographic regions. This allows us to have their view over the market scenario and acts as an important tool to come closer to the accurate market numbers. As many as 45 paid and unpaid primary interviews are taken from both the demand and supply side of the industry to make sure we land at an accurate judgement and analysis of the market.
This step involves the triangulation of data wherein our team analyses the interview transcripts, online survey responses and observation of on filed participants. The below mentioned chart should give a better understanding of the part 1 of the primary interview.

Part 2: In this part of primary research the data collected via secondary research and the part 1 of the primary research is validated with the interviews from individual consultants and subject matter experts.
Consultants are those set of people who have at least 12 years of experience and expertise within the industry whereas Subject Matter Experts are those with at least 15 years of experience behind their back within the same space. The data with the help of two main processes i.e., FGDs (Focused Group Discussions) and IDs (Individual Discussions). This gives us a 3rd party nonbiased primary view of the market scenario making it a more dependable one while collation of the data pointers.
Step 3: Data Bank Validation
Once all the information is collected via primary and secondary sources, we run that information for data validation. At our intelligence centre our research heads track a lot of information related to the market which includes the quarterly reports, the daily stock prices, and other relevant information. Our data bank server gets updated every fortnight and that is how the information which we collected using our primary and secondary information is revalidated in real time.

Step 4: QA/QC Process
After all the data collection and validation our team does a final level of quality check and quality assurance to get rid of any unwanted or undesired mistakes. This might include but not limited to getting rid of the any typos, duplication of numbers or missing of any important information. The people involved in this process include technical content writers, research heads and graphics people. Once this process is completed the title gets uploader on our platform for our clients to read it.
Step 5: Final QC/QA Process:
This is the last process and comes when the client has ordered the study. In this process a final QA/QC is done before the study is emailed to the client. Since we believe in giving our clients a good experience of our research studies, therefore, to make sure that we do not lack at our end in any way humanly possible we do a final round of quality check and then dispatch the study to the client.
Key Segments:
By Form
Extruded Sheets
Beads
Pellets
Cast Acrylic Sheets
Others
By Grade
General Purpose Grade
Optical Grade
By End-Use Industry
Automotive
Building & Construction
Lighting Fixtures
Electrical & Electronics
Signs & Displays
Healthcare
Agriculture
Consumer Goods
Others
Request for Segment Customization as per your Business Requirement: Segment Customization Request
Regional Coverage:
North America
US
Canada
Mexico
Europe
Eastern Europe
Poland
Romania
Hungary
Turkey
Rest of Eastern Europe
Western Europe
Germany
France
UK
Italy
Spain
Netherlands
Switzerland
Austria
Rest of Western Europe
Asia Pacific
China
India
Japan
South Korea
Vietnam
Singapore
Australia
Rest of Asia Pacific
Middle East & Africa
Middle East
UAE
Egypt
Saudi Arabia
Qatar
Rest of Middle East
Africa
Nigeria
South Africa
Rest of Africa
Latin America
Brazil
Argentina
Colombia
Rest of Latin America
Request for Country Level Research Report: Country Level Customization Request
Available Customization
With the given market data, SNS Insider offers customization as per the company’s specific needs. The following customization options are available for the report:
Detailed Volume Analysis
Criss-Cross segment analysis (e.g. Product X Application)
Competitive Product Benchmarking
Geographic Analysis
Additional countries in any of the regions
Customized Data Representation
Detailed analysis and profiling of additional market players
The Industrial Cleaning Chemical Market Size was valued at USD 42.89 Billion in 2023 and is expected to reach USD 65.37 Billion by 2032, growing at a CAGR of 4.80% over the forecast period of 2024-2032.
Explore the Argan Oil Market, focusing on its use in cosmetics, personal care, and food industries. Learn about key trends, rising demand for natural ingredients, and how argan oil's skin, hair, and health benefits are driving its growth in the global mar
Enzyme Substrates Market Size was valued at USD 14.3 Billion in 2023 and is expected to reach USD 26.1 Billion by 2032 and grow at a CAGR of 6.9% over the forecast period 2024-2032.
The ETFE Market Size was valued at USD 463.22 million in 2023 and is expected to reach USD 862.42 million by 2032 and grow at a CAGR of 7.15% by 2024-2032.
The Bisphenol A Market size was USD 20.69 billion in 2023 and is expected to reach USD 34.47 billion by 2032 and grow at a CAGR of 5.84% over the forecast period of 2024-2032.
Surface Disinfectant Market was valued at USD 5.4 billion in 2023 and is expected to reach USD 10.3 billion by 2032, growing at a CAGR of 7.5% from 2024-2032.

Hi! Click one of our member below to chat on Phone
© 2025 All Rights Reserved by SNS Insider Pvt Ltd


