Get More Information on Point Of Sale Display Market - Request Sample Report
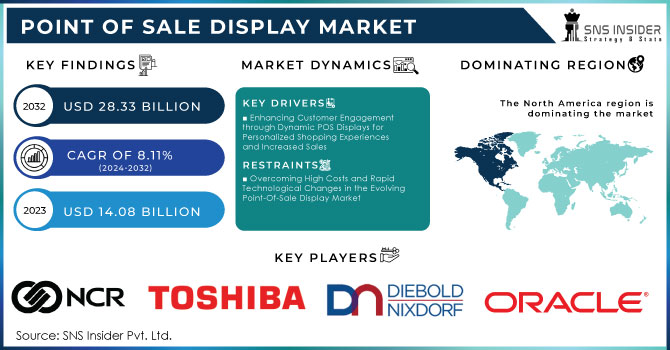
The Point Of Sale Display Market was valued at USD 14.08 Billion in 2023 and is expected to reach USD 28.33 Billion by 2032 and grow at a CAGR of 8.11% over the forecast period 2024-2032.
The point of sale display market is growing due to the increasing adoption of more developed retail technologies, such as in-store digital signage and interactive displays, to engage with customers as well as build improved shopping experiences. Retailers have been investing in novel POS solutions to attract consumers and offer personalized experiences, which will help build sales. Over 70% of purchasing decisions are made in-store at the point of sale, demonstrating how significantly retail displays and visual merchandising impact consumers' buying choices. Additionally, an impressive 76% of shoppers enter a store they haven't visited before just because of its signs, highlighting the essential role that signage plays in drawing in potential customers and increasing foot traffic to retail locations. Online shopping has driven physical stores to increase their competitiveness regarding in-store marketing and, therefore increase the need for POS displays. These will not only be a product display but also messages and offers from the brand to fill the integration gap between online and offline points of sale.
Retailers have been embracing the growing use of mobile displays that are offered on the market because they are flexible and easy to operate, enabling the employees to fully serve every customer in the store. In addition, the shifting consumer preference toward a more engaging and more vibrant experience in shopping leads retailers to invest in advanced POS display technologies. There is an increased use of POS displays in every form of commercial business sector because of the requirement to manage efficient inventories and show products across these businesses.
KEY DRIVERS:
Enhancing Customer Engagement through Dynamic POS Displays for Personalized Shopping Experiences and Increased Sales
Growth in the point-of-sale display Market will be linked to customer interaction and the use of a personalized shopping experience. With the greater familiarity of consumers towards the digital interface, POS displays can be used by retailers to develop an interesting and interactive shopping environment. For example, a clothing retail establishment would create its content with the help of digital signage and display real-time promotional messages showing new arrivals or target-specific discounts according to the shopping history of customers. What they do is draw attention at the point of sale, thus affecting consumer choices and, consequently sales. Combining data analytics with information on the point-of-sale display enables retailers to chart customer preferences and habits, creating targeted marketing efforts that can appeal to every unique shopper. This feature allows companies to shift their strategies very promptly by defining their content by matching prevailing trends or seasonal demand. This, in turn, has led to increased POS displays across industries: Retail and hospitality are prime examples. Restaurants can upload daily specials or customer reviews on POS displays, thus enriching the experience of consumers at the point of consumption. The best part is that it boosts customer engagement and revenue through the on-time relevance of marketing efforts.
Driving Market Growth with Mobile and Contactless Payment Solutions for Enhanced Shopping Experiences and Efficiency
A significant driver of growth in the market is the rising preference for mobile and contactless payment systems. As consumers increasingly favor convenient and fast payment methods, mobile POS displays have gained prominence across various retail outlets. These mobile systems empower sales staff to assist customers directly from the sales floor, effectively reducing wait times at checkout and enhancing overall store efficiency. The growing adoption of mobile payments and smartphone usage has prompted retailers to embrace flexible POS solutions that enhance the shopping experience. Furthermore, the integration of mobile displays with advanced inventory management systems and data analytics has streamlined operations, minimized errors, and enabled personalized customer service. This shift towards mobile and contactless solutions is expected to drive further growth in the POS display market, as businesses adapt to evolving consumer preferences and prioritize efficiency and convenience in their operations.
RESTRAIN:
Overcoming High Costs and Rapid Technological Changes in the Evolving Point-Of-Sale Display Market
The installation of expensive digital displays and high-tech mobile POS systems may be prohibitively costly for small and medium-sized enterprises, and even large ones, thus limiting their adoption of the latest technologies. For example, a small boutique would not bother to install interactive displays or mobile POS systems, as this may cost much, but instead adopt very traditional ones that are also cheaper. A further challenging aspect of the market is that modern technology depreciates so rapidly. From day to day, new technologies just pop into existence, leaving customers with little choice other than to shift to a newer version to keep pace with the rest of the world. For instance, if a retail chain has invested in fixed POS displays, they have then to upgrade to mobile or contactless solutions as the consumers' preferences shift toward convenience and flexibility. Such frequent need for upgrades can easily become cost and disruption-intensive, thus challenging the goals of businesses wanting to maintain a modern POS infrastructure.
BY PRODUCT
Fixed POS Displays had the largest market share at 64.7% in 2023 primarily due to long-standing demand and ease of take-up by various verticals. The system is very efficient and robust in processing large volumes of transactions at big retail stores, supermarkets, and restaurants. Fixed POS displays are recommended since they come with several functionalities, including inventory management, CRM, and advanced analytics. Their strength and supportability for complex systems make them the popular choice for any business looking to achieve stability and comprehensive functionalities.
Mobile POS Displays are projected to be the fastest-growing segment from 2024 to 2032, and this is because of their convenience and flexibility. With consumers currently shifting to seamless shopping experiences with no touch-orientated engagements, businesses embrace mobile POS systems as a method to boost service levels to their customers. The portable solutions enable one to reach customers in every part of the store since one can easily move around hence reducing waiting times, and having the maximum experience in shopping. The fast growth of mobile payments, further propelled by the quickly increasing users of smartphones and digital wallets, gives mobile POS displays additional grounds for becoming a part of the modern retail environment.
BY COMPONENT
In 2023, the hardware segment dominated the market with a 79.5% share, primarily due to its essential role in providing the physical components necessary for any POS system, such as terminals, displays, scanners, and card readers. Businesses in retail and hospitality rely on reliable hardware for efficient transaction processing and operational performance, minimizing customer wait times. Additionally, hardware is crucial for integrating various modules like printers and cash drawers, which further drives its demand. The significant initial investment in high-quality hardware, coupled with regulatory compliance requirements, reinforces its importance in the POS ecosystem, solidifying its market dominance
The software segment is expected to be the fastest-growing area from 2024 to 2032, mainly due to the growing importance of cloud-based solutions and mobile applications, and insights from data. Businesses are increasingly looking for more flexibility and scalability, which is being met using highly advanced POS software, which enables functionalities such as real-time inventory management, customer analytics, and personalized marketing. It has also led to the same enabling users to take advantage of mobile and contactless payments, which enhances the demand for the usual updates and upgrades of software. Digitization and smarter operations are fueling this movement in the POS market leading to the growth of the software segment.
BY APPLICATION
The Retail segment held the largest market share of 61.3% in 2023 because of the immense and diversified need for point-of-sale POS systems. The range of retail businesses, from supermarkets to specialty stores and others, could use POS systems so that high transaction volumes could be managed easily; inventory tracking might be performed; and personalized customer experience offered. Additionally, they use POS displays to effectively promote the products and manage their loyalty programs, thereby enhancing their operational efficiency. Retail is a high-demand market for fixed POS solutions due to their ability to handle complex processes and excellent integration with various store functions, making them the dominant choice in this segment.
The Hospitality segment is projected to experience the fastest growth rate from 2024 to 2032. This is triggered by increased demand for mobile and flexible POS systems that improve customer care in hospitality, particularly in hotels, restaurants, and cafes. Mobile POS solutions speedily generate orders, process real-time payments, and manage tables with an improvement of the guest experience. As the hospitality sector embraces digital transformation, scalable and adaptive POS solutions are needed in the sector, accelerating their rapid adoption.
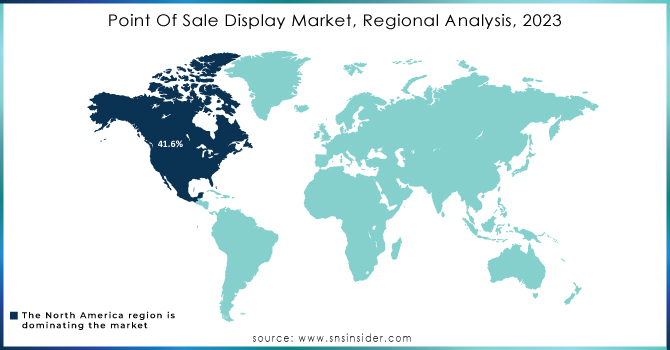
In 2023, North America dominated the total market share of 41.6% because a developed retail infrastructure exists in this region and acceptance towards POS technologies is high. Its large retail chains, supermarkets, and e-commerce giants in the U.S. and Canada spend money heavily on developing POS systems to enhance customer engagement and operational efficiency. For instance, large box stores like Walmart and Amazon have embraced advanced POS displays to manage their stock, process transactions, and for promotional offers. Similarly, the high technology deployment in this region and the innovation drive towards customer experience have been some of the factors why this region is at the top of the market of POS.
The Asia Pacific region is anticipated to achieve a higher CAGR from 2024 to 2032 as it will be witnessing a fast pace of urbanization and also the increasing retail sector in China and India. The growth in the usage of digital payment solutions by small and medium-sized enterprises is a highly increasing factor for mobile and flexible POS systems. For example, the fast rise of online e-commerce portal sites such as Alibaba has accelerated the adaptation of modern POS systems in the region. Also, there is an increase in contactless payment solutions in China that has increased the adaptation of the modern POS system in the region. In countries like India, government initiatives such as promoting digital payments and achieving financial inclusion have accelerated the region's high growth potential.
Need Any Customization Research On Point Of Sale Display Market - Inquiry Now
Some of the major players in the Point Of Sale Display Market are:
NCR Corporation (NCR RealPOS 72XRT, NCR SelfServ 90)
Toshiba Global Commerce Solutions (TCx 800, SurePOS 700)
Diebold Nixdorf (K-One Kiosk, Beetle POS System)
HP Inc. (HP Engage One Pro, HP RP9 Retail System)
Oracle Corporation (Oracle MICROS Workstation 6, MICROS Compact Workstation 310)
Ingenico Group (Lane 5000, Desk/5000)
Elo Touch Solutions (EloPOS Z20, I-Series 2.0 for Windows)
PAX Technology (A920, PAX E-Series E800)
Verifone Systems (Verifone Carbon 10, Verifone M400)
Square, Inc. (Square Stand, Square Register)
Clover Network, Inc. (Clover Flex, Clover Mini)
Samsung Electronics (Samsung Kiosk, Samsung QB55R)
Zebra Technologies (Zebra TC21, DS9300 Series Scanner)
Panasonic Corporation (Panasonic JS-970, Stingray III POS Terminal)
LG Electronics (LG 24CN650N, LG 27TN600V)
Casio Computer Co., Ltd. (Casio QT-6600, Casio SE-S100)
Fujitsu Limited (Fujitsu TP8, TeamPOS 7000)
Posiflex Technology (Posiflex MT-5310A, Posiflex RT-2015)
NEC Corporation (TWINPOS G5200, NEC TWINPOS 7)
SZZT Electronics (SZZT E850, SZZT X990)
3M Company
Corning Incorporated
Samsung SDI
LG Chem
Sumitomo Chemical
DowDuPont
Toray Industries
Saint-Gobain
Nitto Denko Corporation
SABIC
In July 2024, Posiflex Technology Inc. introduced its latest flagship POS terminal series, Mozart BT, designed to enhance operational efficiency and customer engagement in retail and hospitality.
In June 2024, Epson unveiled the OmniLink® TM-H6000VI, the fastest multifunction hybrid POS receipt printer, setting a new standard in POS printing solutions
In February 2024, Rain Technology introduced its Switchable E-Privacy Display Solution, designed to enhance security at point-of-sale (POS) systems by allowing users to toggle between public and private viewing modes. This innovative solution aims to protect sensitive customer information during transactions.
| Report Attributes | Details |
|---|---|
| Market Size in 2023 | USD 14.08 Billion |
| Market Size by 2032 | USD 28.33 Billion |
| CAGR | CAGR of 8.11% From 2024 to 2032 |
| Base Year | 2023 |
| Forecast Period | 2024-2032 |
| Historical Data | 2020-2022 |
| Report Scope & Coverage | Market Size, Segments Analysis, Competitive Landscape, Regional Analysis, DROC & SWOT Analysis, Forecast Outlook |
| Key Segments | • By Product (Fixed POS Displays, Mobile POS Displays) • By Component (Hardware, Software) • By Application (Retail, Hospitality, Healthcare) |
| Regional Analysis/Coverage | North America (US, Canada, Mexico), Europe (Eastern Europe [Poland, Romania, Hungary, Turkey, Rest of Eastern Europe] Western Europe] Germany, France, UK, Italy, Spain, Netherlands, Switzerland, Austria, Rest of Western Europe]), Asia Pacific (China, India, Japan, South Korea, Vietnam, Singapore, Australia, Rest of Asia Pacific), Middle East & Africa (Middle East [UAE, Egypt, Saudi Arabia, Qatar, Rest of Middle East], Africa [Nigeria, South Africa, Rest of Africa], Latin America (Brazil, Argentina, Colombia, Rest of Latin America) |
| Company Profiles | NCR Corporation, Toshiba Global Commerce Solutions, Diebold Nixdorf, HP Inc., Oracle Corporation, Ingenico Group, Elo Touch Solutions, PAX Technology, Verifone Systems, Square, Inc., Clover Network, Inc., Samsung Electronics, Zebra Technologies, Panasonic Corporation, LG Electronics, Casio Computer Co., Ltd., Fujitsu Limited, Posiflex Technology, NEC Corporation, SZZT Electronics |
| Key Drivers | • Enhancing Customer Engagement through Dynamic POS Displays for Personalized Shopping Experiences and Increased Sales • Driving Market Growth with Mobile and Contactless Payment Solutions for Enhanced Shopping Experiences and Efficiency |
| RESTRAINTS | • Overcoming High Costs and Rapid Technological Changes in the Evolving Point-Of-Sale Display Market |
Ans: The Point Of Sale Display Market is expected to grow at a CAGR of 8.11% during 2024-2032.
Ans: Point Of Sale Display Market size was USD 14.08 billion in 2023 and is expected to Reach USD 28.33 billion by 2032.
Ans: The major growth factor of the point-of-sale display Market is the increasing demand for enhanced customer engagement through innovative and interactive display technologies.
Ans: The Retail segment dominated the Point Of Sale Display Market in 2023.
Ans: NORTH AMERICA dominated the Point Of Sale Display Market in 2023.
Table of Content
1. Introduction
1.1 Market Definition
1.2 Scope (Inclusion and Exclusions)
1.3 Research Assumptions
2. Executive Summary
2.1 Market Overview
2.2 Regional Synopsis
2.3 Competitive Summary
3. Research Methodology
3.1 Top-Down Approach
3.2 Bottom-up Approach
3.3. Data Validation
3.4 Primary Interviews
4. Market Dynamics Impact Analysis
4.1 Market Driving Factors Analysis
4.1.1 Drivers
4.1.2 Restraints
4.1.3 Opportunities
4.1.4 Challenges
4.2 PESTLE Analysis
4.3 Porter’s Five Forces Model
5. Statistical Insights and Trends Reporting
5.1 Point Of Sale Display Technology Adoption Rates, by Region, (2020-2023)
5.2 Point Of Sale Display Consumer Engagement Metrics, by Region, (2020-2023)
5.3 Point Of Sale Display Product Features Analysis
5.4 Point Of Sale Display Event Participation Rates
6. Competitive Landscape
6.1 List of Major Companies, By Region
6.2 Market Share Analysis, By Region
6.3 Product Benchmarking
6.3.1 Product specifications and features
6.3.2 Pricing
6.4 Strategic Initiatives
6.4.1 Marketing and promotional activities
6.4.2 Distribution and Supply Chain Strategies
6.4.3 Expansion plans and new product launches
6.4.4 Strategic partnerships and collaborations
6.5 Technological Advancements
6.6 Market Positioning and Branding
7. Point Of Sale Display Market Segmentation, By Product
7.1 Chapter Overview
7.2 Fixed POS Displays
7.2.1 Fixed POS Displays Market Trends Analysis (2020-2032)
7.2.2 Fixed POS Displays Market Size Estimates and Forecasts to 2032 (USD Million)
7.3 Mobile POS Displays
7.3.1 Mobile POS Displays Market Trends Analysis (2020-2032)
7.3.2 Mobile POS Displays Market Size Estimates and Forecasts to 2032 (USD Million)
8. Point Of Sale Display Market Segmentation, By Component
8.1 Chapter Overview
8.2 Hardware
8.2.1 Hardware Market Trends Analysis (2020-2032)
8.2.2 Hardware Market Size Estimates and Forecasts to 2032 (USD Billion)
8.3 Software
8.3.1 Software Market Trends Analysis (2020-2032)
8.3.2 Software Market Size Estimates and Forecasts to 2032 (USD Billion)
9. Point Of Sale Display Market Segmentation, By Application
9.1 Chapter Overview
9.2 Retail
9.2.1 Retail Market Trends Analysis (2020-2032)
9.2.2 Retail Market Size Estimates and Forecasts to 2032 (USD Billion)
9.3 Hospitality
9.3.1 Hospitality Market Trends Analysis (2020-2032)
9.3.2 Hospitality Market Size Estimates and Forecasts to 2032 (USD Billion)
9.4 Healthcare
9.4.1 Healthcare Market Trends Analysis (2020-2032)
9.4.2 Healthcare Market Size Estimates and Forecasts to 2032 (USD Billion)
10. Regional Analysis
10.1 Chapter Overview
10.2 North America
10.2.1 Trends Analysis
10.2.2 North America Point Of Sale Display Market Estimates and Forecasts, by Country (2020-2032) (USD Billion)
10.2.3 North America Point Of Sale Display Market Estimates and Forecasts, By Product (2020-2032) (USD Billion)
10.2.4 North America Point Of Sale Display Market Estimates and Forecasts, By Component (2020-2032) (USD Billion)
10.2.5 North America Point Of Sale Display Market Estimates and Forecasts, By Application (2020-2032) (USD Billion)
10.2.6 USA
10.2.6.1 USA Point Of Sale Display Market Estimates and Forecasts, By Product (2020-2032) (USD Billion)
10.2.6.2 USA Point Of Sale Display Market Estimates and Forecasts, By Component (2020-2032) (USD Billion)
10.2.6.3 USA Point Of Sale Display Market Estimates and Forecasts, By Application (2020-2032) (USD Billion)
10.2.7 Canada
10.2.7.1 Canada Point Of Sale Display Market Estimates and Forecasts, By Product (2020-2032) (USD Billion)
10.2.7.2 Canada Point Of Sale Display Market Estimates and Forecasts, By Component (2020-2032) (USD Billion)
10.2.7.3 Canada Point Of Sale Display Market Estimates and Forecasts, By Application (2020-2032) (USD Billion)
10.2.8 Mexico
10.2.8.1 Mexico Point Of Sale Display Market Estimates and Forecasts, By Product (2020-2032) (USD Billion)
10.2.8.2 Mexico Point Of Sale Display Market Estimates and Forecasts, By Component (2020-2032) (USD Billion)
10.2.8.3 Mexico Point Of Sale Display Market Estimates and Forecasts, By Application (2020-2032) (USD Billion)
10.3 Europe
10.3.1 Eastern Europe
10.3.1.1 Trends Analysis
10.3.1.2 Eastern Europe Point Of Sale Display Market Estimates and Forecasts, by Country (2020-2032) (USD Billion)
10.3.1.3 Eastern Europe Point Of Sale Display Market Estimates and Forecasts, By Product (2020-2032) (USD Billion)
10.3.1.4 Eastern Europe Point Of Sale Display Market Estimates And Forecasts, By Component (2020-2032) (USD Billion)
10.3.1.5 Eastern Europe Point Of Sale Display Market Estimates And Forecasts, By Application (2020-2032) (USD Billion)
10.3.1.6 Poland
10.3.1.6.1 Poland Point Of Sale Display Market Estimates And Forecasts, By Product (2020-2032) (USD Billion)
10.3.1.6.2 Poland Point Of Sale Display Market Estimates And Forecasts, By Component (2020-2032) (USD Billion)
10.3.1.6.3 Poland Point Of Sale Display Market Estimates And Forecasts, By Application (2020-2032) (USD Billion)
10.3.1.7 Romania
10.3.1.7.1 Romania Point Of Sale Display Market Estimates And Forecasts, By Product (2020-2032) (USD Billion)
10.3.1.7.2 Romania Point Of Sale Display Market Estimates And Forecasts, By Component (2020-2032) (USD Billion)
10.3.1.7.3 Romania Point Of Sale Display Market Estimates And Forecasts, By Application (2020-2032) (USD Billion)
10.3.1.8 Hungary
10.3.1.8.1 Hungary Point Of Sale Display Market Estimates And Forecasts, By Product (2020-2032) (USD Billion)
10.3.1.8.2 Hungary Point Of Sale Display Market Estimates And Forecasts, By Component (2020-2032) (USD Billion)
10.3.1.8.3 Hungary Point Of Sale Display Market Estimates And Forecasts, By Application (2020-2032) (USD Billion)
10.3.1.9 Turkey
10.3.1.9.1 Turkey Point Of Sale Display Market Estimates And Forecasts, By Product (2020-2032) (USD Billion)
10.3.1.9.2 Turkey Point Of Sale Display Market Estimates And Forecasts, By Component (2020-2032) (USD Billion)
10.3.1.9.3 Turkey Point Of Sale Display Market Estimates And Forecasts, By Application (2020-2032) (USD Billion)
10.3.1.10 Rest Of Eastern Europe
10.3.1.10.1 Rest Of Eastern Europe Point Of Sale Display Market Estimates And Forecasts, By Product (2020-2032) (USD Billion)
10.3.1.10.2 Rest Of Eastern Europe Point Of Sale Display Market Estimates And Forecasts, By Component (2020-2032) (USD Billion)
10.3.1.10.3 Rest Of Eastern Europe Point Of Sale Display Market Estimates And Forecasts, By Application (2020-2032) (USD Billion)
10.3.2 Western Europe
10.3.2.1 Trends Analysis
10.3.2.2 Western Europe Point Of Sale Display Market Estimates And Forecasts, By Country (2020-2032) (USD Billion)
10.3.2.3 Western Europe Point Of Sale Display Market Estimates And Forecasts, By Product (2020-2032) (USD Billion)
10.3.2.4 Western Europe Point Of Sale Display Market Estimates And Forecasts, By Component (2020-2032) (USD Billion)
10.3.2.5 Western Europe Point Of Sale Display Market Estimates And Forecasts, By Application (2020-2032) (USD Billion)
10.3.2.6 Germany
10.3.2.6.1 Germany Point Of Sale Display Market Estimates And Forecasts, By Product (2020-2032) (USD Billion)
10.3.2.6.2 Germany Point Of Sale Display Market Estimates And Forecasts, By Component (2020-2032) (USD Billion)
10.3.2.6.3 Germany Point Of Sale Display Market Estimates And Forecasts, By Application (2020-2032) (USD Billion)
10.3.2.7 France
10.3.2.7.1 France Point Of Sale Display Market Estimates And Forecasts, By Product (2020-2032) (USD Billion)
10.3.2.7.2 France Point Of Sale Display Market Estimates And Forecasts, By Component (2020-2032) (USD Billion)
10.3.2.7.3 France Point Of Sale Display Market Estimates And Forecasts, By Application (2020-2032) (USD Billion)
10.3.2.8 UK
10.3.2.8.1 UK Point Of Sale Display Market Estimates And Forecasts, By Product (2020-2032) (USD Billion)
10.3.2.8.2 UK Point Of Sale Display Market Estimates And Forecasts, By Component (2020-2032) (USD Billion)
10.3.2.8.3 UK Point Of Sale Display Market Estimates And Forecasts, By Application (2020-2032) (USD Billion)
10.3.2.9 Italy
10.3.2.9.1 Italy Point Of Sale Display Market Estimates And Forecasts, By Product (2020-2032) (USD Billion)
10.3.2.9.2 Italy Point Of Sale Display Market Estimates And Forecasts, By Component (2020-2032) (USD Billion)
10.3.2.9.3 Italy Point Of Sale Display Market Estimates And Forecasts, By Application (2020-2032) (USD Billion)
10.3.2.10 Spain
10.3.2.10.1 Spain Point Of Sale Display Market Estimates And Forecasts, By Product (2020-2032) (USD Billion)
10.3.2.10.2 Spain Point Of Sale Display Market Estimates And Forecasts, By Component (2020-2032) (USD Billion)
10.3.2.10.3 Spain Point Of Sale Display Market Estimates And Forecasts, By Application (2020-2032) (USD Billion)
10.3.2.11 Netherlands
10.3.2.11.1 Netherlands Point Of Sale Display Market Estimates And Forecasts, By Product (2020-2032) (USD Billion)
10.3.2.11.2 Netherlands Point Of Sale Display Market Estimates And Forecasts, By Component (2020-2032) (USD Billion)
10.3.2.11.3 Netherlands Point Of Sale Display Market Estimates And Forecasts, By Application (2020-2032) (USD Billion)
10.3.2.12 Switzerland
10.3.2.12.1 Switzerland Point Of Sale Display Market Estimates And Forecasts, By Product (2020-2032) (USD Billion)
10.3.2.12.2 Switzerland Point Of Sale Display Market Estimates And Forecasts, By Component (2020-2032) (USD Billion)
10.3.2.12.3 Switzerland Point Of Sale Display Market Estimates And Forecasts, By Application (2020-2032) (USD Billion)
10.3.2.13 Austria
10.3.2.13.1 Austria Point Of Sale Display Market Estimates And Forecasts, By Product (2020-2032) (USD Billion)
10.3.2.13.2 Austria Point Of Sale Display Market Estimates And Forecasts, By Component (2020-2032) (USD Billion)
10.3.2.13.3 Austria Point Of Sale Display Market Estimates And Forecasts, By Application (2020-2032) (USD Billion)
10.3.2.14 Rest Of Western Europe
10.3.2.14.1 Rest Of Western Europe Point Of Sale Display Market Estimates And Forecasts, By Product (2020-2032) (USD Billion)
10.3.2.14.2 Rest Of Western Europe Point Of Sale Display Market Estimates And Forecasts, By Component (2020-2032) (USD Billion)
10.3.2.14.3 Rest Of Western Europe Point Of Sale Display Market Estimates And Forecasts, By Application (2020-2032) (USD Billion)
10.4 Asia Pacific
10.4.1 Trends Analysis
10.4.2 Asia Pacific Point Of Sale Display Market Estimates And Forecasts, By Country (2020-2032) (USD Billion)
10.4.3 Asia Pacific Point Of Sale Display Market Estimates And Forecasts, By Product (2020-2032) (USD Billion)
10.4.4 Asia Pacific Point Of Sale Display Market Estimates And Forecasts, By Component (2020-2032) (USD Billion)
10.4.5 Asia Pacific Point Of Sale Display Market Estimates And Forecasts, By Application (2020-2032) (USD Billion)
10.4.6 China
10.4.6.1 China Point Of Sale Display Market Estimates And Forecasts, By Product (2020-2032) (USD Billion)
10.4.6.2 China Point Of Sale Display Market Estimates And Forecasts, By Component (2020-2032) (USD Billion)
10.4.6.3 China Point Of Sale Display Market Estimates And Forecasts, By Application (2020-2032) (USD Billion)
10.4.7 India
10.4.7.1 India Point Of Sale Display Market Estimates And Forecasts, By Product (2020-2032) (USD Billion)
10.4.7.2 India Point Of Sale Display Market Estimates And Forecasts, By Component (2020-2032) (USD Billion)
10.4.7.3 India Point Of Sale Display Market Estimates And Forecasts, By Application (2020-2032) (USD Billion)
10.4.8 Japan
10.4.8.1 Japan Point Of Sale Display Market Estimates And Forecasts, By Product (2020-2032) (USD Billion)
10.4.8.2 Japan Point Of Sale Display Market Estimates And Forecasts, By Component (2020-2032) (USD Billion)
10.4.8.3 Japan Point Of Sale Display Market Estimates And Forecasts, By Application (2020-2032) (USD Billion)
10.4.9 South Korea
10.4.9.1 South Korea Point Of Sale Display Market Estimates And Forecasts, By Product (2020-2032) (USD Billion)
10.4.9.2 South Korea Point Of Sale Display Market Estimates And Forecasts, By Component (2020-2032) (USD Billion)
10.4.9.3 South Korea Point Of Sale Display Market Estimates And Forecasts, By Application (2020-2032) (USD Billion)
10.4.10 Vietnam
10.4.10.1 Vietnam Point Of Sale Display Market Estimates And Forecasts, By Product (2020-2032) (USD Billion)
10.4.10.2 Vietnam Point Of Sale Display Market Estimates And Forecasts, By Component (2020-2032) (USD Billion)
10.4.10.3 Vietnam Point Of Sale Display Market Estimates And Forecasts, By Application (2020-2032) (USD Billion)
10.4.11 Singapore
10.4.11.1 Singapore Point Of Sale Display Market Estimates And Forecasts, By Product (2020-2032) (USD Billion)
10.4.11.2 Singapore Point Of Sale Display Market Estimates And Forecasts, By Component (2020-2032) (USD Billion)
10.4.11.3 Singapore Point Of Sale Display Market Estimates And Forecasts, By Application (2020-2032) (USD Billion)
10.4.12 Australia
10.4.12.1 Australia Point Of Sale Display Market Estimates And Forecasts, By Product (2020-2032) (USD Billion)
10.4.12.2 Australia Point Of Sale Display Market Estimates And Forecasts, By Component (2020-2032) (USD Billion)
10.4.12.3 Australia Point Of Sale Display Market Estimates And Forecasts, By Application (2020-2032) (USD Billion)
10.4.13 Rest Of Asia Pacific
10.4.13.1 Rest Of Asia Pacific Point Of Sale Display Market Estimates And Forecasts, By Product (2020-2032) (USD Billion)
10.4.13.2 Rest Of Asia Pacific Point Of Sale Display Market Estimates And Forecasts, By Component (2020-2032) (USD Billion)
10.4.13.3 Rest Of Asia Pacific Point Of Sale Display Market Estimates And Forecasts, By Application (2020-2032) (USD Billion)
10.5 Middle East And Africa
10.5.1 Middle East
10.5.1.1 Trends Analysis
10.5.1.2 Middle East Point Of Sale Display Market Estimates And Forecasts, By Country (2020-2032) (USD Billion)
10.5.1.3 Middle East Point Of Sale Display Market Estimates And Forecasts, By Product (2020-2032) (USD Billion)
10.5.1.4 Middle East Point Of Sale Display Market Estimates And Forecasts, By Component (2020-2032) (USD Billion)
10.5.1.5 Middle East Point Of Sale Display Market Estimates And Forecasts, By Application (2020-2032) (USD Billion)
10.5.1.6 UAE
10.5.1.6.1 UAE Point Of Sale Display Market Estimates And Forecasts, By Product (2020-2032) (USD Billion)
10.5.1.6.2 UAE Point Of Sale Display Market Estimates And Forecasts, By Component (2020-2032) (USD Billion)
10.5.1.6.3 UAE Point Of Sale Display Market Estimates And Forecasts, By Application (2020-2032) (USD Billion)
10.5.1.7 Egypt
10.5.1.7.1 Egypt Point Of Sale Display Market Estimates And Forecasts, By Product (2020-2032) (USD Billion)
10.5.1.7.2 Egypt Point Of Sale Display Market Estimates And Forecasts, By Component (2020-2032) (USD Billion)
10.5.1.7.3 Egypt Point Of Sale Display Market Estimates And Forecasts, By Application (2020-2032) (USD Billion)
10.5.1.8 Saudi Arabia
10.5.1.8.1 Saudi Arabia Point Of Sale Display Market Estimates And Forecasts, By Product (2020-2032) (USD Billion)
10.5.1.8.2 Saudi Arabia Point Of Sale Display Market Estimates And Forecasts, By Component (2020-2032) (USD Billion)
10.5.1.8.3 Saudi Arabia Point Of Sale Display Market Estimates And Forecasts, By Application (2020-2032) (USD Billion)
10.5.1.9 Qatar
10.5.1.9.1 Qatar Point Of Sale Display Market Estimates And Forecasts, By Product (2020-2032) (USD Billion)
10.5.1.9.2 Qatar Point Of Sale Display Market Estimates And Forecasts, By Component (2020-2032) (USD Billion)
10.5.1.9.3 Qatar Point Of Sale Display Market Estimates And Forecasts, By Application (2020-2032) (USD Billion)
10.5.1.10 Rest Of Middle East
10.5.1.10.1 Rest Of Middle East Point Of Sale Display Market Estimates And Forecasts, By Product (2020-2032) (USD Billion)
10.5.1.10.2 Rest Of Middle East Point Of Sale Display Market Estimates And Forecasts, By Component (2020-2032) (USD Billion)
10.5.1.10.3 Rest Of Middle East Point Of Sale Display Market Estimates And Forecasts, By Application (2020-2032) (USD Billion)
10.5.2 Africa
10.5.2.1 Trends Analysis
10.5.2.2 Africa Point Of Sale Display Market Estimates And Forecasts, By Country (2020-2032) (USD Billion)
10.5.2.3 Africa Point Of Sale Display Market Estimates And Forecasts, By Product (2020-2032) (USD Billion)
10.5.2.4 Africa Point Of Sale Display Market Estimates And Forecasts, By Component (2020-2032) (USD Billion)
10.5.2.5 Africa Point Of Sale Display Market Estimates And Forecasts, By Application (2020-2032) (USD Billion)
10.5.2.6 South Africa
10.5.2.6.1 South Africa Point Of Sale Display Market Estimates And Forecasts, By Product (2020-2032) (USD Billion)
10.5.2.6.2 South Africa Point Of Sale Display Market Estimates And Forecasts, By Component (2020-2032) (USD Billion)
10.5.2.6.3 South Africa Point Of Sale Display Market Estimates And Forecasts, By Application (2020-2032) (USD Billion)
10.5.2.7 Nigeria
10.5.2.7.1 Nigeria Point Of Sale Display Market Estimates And Forecasts, By Product (2020-2032) (USD Billion)
10.5.2.7.2 Nigeria Point Of Sale Display Market Estimates And Forecasts, By Component (2020-2032) (USD Billion)
10.5.2.7.3 Nigeria Point Of Sale Display Market Estimates And Forecasts, By Application (2020-2032) (USD Billion)
10.5.2.8 Rest Of Africa
10.5.2.8.1 Rest Of Africa Point Of Sale Display Market Estimates And Forecasts, By Product (2020-2032) (USD Billion)
10.5.2.8.2 Rest Of Africa Point Of Sale Display Market Estimates And Forecasts, By Component (2020-2032) (USD Billion)
10.5.2.8.3 Rest Of Africa Point Of Sale Display Market Estimates And Forecasts, By Application (2020-2032) (USD Billion)
10.6 Latin America
10.6.1 Trends Analysis
10.6.2 Latin America Point Of Sale Display Market Estimates And Forecasts, By Country (2020-2032) (USD Billion)
10.6.3 Latin America Point Of Sale Display Market Estimates And Forecasts, By Product (2020-2032) (USD Billion)
10.6.4 Latin America Point Of Sale Display Market Estimates And Forecasts, By Component (2020-2032) (USD Billion)
10.6.5 Latin America Point Of Sale Display Market Estimates And Forecasts, By Application (2020-2032) (USD Billion)
10.6.6 Brazil
10.6.6.1 Brazil Point Of Sale Display Market Estimates And Forecasts, By Product (2020-2032) (USD Billion)
10.6.6.2 Brazil Point Of Sale Display Market Estimates And Forecasts, By Component (2020-2032) (USD Billion)
10.6.6.3 Brazil Point Of Sale Display Market Estimates And Forecasts, By Application (2020-2032) (USD Billion)
10.6.7 Argentina
10.6.7.1 Argentina Point Of Sale Display Market Estimates And Forecasts, By Product (2020-2032) (USD Billion)
10.6.7.2 Argentina Point Of Sale Display Market Estimates And Forecasts, By Component (2020-2032) (USD Billion)
10.6.7.3 Argentina Point Of Sale Display Market Estimates And Forecasts, By Application (2020-2032) (USD Billion)
10.6.8 Colombia
10.6.8.1 Colombia Point Of Sale Display Market Estimates And Forecasts, By Product (2020-2032) (USD Billion)
10.6.8.2 Colombia Point Of Sale Display Market Estimates And Forecasts, By Component (2020-2032) (USD Billion)
10.6.8.3 Colombia Point Of Sale Display Market Estimates And Forecasts, By Application (2020-2032) (USD Billion)
10.6.9 Rest Of Latin America
10.6.9.1 Rest Of Latin America Point Of Sale Display Market Estimates And Forecasts, By Product (2020-2032) (USD Billion)
10.6.9.2 Rest Of Latin America Point Of Sale Display Market Estimates And Forecasts, By Component (2020-2032) (USD Billion)
10.6.9.3 Rest Of Latin America Point Of Sale Display Market Estimates And Forecasts, By Application (2020-2032) (USD Billion)
11. Company Profiles
11.1 NCR Corporation
11.1.1 Company Overview
11.1.2 Financial
11.1.3 Products/ Services Offered
11.1.4 SWOT Analysis
11.2 Toshiba Global Commerce Solutions
11.2.1 Company Overview
11.2.2 Financial
11.2.3 Products/ Services Offered
11.2.4 SWOT Analysis
11.3 Diebold Nixdorf
11.3.1 Company Overview
11.3.2 Financial
11.3.3 Products/ Services Offered
11.3.4 SWOT Analysis
11.4 HP Inc
11.4.1 Company Overview
11.4.2 Financial
11.4.3 Products/ Services Offered
11.4.4 SWOT Analysis
11.5 Oracle Corporation
11.5.1 Company Overview
11.5.2 Financial
11.5.3 Products/ Services Offered
11.5.4 SWOT Analysis
11.6 Ingenico Group
11.6.1 Company Overview
11.6.2 Financial
11.6.3 Products/ Services Offered
11.6.4 SWOT Analysis
11.7 Elo Touch Solutions
11.7.1 Company Overview
11.7.2 Financial
11.7.3 Products/ Services Offered
11.7.4 SWOT Analysis
11.8 PAX Technology
11.8.1 Company Overview
11.8.2 Financial
11.8.3 Products/ Services Offered
11.8.4 SWOT Analysis
11.9 Verifone Systems
11.9.1 Company Overview
11.9.2 Financial
11.9.3 Products/ Services Offered
11.9.4 SWOT Analysis
11.10 Square, Inc
11.10.1 Company Overview
11.10.2 Financial
11.10.3 Products/ Services Offered
11.10.4 SWOT Analysis
12. Use Cases and Best Practices
13. Conclusion
An accurate research report requires proper strategizing as well as implementation. There are multiple factors involved in the completion of good and accurate research report and selecting the best methodology to compete the research is the toughest part. Since the research reports we provide play a crucial role in any company’s decision-making process, therefore we at SNS Insider always believe that we should choose the best method which gives us results closer to reality. This allows us to reach at a stage wherein we can provide our clients best and accurate investment to output ratio.
Each report that we prepare takes a timeframe of 350-400 business hours for production. Starting from the selection of titles through a couple of in-depth brain storming session to the final QC process before uploading our titles on our website we dedicate around 350 working hours. The titles are selected based on their current market cap and the foreseen CAGR and growth.
The 5 steps process:
Step 1: Secondary Research:
Secondary Research or Desk Research is as the name suggests is a research process wherein, we collect data through the readily available information. In this process we use various paid and unpaid databases which our team has access to and gather data through the same. This includes examining of listed companies’ annual reports, Journals, SEC filling etc. Apart from this our team has access to various associations across the globe across different industries. Lastly, we have exchange relationships with various university as well as individual libraries.

Step 2: Primary Research
When we talk about primary research, it is a type of study in which the researchers collect relevant data samples directly, rather than relying on previously collected data. This type of research is focused on gaining content specific facts that can be sued to solve specific problems. Since the collected data is fresh and first hand therefore it makes the study more accurate and genuine.
We at SNS Insider have divided Primary Research into 2 parts.
Part 1 wherein we interview the KOLs of major players as well as the upcoming ones across various geographic regions. This allows us to have their view over the market scenario and acts as an important tool to come closer to the accurate market numbers. As many as 45 paid and unpaid primary interviews are taken from both the demand and supply side of the industry to make sure we land at an accurate judgement and analysis of the market.
This step involves the triangulation of data wherein our team analyses the interview transcripts, online survey responses and observation of on filed participants. The below mentioned chart should give a better understanding of the part 1 of the primary interview.

Part 2: In this part of primary research the data collected via secondary research and the part 1 of the primary research is validated with the interviews from individual consultants and subject matter experts.
Consultants are those set of people who have at least 12 years of experience and expertise within the industry whereas Subject Matter Experts are those with at least 15 years of experience behind their back within the same space. The data with the help of two main processes i.e., FGDs (Focused Group Discussions) and IDs (Individual Discussions). This gives us a 3rd party nonbiased primary view of the market scenario making it a more dependable one while collation of the data pointers.
Step 3: Data Bank Validation
Once all the information is collected via primary and secondary sources, we run that information for data validation. At our intelligence centre our research heads track a lot of information related to the market which includes the quarterly reports, the daily stock prices, and other relevant information. Our data bank server gets updated every fortnight and that is how the information which we collected using our primary and secondary information is revalidated in real time.

Step 4: QA/QC Process
After all the data collection and validation our team does a final level of quality check and quality assurance to get rid of any unwanted or undesired mistakes. This might include but not limited to getting rid of the any typos, duplication of numbers or missing of any important information. The people involved in this process include technical content writers, research heads and graphics people. Once this process is completed the title gets uploader on our platform for our clients to read it.
Step 5: Final QC/QA Process:
This is the last process and comes when the client has ordered the study. In this process a final QA/QC is done before the study is emailed to the client. Since we believe in giving our clients a good experience of our research studies, therefore, to make sure that we do not lack at our end in any way humanly possible we do a final round of quality check and then dispatch the study to the client.
By Technology
Fixed POS Displays
Mobile POS Displays
By Component
Hardware
Software
By Application
Retail
Hospitality
Healthcare
Request for Segment Customization as per your Business Requirement: Segment Customization Request
REGIONAL COVERAGE:
North America
US
Canada
Mexico
Europe
Eastern Europe
Poland
Romania
Hungary
Turkey
Rest of Eastern Europe
Western Europe
Germany
France
UK
Italy
Spain
Netherlands
Switzerland
Austria
Rest of Western Europe
Asia Pacific
China
India
Japan
South Korea
Vietnam
Singapore
Australia
Rest of Asia Pacific
Middle East & Africa
Middle East
UAE
Egypt
Saudi Arabia
Qatar
Rest of the Middle East
Africa
Nigeria
South Africa
Rest of Africa
Latin America
Brazil
Argentina
Colombia
Rest of Latin America
Request for Country Level Research Report: Country Level Customization Request
Available Customization
With the given market data, SNS Insider offers customization as per the company’s specific needs. The following customization options are available for the report:
Product Analysis
Criss-Cross segment analysis (e.g. Product X Application)
Product Matrix which gives a detailed comparison of the product portfolio of each company
Geographic Analysis
Additional countries in any of the regions
Company Information
Detailed analysis and profiling of additional market players (Up to five)
The Valve Driver Market was valued at 498.09 Million in 2023 and is projected to reach USD 759.41 Million by 2032, growing at a CAGR of 4.80% from 2024 to 2032.
The Semiconductor Front-End Equipment Market Size was valued at USD 91.45 Billion in 2023 and is expected to reach USD 194.13 Billion by 2032.
The Distributed Temperature Sensing Market Size was valued at USD 758.63 million in 2023 and is expected to grow at a CAGR of 7.04% During 2024-2032.
The Electronic Design Automation (EDA) Market Size was valued at USD 14.66 Billion in 2023 and is expected to grow at a CAGR of 9.35% During 2024-2032.
The Amplifiers Market Size was valued at USD 29.75 billion in 2023 and is expected to grow at a CAGR of 7.2%, reaching USD 55.62 billion by 2032.
The Semi-Insulating Silicon Carbide Wafer Market Size was valued at USD 521.85 million in 2023 and is expected to grow at 20.20% CAGR During 2024-2032.

Hi! Click one of our member below to chat on Phone
© 2025 All Rights Reserved by SNS Insider Pvt Ltd


