Podiatry Chairs Market Report Scope & Overview:
Get more information on Podiatry Chairs Market - Request Free Sample Report
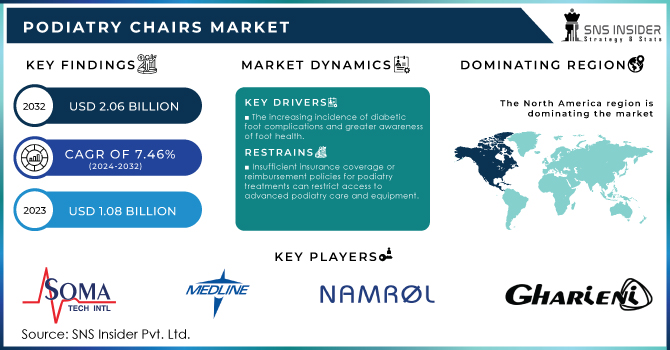
The Podiatry Chairs Market was worth USD 1.08 billion in 2023 and is predicted to be worth USD 2.06 billion by 2032, growing at a CAGR of 7.46 % between 2024 and 2032.
The podiatry chair market is growing due to the rising incidence of foot disorders, technological advancements in healthcare provision, and innovation-driven solutions for diabetic foot care among global consumers demanding the highest quality health products along with high awareness regarding foot hygiene. Foot Pain (AGS Health, 2023) claims up to 87% of people experience foot pain at some point which turns into mobility and can lead to weight gain or heart health problems. An estimated 1 in 3 adults aged over 65 experience foot pain, stiffness, or aching feet. Among this growth, especially pronounced is the demand for diabetic foot care where an estimated 18.6 million people worldwide are suffering from a DFU (diabetic foot ulcers) each year, 1.6M in the US alone, and nearly 50% of these ulcers becoming infected. According to the American Medical Association (2023), around 20% of infected ulcers lead to amputations, escalating the need for specialized care.
Technological improvements are also fuelling the market expansion. According to Medical Device Network in 2024, integrated digital controls and diagnostic tools have been included on approximately 45% of contemporary podiatry chairs. Another 25% of new chair models are made with eco-friendly materials and processes Healthcare Purchasing News,2024. Adherence to recommended foot care practices remains crucial, yet about 44.3% of diabetic individuals fail to follow them, as reported by NCBI (2023). This highlights the necessity of comprehensive foot care delivery. During National Foot Health Awareness Month, the increasing emphasis on foot health has contributed to podiatry chair sales. The ISO Reports, 2023 confirms that more than 70% of recently produced podiatry chairs conform to new edition international safety standards as well Healthcare Innovations, and 40% of them offer customizable features, catering to specific clinical needs.
Drivers
Increasing cases of foot disorders such as diabetic foot ulcers, arthritis, and general foot pain
Innovations in podiatry chair technology, including integrated digital controls and customizable features, enhance patient care
The increasing incidence of diabetic foot complications and greater awareness of foot health
The growing prevalence of foot diseases such as diabetic foot ulcers (DFUs) which are secondary complications of diabetes mellitus have been observed to foster the demand for podiatry chairs. According to the American Diabetes Association in January 2024, out of 144,564 individuals with diabetes who received treatment, 2,252 cases were complicated by infections resulting from DFUs. This high rate of infection highlights the importance of foot care from a podiatrist.
Diabetic foot ulcers can result in serious complications such as amputations. Roughly 18.6 million people suffer from DFUs globally each year, with nearly 1.6 million occurring in the US alone. Findings published in the American Medical Association (2023) also reveal that 20% of those with DFUs have to undergo either full or partial foot amputations the solution pending being that much more immediate. This increased requirement has given rise to the innovation of high-tech podiatry chairs that are specially designed for treating complicated foot issues. They come with technologies that improve the accuracy and comfort of procedures, leading to better clinical outcomes. Among recent innovations are seamless integration with digital controls and personalized faces for patients having a more severe foot need. A larger push to advance foot health management with improved equipment and specialized service is reflected by this trend.
Restraints
The high cost of advanced podiatry chairs and technologies may limit their adoption in smaller clinics and healthcare facilities operating on tight budgets.
Insufficient insurance coverage or reimbursement policies for podiatry treatments can restrict access to advanced podiatry care and equipment.
A shortage of specialized healthcare professionals, such as podiatrists and orthopaedic surgeons, can hinder the effective utilization of advanced podiatry chairs and services.
The high cost of advanced equipment hinders the podiatry chairs market in addition, the cost of podiatry treatment has been a major challenge that remains in isolation and poses several issues with regard to reimbursement due to stringent regulatory scenarios. The cost is directly related to these advances and as podiatry chairs become more advanced technologically, they come at a higher price. For example, a set of top-of-the-line modern electric podiatry chairs with built-in digital controls and additional customer features might run over $10.000 each. This range of cost can limit such a system for small clinics, and hospitals with less budget. Indeed, a study by Healthcare Innovations (2024) found that 30% of buy-in for the superior chairs isn’t possible due to financial reasons. These increased prices of medical chairs inhibit the capacity to access state-of-the-art technologies, which can lower adoption rates for advanced podiatry chairs in these cases. This financial obstacle can then affect the growth of specialized podiatry care in general.
By Product
The electric segment held the largest podiatry chair market share, accounted greater than 59% share in 2023. The dominance has been due to technological strategic moves made by key manufacturing companies and an increase in foot disorders. Functions like easy height adjustment, and backrest/leg lift support can be quickly executed all at the press of a button which is built into these electric chairs. Resulting in improved patient comfort & ergonomics, these features are a favorite among clinics that prioritize ease of use and the overall experience for both practitioners as well as patients. Tronwind, for its part offers motorized multi-function height adjusts and treatment demands are highly versatile electric podiatry chair labelled under TEP04 and presented as a new product in 2021 April which insists on providing the utmost feeling of comfort assisted with its durable upholstery.
The manual segment is expected to witness substantial growth over the forecast period. Small- and medium-sized clinics with relatively little budget will more likely prefer manual podiatry chairs as they are generally cheaper than the electric model. They are trying to find less expensive solutions than routine treatments i.e. toenail trimming and callus removal. Manual chairs offer a more practical choice when electric chairs advanced features are not as crucial and only require basic podiatric services in reverse on reliable equipment. Because of their simplicity and cost reductions, they are better suited to clinics or hospitals that specialize in basic foot care treatments.
By End Use
Hospitals accounted for a substantial share of more than 39%, in the podiatry chair market, and are anticipated to expand at a higher CAGR over the projection period; since many patients prefer hospitals as their primary choice point due to continuous monitoring by medical staff involved in surgeries on hospital premises with patient-friendly equipment requirements like other structural provisions compared to any small specialty centers across a geographic area. Increasing need for podiatry chairs in hospitals because the patient volume as well as case difficulty is on the rise. With orthopedic surgeons in short supply, as well as long waiting lists at the hospital level for surgery both of which figures to get worse in time if unchecked. Accordingly, hospitals are focusing on advanced podiatry chairs to improve the productivity of their surgical services with less time for patient flow and waiting lists.
The development of the clinics segment is expected to increase over 2024-2032. The increase in focus on foot health has resulted in an increased demand for specialized care, a key fact that will drive the market, leading to the availability of private podiatry clinics. NCBI Dec 2023 clinics are increasingly offering non-invasive and preventative foot care services, which are gaining popularity among patients seeking early intervention and routine check-ups. This has created a need for better podiatry chairs in clinics that are functional as well aesthetically so. These modern chairs help provide quality without sacrificing comfort levels which ultimately is when attracting clients.
Regional Analysis
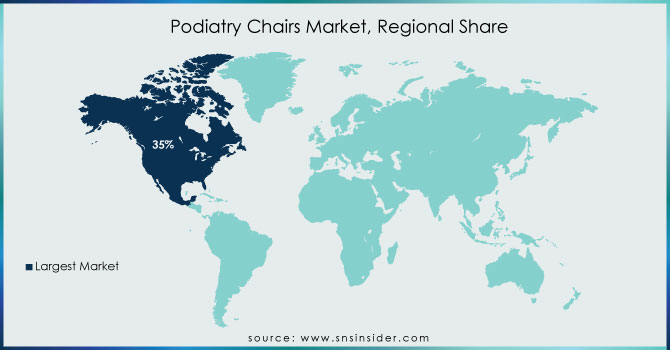
The North America held more than 35% market share in 2023. The prominent share is attributable to a surge in foot disorders, an increase in the prevalence of diabetic foot ulcers, new product launches, a growing number of regulatory approvals, and improved healthcare infrastructure. For example, the American Diabetes Association reported 144,564 patients with diabetes were treated, and 2,252 cases were complicated by infections associated with DFU. The huge number of cases of DFU complicated by infection indicators and the urgent demand for specialized podiatric services, resulted in a rise in the application of advanced podiatry chair technologies in multiple health facilities. The U.S. dominated the North American market in 2023 due to a high prevalence of foot conditions and a high number of sports-related foot injuries. Medscape revealed that 15% of all sports-related injuries occurred in the foot. It is an important indicator that the sports medicine sector requires effective foot care solutions.
Asia Pacific is expected to grow at the highest CAGR over the forecast period likely due to more prevalence of food disorders patients and a rise in R&D expenditure. For example, Singaporean researchers developed the WellFeet mobile application in March 2024 to help people with diabetes understand ulcers and provide expert self-care. The app includes animations for various languages and tools for monitoring medicine administration and physical activities. The application’s deployment has indicated the importance of applying technology to increase foot self-awareness and care in the Asia Pacific region.
Key Players
The Major players in the market are Soma Tech Intl., ARIA Chairs, Medline, Namrol Medical S.L., Hill Laboratories, Angelus Medical and Optical, Lemi MD, Gharieni Group, TitanMed, Midmark Corporation. and others in the final report.
Recent Developments
In January 2024, Atrium Health Wake Forest Baptist opened a new clinic in Kernersville, focusing on orthopaedics, sports medicine, and podiatry. This facility is designed to offer comprehensive care for musculoskeletal and foot health issues, improving access to specialized treatment in the area.
Aria Care Partners, a premier integrator of healthcare services tailored to skilled nursing facilities (SNFs), and PrevMed/Xtend Healthcare Holdings acquired Mission Dental and Perspective Vision Care (PVC) in October 2022. The acquisitions will allow Aria Care Partners to offer dental, audiology, optometry, and podiatry care services that improve residents' well-being in a broader range of facilities.
| Report Attributes | Details |
|---|---|
| Market Size in 2023 | USD 1.08 Billion |
| Market Size by 2032 | USD 2.06 Billion |
| CAGR | CAGR of 7.46% From 2024 to 2032 |
| Base Year | 2023 |
| Forecast Period | 2024-2032 |
| Historical Data | 2020-2022 |
| Report Scope & Coverage | Market Size, Segments Analysis, Competitive Landscape, Regional Analysis, DROC & SWOT Analysis, Forecast Outlook |
| Key Segments | • By Product (Electric, Manual) • By End Use (Hospitals, Clinics, Others) |
| Regional Analysis/Coverage | North America (US, Canada, Mexico), Europe (Eastern Europe [Poland, Romania, Hungary, Turkey, Rest of Eastern Europe] Western Europe] Germany, France, UK, Italy, Spain, Netherlands, Switzerland, Austria, Rest of Western Europe]), Asia Pacific (China, India, Japan, South Korea, Vietnam, Singapore, Australia, Rest of Asia Pacific), Middle East & Africa (Middle East [UAE, Egypt, Saudi Arabia, Qatar, Rest of Middle East], Africa [Nigeria, South Africa, Rest of Africa], Latin America (Brazil, Argentina, Colombia, Rest of Latin America) |
| Company Profiles | Soma Tech Intl., ARIA Chairs, Medline, Namrol Medical S.L., Hill Laboratories, Angelus Medical and Optical, Lemi MD, Gharieni Group, TitanMed, Midmark Corporation |
| Key Drivers | • Increasing cases of foot disorders such as diabetic foot ulcers, arthritis, and general foot pain • Innovations in podiatry chair technology, including integrated digital controls and customizable features, enhance patient care |
| RESTRAINTS | • The high cost of advanced podiatry chairs and technologies may limit their adoption in smaller clinics and healthcare facilities operating on tight budgets. |
Ans. The projected market size for the Podiatry chairs Market is USD 2.06 billion by 2032.
Ans: The electric product segment dominated the Podiatry chairs Market.
Ans: The North American region dominated the market in 2023, with a 35% share.
Ans. The CAGR of the Podiatry chairs Market is 7.6% During the forecast period of 2024-2032.
Ans: Yes, you can customize the report as per your requirements.
Table of Contents
1. Introduction
1.1 Market Definition
1.2 Scope (Inclusion and Exclusions)
1.3 Research Assumptions
2. Executive Summary
2.1 Market Overview
2.2 Regional Synopsis
2.3 Competitive Summary
3. Research Methodology
3.1 Top-Down Approach
3.2 Bottom-up Approach
3.3. Data Validation
3.4 Primary Interviews
4. Market Dynamics Impact Analysis
4.1 Market Driving Factors Analysis
4.1.2 Drivers
4.1.2 Restraints
4.1.3 Opportunities
4.1.4 Challenges
4.2 PESTLE Analysis
4.3 Porter’s Five Forces Model
5. Statistical Insights and Trends Reporting
5.1 Incidence and Prevalence (2023)
5.2 Prescription Trends, (2023), by Region
5.3 Device Volume, by Region (2020-2032)
5.4 Healthcare Spending, by Region, (Government, Commercial, Private, Out-of-Pocket), 2023
6. Competitive Landscape
6.1 List of Major Companies, By Region
6.2 Market Share Analysis, By Region
6.3 Product Benchmarking
6.3.1 Product specifications and features
6.3.2 Pricing
6.4 Strategic Initiatives
6.4.1 Marketing and promotional activities
6.4.2 Distribution and supply chain strategies
6.4.3 Expansion plans and new product launches
6.4.4 Strategic partnerships and collaborations
6.5 Technological Advancements
6.6 Market Positioning and Branding
7. Podiatry chairs Market Segmentation, by Product
7.1 Chapter Overview
7.2 Electric
7.2.1 Electric Market Trends Analysis (2020-2032)
7.2.2 Electric Market Size Estimates and Forecasts to 2032 (USD Billion)
7.3 Manual
7.3.1 Manual Market Trends Analysis (2020-2032)
7.3.2 Manual Market Size Estimates and Forecasts to 2032 (USD Billion)
8. Podiatry chairs Market Segmentation, by End Use
8.1 Chapter Overview
8.2 Hospitals
8.2.1 Hospitals Market Trends Analysis (2020-2032)
8.2.2 Hospitals Market Size Estimates and Forecasts to 2032 (USD Billion)
8.3 Clinics
8.3.1 Clinics Market Trends Analysis (2020-2032)
8.3.2 Clinics Market Size Estimates and Forecasts to 2032 (USD Billion)
8.4 Others
8.4.1 Others Market Trends Analysis (2020-2032)
8.4.2 Others Market Size Estimates and Forecasts to 2032 (USD Billion)
9. Regional Analysis
9.1 Chapter Overview
9.2 North America
9.2.1 Trends Analysis
9.2.2 North America Podiatry chairs Market Estimates and Forecasts, by Country (2020-2032) (USD Billion)
9.2.3 North America Podiatry chairs Market Estimates and Forecasts, by Product (2020-2032) (USD Billion)
9.2.4 North America Podiatry chairs Market Estimates and Forecasts, by End Use (2020-2032) (USD Billion)
9.2.5 USA
9.2.5.1 USA Podiatry chairs Market Estimates and Forecasts, by Product (2020-2032) (USD Billion)
9.2.5.2 USA Podiatry chairs Market Estimates and Forecasts, by End Use (2020-2032) (USD Billion)
9.2.6 Canada
9.2.6.1 Canada Podiatry chairs Market Estimates and Forecasts, by Product (2020-2032) (USD Billion)
9.2.6.2 Canada Podiatry chairs Market Estimates and Forecasts, by End Use (2020-2032) (USD Billion)
9.2.7 Mexico
9.2.7.1 Mexico Podiatry chairs Market Estimates and Forecasts, by Product (2020-2032) (USD Billion)
9.2.7.2 Mexico Podiatry chairs Market Estimates and Forecasts, by End Use (2020-2032) (USD Billion)
9.3 Europe
9.3.1 Eastern Europe
9.3.1.1 Trends Analysis
9.3.1.2 Eastern Europe Podiatry chairs Market Estimates and Forecasts, by Country (2020-2032) (USD Billion)
9.3.1.3 Eastern Europe Podiatry chairs Market Estimates and Forecasts, by Product (2020-2032) (USD Billion)
9.3.1.4 Eastern Europe Podiatry chairs Market Estimates and Forecasts, by End Use (2020-2032) (USD Billion)
9.3.1.5 Poland
9.3.1.5.1 Poland Podiatry chairs Market Estimates and Forecasts, by Product (2020-2032) (USD Billion)
9.3.1.5.2 Poland Podiatry chairs Market Estimates and Forecasts, by End Use (2020-2032) (USD Billion)
9.3.1.6 Romania
9.3.1.6.1 Romania Podiatry chairs Market Estimates and Forecasts, by Product (2020-2032) (USD Billion)
9.3.1.6.2 Romania Podiatry chairs Market Estimates and Forecasts, by End Use (2020-2032) (USD Billion)
9.3.1.7 Hungary
9.3.1.7.1 Hungary Podiatry chairs Market Estimates and Forecasts, by Product (2020-2032) (USD Billion)
9.3.1.7.2 Hungary Podiatry chairs Market Estimates and Forecasts, by End Use (2020-2032) (USD Billion)
9.3.1.8 Turkey
9.3.1.8.1 Turkey Podiatry chairs Market Estimates and Forecasts, by Product (2020-2032) (USD Billion)
9.3.1.8.2 Turkey Podiatry chairs Market Estimates and Forecasts, by End Use (2020-2032) (USD Billion)
9.3.1.9 Rest of Eastern Europe
9.3.1.9.1 Rest of Eastern Europe Podiatry chairs Market Estimates and Forecasts, by Product (2020-2032) (USD Billion)
9.3.1.9.2 Rest of Eastern Europe Podiatry chairs Market Estimates and Forecasts, by End Use (2020-2032) (USD Billion)
9.3.2 Western Europe
9.3.2.1 Trends Analysis
9.3.2.2 Western Europe Podiatry chairs Market Estimates and Forecasts, by Country (2020-2032) (USD Billion)
9.3.2.3 Western Europe Podiatry chairs Market Estimates and Forecasts, by Product (2020-2032) (USD Billion)
9.3.2.4 Western Europe Podiatry chairs Market Estimates and Forecasts, by End Use (2020-2032) (USD Billion)
9.3.2.5 Germany
9.3.2.5.1 Germany Podiatry chairs Market Estimates and Forecasts, by Product (2020-2032) (USD Billion)
9.3.2.5.2 Germany Podiatry chairs Market Estimates and Forecasts, by End Use (2020-2032) (USD Billion)
9.3.2.6 France
9.3.2.6.1 France Podiatry chairs Market Estimates and Forecasts, by Product (2020-2032) (USD Billion)
9.3.2.6.2 France Podiatry chairs Market Estimates and Forecasts, by End Use (2020-2032) (USD Billion)
9.3.2.7 UK
9.3.2.7.1 UK Podiatry chairs Market Estimates and Forecasts, by Product (2020-2032) (USD Billion)
9.3.2.7.2 UK Podiatry chairs Market Estimates and Forecasts, by End Use (2020-2032) (USD Billion)
9.3.2.8 Italy
9.3.2.8.1 Italy Podiatry chairs Market Estimates and Forecasts, by Product (2020-2032) (USD Billion)
9.3.2.8.2 Italy Podiatry chairs Market Estimates and Forecasts, by End Use (2020-2032) (USD Billion)
9.3.2.9 Spain
9.3.2.9.1 Spain Podiatry chairs Market Estimates and Forecasts, by Product (2020-2032) (USD Billion)
9.3.2.9.2 Spain Podiatry chairs Market Estimates and Forecasts, by End Use (2020-2032) (USD Billion)
9.3.2.10 Netherlands
9.3.2.10.1 Netherlands Podiatry chairs Market Estimates and Forecasts, by Product (2020-2032) (USD Billion)
9.3.2.10.2 Netherlands Podiatry chairs Market Estimates and Forecasts, by End Use (2020-2032) (USD Billion)
9.3.2.11 Switzerland
9.3.2.11.1 Switzerland Podiatry chairs Market Estimates and Forecasts, by Product (2020-2032) (USD Billion)
9.3.2.11.2 Switzerland Podiatry chairs Market Estimates and Forecasts, by End Use (2020-2032) (USD Billion)
9.3.2.12 Austria
9.3.2.12.1 Austria Podiatry chairs Market Estimates and Forecasts, by Product (2020-2032) (USD Billion)
9.3.2.12.2 Austria Podiatry chairs Market Estimates and Forecasts, by End Use (2020-2032) (USD Billion)
9.3.2.13 Rest of Western Europe
9.3.2.13.1 Rest of Western Europe Podiatry chairs Market Estimates and Forecasts, by Product (2020-2032) (USD Billion)
9.3.2.13.2 Rest of Western Europe Podiatry chairs Market Estimates and Forecasts, by End Use (2020-2032) (USD Billion)
9.4 Asia Pacific
9.4.1 Trends Analysis
9.4.2 Asia Pacific Podiatry chairs Market Estimates and Forecasts, by Country (2020-2032) (USD Billion)
9.4.3 Asia Pacific Podiatry chairs Market Estimates and Forecasts, by Product (2020-2032) (USD Billion)
9.4.4 Asia Pacific Podiatry chairs Market Estimates and Forecasts, by End Use (2020-2032) (USD Billion)
9.4.5 China
9.4.5.1 China Podiatry chairs Market Estimates and Forecasts, by Product (2020-2032) (USD Billion)
9.4.5.2 China Podiatry chairs Market Estimates and Forecasts, by End Use (2020-2032) (USD Billion)
9.4.6 India
9.4.5.1 India Podiatry chairs Market Estimates and Forecasts, by Product (2020-2032) (USD Billion)
9.4.5.2 India Podiatry chairs Market Estimates and Forecasts, by End Use (2020-2032) (USD Billion)
9.4.5 Japan
9.4.5.1 Japan Podiatry chairs Market Estimates and Forecasts, by Product (2020-2032) (USD Billion)
9.4.5.2 Japan Podiatry chairs Market Estimates and Forecasts, by End Use (2020-2032) (USD Billion)
9.4.6 South Korea
9.4.6.1 South Korea Podiatry chairs Market Estimates and Forecasts, by Product (2020-2032) (USD Billion)
9.4.6.2 South Korea Podiatry chairs Market Estimates and Forecasts, by End Use (2020-2032) (USD Billion)
9.4.7 Vietnam
9.4.7.1 Vietnam Podiatry chairs Market Estimates and Forecasts, by Product (2020-2032) (USD Billion)
9.2.7.2 Vietnam Podiatry chairs Market Estimates and Forecasts, by End Use (2020-2032) (USD Billion)
9.4.8 Singapore
9.4.8.1 Singapore Podiatry chairs Market Estimates and Forecasts, by Product (2020-2032) (USD Billion)
9.4.8.2 Singapore Podiatry chairs Market Estimates and Forecasts, by End Use (2020-2032) (USD Billion)
9.4.9 Australia
9.4.9.1 Australia Podiatry chairs Market Estimates and Forecasts, by Product (2020-2032) (USD Billion)
9.4.9.2 Australia Podiatry chairs Market Estimates and Forecasts, by End Use (2020-2032) (USD Billion)
9.4.10 Rest of Asia Pacific
9.4.10.1 Rest of Asia Pacific Podiatry chairs Market Estimates and Forecasts, by Product (2020-2032) (USD Billion)
9.4.10.2 Rest of Asia Pacific Podiatry chairs Market Estimates and Forecasts, by End Use (2020-2032) (USD Billion)
9.5 Middle East and Africa
9.5.1 Middle East
9.5.1.1 Trends Analysis
9.5.1.2 Middle East Podiatry chairs Market Estimates and Forecasts, by Country (2020-2032) (USD Billion)
9.5.1.3 Middle East Podiatry chairs Market Estimates and Forecasts, by Product (2020-2032) (USD Billion)
9.5.1.4 Middle East Podiatry chairs Market Estimates and Forecasts, by End Use (2020-2032) (USD Billion)
9.5.1.5 UAE
9.5.1.5.1 UAE Podiatry chairs Market Estimates and Forecasts, by Product (2020-2032) (USD Billion)
9.5.1.5.2 UAE Podiatry chairs Market Estimates and Forecasts, by End Use (2020-2032) (USD Billion)
9.5.1.6 Egypt
9.5.1.6.1 Egypt Podiatry chairs Market Estimates and Forecasts, by Product (2020-2032) (USD Billion)
9.5.1.6.2 Egypt Podiatry chairs Market Estimates and Forecasts, by End Use (2020-2032) (USD Billion)
9.5.1.7 Saudi Arabia
9.5.1.7.1 Saudi Arabia Podiatry chairs Market Estimates and Forecasts, by Product (2020-2032) (USD Billion)
9.5.1.7.2 Saudi Arabia Podiatry chairs Market Estimates and Forecasts, by End Use (2020-2032) (USD Billion)
9.5.1.8 Qatar
9.5.1.8.1 Qatar Podiatry chairs Market Estimates and Forecasts, by Product (2020-2032) (USD Billion)
9.5.1.8.2 Qatar Podiatry chairs Market Estimates and Forecasts, by End Use (2020-2032) (USD Billion)
9.5.1.9 Rest of Middle East
9.5.1.9.1 Rest of Middle East Podiatry chairs Market Estimates and Forecasts, by Product (2020-2032) (USD Billion)
9.5.1.9.2 Rest of Middle East Podiatry chairs Market Estimates and Forecasts, by End Use (2020-2032) (USD Billion)
9.5.2 Africa
9.5.2.1 Trends Analysis
9.5.2.2 Africa Podiatry chairs Market Estimates and Forecasts, by Country (2020-2032) (USD Billion)
9.5.2.3 Africa Podiatry chairs Market Estimates and Forecasts, by Product (2020-2032) (USD Billion)
9.5.2.4 Africa Podiatry chairs Market Estimates and Forecasts, by End Use (2020-2032) (USD Billion)
9.5.2.5 South Africa
9.5.2.5.1 South Africa Podiatry chairs Market Estimates and Forecasts, by Product (2020-2032) (USD Billion)
9.5.2.5.2 South Africa Podiatry chairs Market Estimates and Forecasts, by End Use (2020-2032) (USD Billion)
9.5.2.6 Nigeria
9.5.2.6.1 Nigeria Podiatry chairs Market Estimates and Forecasts, by Product (2020-2032) (USD Billion)
9.5.2.6.2 Nigeria Podiatry chairs Market Estimates and Forecasts, by End Use (2020-2032) (USD Billion)
9.5.2.7 Rest of Africa
9.5.2.7.1 Rest of Africa Podiatry chairs Market Estimates and Forecasts, by Component (2020-2032) (USD Billion)
9.5.2.7.2 Rest of Africa Podiatry chairs Market Estimates and Forecasts, by End Use (2020-2032) (USD Billion)
9.6 Latin America
9.6.1 Trends Analysis
9.6.2 Latin America Podiatry chairs Market Estimates and Forecasts, by Country (2020-2032) (USD Billion)
9.6.3 Latin America Podiatry chairs Market Estimates and Forecasts, by Product (2020-2032) (USD Billion)
9.6.4 Latin America Podiatry chairs Market Estimates and Forecasts, by End Use (2020-2032) (USD Billion)
9.6.5 Brazil
9.6.5.1 Brazil Podiatry chairs Market Estimates and Forecasts, by Product (2020-2032) (USD Billion)
9.6.5.2 Brazil Podiatry chairs Market Estimates and Forecasts, by End Use (2020-2032) (USD Billion)
9.6.6 Argentina
9.6.6.1 Argentina Podiatry chairs Market Estimates and Forecasts, by Product (2020-2032) (USD Billion)
9.6.6.2 Argentina Podiatry chairs Market Estimates and Forecasts, by End Use (2020-2032) (USD Billion)
9.6.7 Colombia
9.6.7.1 Colombia Podiatry chairs Market Estimates and Forecasts, by Product (2020-2032) (USD Billion)
9.6.7.2 Colombia Podiatry chairs Market Estimates and Forecasts, by End Use (2020-2032) (USD Billion)
9.6.8 Rest of Latin America
9.6.8.1 Rest of Latin America Podiatry chairs Market Estimates and Forecasts, by Product (2020-2032) (USD Billion)
9.6.8.2 Rest of Latin America Podiatry chairs Market Estimates and Forecasts, by End Use (2020-2032) (USD Billion)
10. Company Profiles
10.1 Soma Tech Intl.
10.1.1 Company Overview
10.1.2 Financial
10.1.3 Products/ Services Offered
110.1.4 SWOT Analysis
10.2 ARIA Chairs
10.2.1 Company Overview
10.2.2 Financial
10.2.3 Products/ Services Offered
10.2.4 SWOT Analysis
10.3 Medline
10.3.1 Company Overview
10.3.2 Financial
10.3.3 Products/ Services Offered
10.3.4 SWOT Analysis
10.4 Namrol Medical S.L.
10.4.1 Company Overview
10.4.2 Financial
10.4.3 Products/ Services Offered
10.4.4 SWOT Analysis
10.5 Hill Laboratories
10.5.1 Company Overview
10.5.2 Financial
10.5.3 Products/ Services Offered
10.5.4 SWOT Analysis
10.6 Angelus Medical and Optical
10.6.1 Company Overview
10.6.2 Financial
10.6.3 Products/ Services Offered
10.6.4 SWOT Analysis
10.7 Lemi MD
10.7.1 Company Overview
10.7.2 Financial
10.7.3 Products/ Services Offered
10.7.4 SWOT Analysis
10.8 Gharieni Group
10.8.1 Company Overview
10.8.2 Financial
10.8.3 Products/ Services Offered
10.8.4 SWOT Analysis
10.9 TitanMed
10.9.1 Company Overview
10.9.2 Financial
10.9.3 Products/ Services Offered
10.9.4 SWOT Analysis
10.10 Midmark Corporation.
10.9.1 Company Overview
10.9.2 Financial
10.9.3 Products/ Services Offered
10.9.4 SWOT Analysis
11. Use Cases and Best Practices
12. Conclusion
An accurate research report requires proper strategizing as well as implementation. There are multiple factors involved in the completion of good and accurate research report and selecting the best methodology to compete the research is the toughest part. Since the research reports we provide play a crucial role in any company’s decision-making process, therefore we at SNS Insider always believe that we should choose the best method which gives us results closer to reality. This allows us to reach at a stage wherein we can provide our clients best and accurate investment to output ratio.
Each report that we prepare takes a timeframe of 350-400 business hours for production. Starting from the selection of titles through a couple of in-depth brain storming session to the final QC process before uploading our titles on our website we dedicate around 350 working hours. The titles are selected based on their current market cap and the foreseen CAGR and growth.
The 5 steps process:
Step 1: Secondary Research:
Secondary Research or Desk Research is as the name suggests is a research process wherein, we collect data through the readily available information. In this process we use various paid and unpaid databases which our team has access to and gather data through the same. This includes examining of listed companies’ annual reports, Journals, SEC filling etc. Apart from this our team has access to various associations across the globe across different industries. Lastly, we have exchange relationships with various university as well as individual libraries.

Step 2: Primary Research
When we talk about primary research, it is a type of study in which the researchers collect relevant data samples directly, rather than relying on previously collected data. This type of research is focused on gaining content specific facts that can be sued to solve specific problems. Since the collected data is fresh and first hand therefore it makes the study more accurate and genuine.
We at SNS Insider have divided Primary Research into 2 parts.
Part 1 wherein we interview the KOLs of major players as well as the upcoming ones across various geographic regions. This allows us to have their view over the market scenario and acts as an important tool to come closer to the accurate market numbers. As many as 45 paid and unpaid primary interviews are taken from both the demand and supply side of the industry to make sure we land at an accurate judgement and analysis of the market.
This step involves the triangulation of data wherein our team analyses the interview transcripts, online survey responses and observation of on filed participants. The below mentioned chart should give a better understanding of the part 1 of the primary interview.

Part 2: In this part of primary research the data collected via secondary research and the part 1 of the primary research is validated with the interviews from individual consultants and subject matter experts.
Consultants are those set of people who have at least 12 years of experience and expertise within the industry whereas Subject Matter Experts are those with at least 15 years of experience behind their back within the same space. The data with the help of two main processes i.e., FGDs (Focused Group Discussions) and IDs (Individual Discussions). This gives us a 3rd party nonbiased primary view of the market scenario making it a more dependable one while collation of the data pointers.
Step 3: Data Bank Validation
Once all the information is collected via primary and secondary sources, we run that information for data validation. At our intelligence centre our research heads track a lot of information related to the market which includes the quarterly reports, the daily stock prices, and other relevant information. Our data bank server gets updated every fortnight and that is how the information which we collected using our primary and secondary information is revalidated in real time.

Step 4: QA/QC Process
After all the data collection and validation our team does a final level of quality check and quality assurance to get rid of any unwanted or undesired mistakes. This might include but not limited to getting rid of the any typos, duplication of numbers or missing of any important information. The people involved in this process include technical content writers, research heads and graphics people. Once this process is completed the title gets uploader on our platform for our clients to read it.
Step 5: Final QC/QA Process:
This is the last process and comes when the client has ordered the study. In this process a final QA/QC is done before the study is emailed to the client. Since we believe in giving our clients a good experience of our research studies, therefore, to make sure that we do not lack at our end in any way humanly possible we do a final round of quality check and then dispatch the study to the client.
Key Segments:
By Product
Electric
Manual
By End Use
Hospitals
Clinics
Others
Request for Segment Customization as per your Business Requirement: Segment Customization Request
REGIONAL COVERAGE:
North America
US
Canada
Mexico
Europe
Eastern Europe
Poland
Romania
Hungary
Turkey
Rest of Eastern Europe
Western Europe
Germany
France
UK
Italy
Spain
Netherlands
Switzerland
Austria
Rest of Western Europe
Asia Pacific
China
India
Japan
South Korea
Vietnam
Singapore
Australia
Rest of Asia Pacific
Middle East & Africa
Middle East
UAE
Egypt
Saudi Arabia
Qatar
Rest of the Middle East
Africa
Nigeria
South Africa
Rest of Africa
Latin America
Brazil
Argentina
Colombia
Request for Country Level Research Report: Country Level Customization Request
Available Customization
With the given market data, SNS Insider offers customization as per the company’s specific needs. The following customization options are available for the report:
Product Analysis
Criss-Cross segment analysis (e.g. Product X Application)
Product Matrix which gives a detailed comparison of product portfolio of each company
Geographic Analysis
Additional countries in any of the regions
Company Information
Detailed analysis and profiling of additional market players (Up to five)
The Dental Sterilization Market was valued at USD 1.54 billion in 2023 and is expected to reach USD 3.30 billion by 2032, growing at a CAGR of 8.86% over the forecast period of 2024-2032.
The CyberKnife Market was valued at USD 542.14 million in 2023 and is expected to reach USD 2340.47 million by 2032, growing at a CAGR of 17.67% over the forecast period of 2024-2032.
The Peptic Ulcer Drugs Market size was USD 4.87 Billion in 2023 and is expected to reach USD 6.43 Billion by 2032 and grow at a CAGR of 3.16% over the forecast period of 2024-2032.
The In-Vitro Toxicology Assays Market for Cannabis and Nicotine Testing was valued at USD 1.72 billion in 2023 and is expected to reach USD 4.98 billion by 2032, growing at a CAGR of 12.57% over the forecast period of 2024-2032.
The Antiperspirants and Deodorants Market Size was valued at USD 62,889 million in 2023 and is expected to reach USD 81,920.89 million by 2031, and grow at a CAGR of 3.36% over the forecast period 2024-2031.
The Podiatry Services Market was valued at USD 4.61 billion in 2023 and is expected to reach USD 5.81 billion by 2032, growing at a CAGR of 2.65% from 2024-2032.

Hi! Click one of our member below to chat on Phone
© 2025 All Rights Reserved by SNS Insider Pvt Ltd


