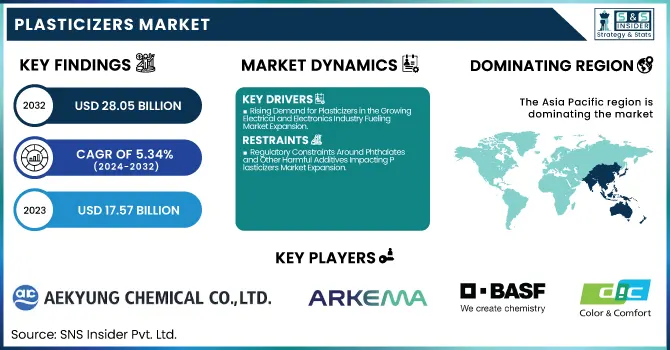
The Plasticizers Market Size was valued at USD 17.57 Billion in 2023 and is expected to reach USD 28.05 Billion by 2032, growing at a CAGR of 5.34% over the forecast period of 2024-2032.
To Get more information on Plasticizers Market - Request Free Sample Report
The Plasticizers Market is evolving due to several key factors. Our report examines price fluctuations in raw materials, highlighting how global supply disruptions affect costs. It also explores the geographic distribution of plasticizers demand, focusing on the growing market in Asia Pacific and varied trends across North America and Europe. The increasing emphasis on sustainability is driving government subsidies and support for green plasticizers, promoting eco-friendly alternatives. Additionally, trade policies are influencing market dynamics, shaping global import and export strategies. Lastly, we delve into the environmental impact of plasticizers, addressing both the challenges and opportunities as the industry shifts toward greener solutions. These insights offer a comprehensive view of the Plasticizers Market's current and future landscape.
The US Plasticizers Market Size was valued at USD 5.22 Billion in 2023 with a market share of around 69% and growing at a significant CAGR over the forecast period of 2024-2032.
The U.S. Plasticizers Market is witnessing steady growth, driven by rising demand in industries like automotive, construction, and healthcare. The shift towards non-phthalate plasticizers is propelled by growing consumer preference for safer, eco-friendly alternatives, with companies like ExxonMobil leading innovations in sustainable solutions. The American Chemistry Council (ACC) emphasizes the need for safer chemical products, fostering regulatory support for green plasticizers. Additionally, the expanding wire and cable industry in the U.S. is further fueling plasticizer demand, with Eastman Chemical Company focusing on high-performance plasticizers for this sector. The overall trend reflects both environmental and regulatory pressures promoting market growth.
Drivers
Rising Demand for Plasticizers in the Growing Electrical and Electronics Industry Fueling Market Expansion
The expansion of the electrical and electronics sector is significantly driving the demand for plasticizers. Electrical products, particularly wires and cables, require enhanced flexibility and durability to withstand exposure to heat and mechanical stress. As industries worldwide, including telecommunications, renewable energy, and electric vehicles, experience rapid technological advancements, the need for flexible and durable materials has soared. Plasticizers play a vital role in achieving these properties. The electronics sector’s evolution, driven by the demand for smartphones, wearables, and smart home devices, also necessitates high-performance materials with improved electrical insulation and longevity. LG Chem Ltd. and ExxonMobil have adapted to this demand by providing tailored plasticizer solutions that ensure electrical components meet stringent standards for performance and safety. In the renewable energy sector, which is seeing rapid growth due to increasing investments in solar panels and electric vehicles, plasticizers are essential for optimizing flexible cables and other components. As demand for cutting-edge electronics continues to rise, the Plasticizers Market will benefit from ongoing innovation and an expanding customer base within the electronics sector.
Restraints
Regulatory Constraints Around Phthalates and Other Harmful Additives Impacting Plasticizers Market Expansion
Regulatory constraints surrounding phthalates and other harmful chemical additives continue to be a significant restraint in the Plasticizers Market. Governments globally are increasingly tightening regulations surrounding chemicals deemed harmful to human health and the environment. In regions like the European Union and North America, phthalates are under significant scrutiny, particularly in consumer goods and medical products. The U.S. Food and Drug Administration (FDA) and the European Chemicals Agency (ECHA) have enacted bans and regulations that restrict the use of phthalates in specific applications, such as toys, food packaging, and medical devices. This has compelled manufacturers to invest in safer, non-toxic alternatives. However, the transition to non-phthalate plasticizers often involves higher research and development costs, as manufacturers must ensure that these new alternatives meet the performance and durability standards required in industries such as automotive, construction, and packaging. Additionally, regulatory barriers may limit the growth of traditional plasticizers, affecting market expansion and leading to higher product costs in the short term, as companies struggle to meet new regulatory demands.
Opportunities
Expanding Use of Bio-Based Plasticizers in Sustainable Packaging Solutions Creating Growth Prospects
The growing trend towards sustainability in packaging is creating a significant opportunity for the Plasticizers Market, particularly the increasing adoption of bio-based plasticizers. Traditional petroleum-based plasticizers have faced growing criticism due to their environmental impact, driving manufacturers to seek more sustainable alternatives. Bio-based plasticizers, derived from renewable sources like plant oils and sugars, offer a more eco-friendly solution. As consumer demand for environmentally responsible products grows, the packaging industry is turning to these bio-based solutions to reduce the carbon footprint and improve sustainability. The European Union’s Circular Economy Action Plan and various governmental regulations encourage manufacturers to move away from harmful chemicals, including petroleum-based plasticizers, in packaging materials. BASF SE and Polynt S.p.A. have recognized the potential of bio-based plasticizers and are investing in new technologies to produce these alternatives at scale. The packaging sector, driven by industries like food and beverages, cosmetics, and pharmaceuticals, is expected to significantly increase its consumption of bio-based plasticizers, thus fostering growth within the market.
Challenge
Sustainability Challenges in Producing High-Quality Plasticizers Without Compromising on Material Performance
Ensuring that plasticizers remain sustainable without sacrificing performance is a key challenge in the industry. Many of the newer, more environmentally friendly plasticizers, such as bio-based or non-phthalate plasticizers, often struggle to match the performance characteristics of their traditional petroleum-based counterparts. These include durability, flexibility, and heat resistance, which are essential in applications like automotive parts, construction materials, and electrical insulation. Manufacturers are also under pressure to create plasticizers that can perform under extreme conditions, including high temperatures, while also adhering to sustainability standards. While bio-based plasticizers offer significant environmental benefits, their production can be more costly and less efficient compared to traditional options. Balancing the need for higher sustainability with the need for high-performance plasticizers remains a persistent challenge for the industry. Companies like BASF SE and Eastman Chemical Company are investing in R&D to overcome these challenges by improving the performance characteristics of bio-based alternatives, but the trade-off between sustainability and material performance continues to be a significant obstacle in the market.
By Type
Phthalate dominated the Plasticizers Market in 2023 with a market share of 59.4%. Among phthalates, Dioctyl Phthalate (DOP) is the leading subsegment due to its excellent performance characteristics, cost-effectiveness, and widespread industrial adoption. DOP offers outstanding plasticizing efficiency and compatibility with PVC, making it a preferred choice in flexible vinyl products. For instance, in applications such as cable insulation, flooring, and wall coverings, DOP enhances flexibility and durability, essential for long-term product performance. Additionally, phthalates like Diisononyl Phthalate (DINP) and Diisodecyl Phthalate (DIDP) are widely used in automotive and construction sectors due to their lower volatility and better weathering resistance. The U.S. Environmental Protection Agency (EPA) and the European Chemicals Agency (ECHA) have conducted extensive evaluations on phthalates, but their continued industrial use underscores their functional benefits and regulatory manageability. Furthermore, countries like China and India continue to rely on phthalates owing to their mature manufacturing infrastructure and low production costs, reinforcing their dominant share in the global plasticizers market.
By Application
Wires & Cables dominated the Plasticizers Market in 2023 with a market share of 29.7%. This dominance is largely attributed to the increasing global demand for electricity, telecom networks, and electronic devices, which require durable and flexible wiring systems. Plasticizers, especially phthalates like DOP and DINP, are crucial for imparting flexibility to PVC used in wire and cable insulation and sheathing. Rapid urbanization in developing regions and large-scale infrastructural projects such as India's Smart Cities Mission and China's Belt and Road Initiative are major contributors to the booming demand for wires and cables. Furthermore, as renewable energy installations rise, especially solar and wind energy systems, the need for weather-resistant, flexible cables has increased. For instance, the U.S. Department of Energy has supported numerous grid expansion projects under the Grid Resilience and Innovation Partnership (GRIP) program, accelerating the deployment of plasticizer-rich cable systems. Thus, robust utility infrastructure development and sustained investment in electronics and energy are key reasons why the wire and cable segment leads in the plasticizers market.
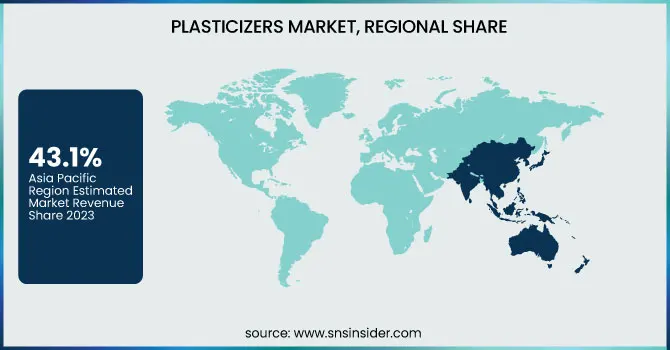
Asia Pacific dominated the Plasticizers Market in 2023 with a market share of 43.1%. This dominance is fueled by rapid industrialization, booming construction activities, and a strong manufacturing base for PVC products in countries such as China, India, Japan, and South Korea. China remains the largest producer and consumer of plasticizers globally, supported by a well-established PVC industry and government initiatives like the “Made in China 2025” strategy aimed at strengthening industrial growth. For instance, China’s Ministry of Housing and Urban-Rural Development has pushed extensive smart infrastructure programs, increasing demand for flexible PVC products across construction and electrical applications. In India, the surge in real estate and infrastructure development under programs like Pradhan Mantri Awas Yojana and the Smart Cities Mission has boosted consumption of plasticizers in flooring, cables, and wall coverings. Meanwhile, Southeast Asian nations are witnessing strong investments in electronics manufacturing and automotive assembly, where plasticizers are crucial for flexible films, coatings, and wire insulation. With a growing population and expanding middle-class consumption, the Asia Pacific region's demand for consumer goods and construction materials continues to escalate, firmly anchoring its dominance in the global plasticizers market.
On the other hand, North America emerged as the fastest-growing region in the Plasticizers Market during the forecast period of 2024 to 2032. This growth is primarily driven by the rising demand for sustainable and non-phthalate plasticizers, advancements in manufacturing technologies, and increasing investments in construction and renewable energy sectors. The United States leads the region due to stringent regulatory frameworks from the Environmental Protection Agency (EPA) and the Consumer Product Safety Commission (CPSC), which encourage the use of safer alternatives like DINCH and bio-based plasticizers. Additionally, there is a resurgence in construction activities supported by the Infrastructure Investment and Jobs Act, which has earmarked over $1 trillion for rebuilding roads, power grids, and broadband networks key segments that require flexible plasticizer-enhanced materials. Canada is also contributing to regional growth through its initiatives in green construction and energy-efficient housing, driving demand for advanced materials using safe plasticizers. Mexico’s expanding automotive and electronics industries are further increasing the use of flexible PVC and coatings, especially in wire harnesses and interiors. Collectively, these drivers support North America's position as the fastest-growing region in the plasticizers market.
Get Customized Report as per Your Business Requirement - Enquiry Now
Aekyung Petrochemical (DOP, DINP, DOTP)
Arkema S.A. (Vikoflex 7170, Vikoflex 6080, Epoxol 7-4)
BASF SE (DINCH, Hexamoll DINCH, Palatinol N)
Bluesail Group Co., Ltd. (DOP, DOTP, DINP)
DIC Corporation (DIDP, DOA, TOTM)
Eastman Chemical Company (DOP, DOTP, TOTM)
Evonik Industries AG (VESTINOL 9, ELATUR CH, VESTINOL IN)
ExxonMobil Corporation (Jayflex DINP, Jayflex DIDP, Jayflex DTDP)
Indo-Nippon Chemical Co. Ltd. (DOP, DBP, DEP)
KLJ Group (DOP, DINP, DOTP)
LANXESS AG (Mesamoll, Adimoll, Ultramoll)
LG Chem Ltd. (DOP, DINP, DOTP)
Nan Ya Plastics Corporation (DOP, DOTP, DINP)
OXEA Corporation (DOA, DOTP, DBT)
Perstorp (Pevalen, Emoltene 100, Emoltene 50)
Polynt S.p.A. (TOTM, DOA, DBP)
UPC Technology Corporation (DOP, DOTP, DINP)
Valtris Specialty Chemicals (Benzoflex 9-88, Benzoflex 1046, Santicizer 160)
Velsicol Chemical, LLC (Santicizer 160, Santicizer 278, Santicizer 141)
Zhejiangjiaao Enprotech Stock Co., Ltd. (DOTP, TOTM, ATBC)
October 2024: Evonik Oxeno expanded production capacities for its ELATUR CH and ELATUR DINCD plasticizers at its Marl facility in Germany to meet rising European demand. The expansion supports reliable supply and sustainable production, with options for mass-balanced raw materials. Evonik also reaffirmed its commitment to maintaining a rigorously evaluated plasticizer portfolio, including VESTINOL 9, aligning with its focus on innovation and environmental responsibility.
| Report Attributes | Details |
|---|---|
| Market Size in 2023 | USD 17.57 Billion |
| Market Size by 2032 | USD 28.05 Billion |
| CAGR | CAGR of 5.34% From 2024 to 2032 |
| Base Year | 2023 |
| Forecast Period | 2024-2032 |
| Historical Data | 2020-2022 |
| Report Scope & Coverage | Market Size, Segments Analysis, Competitive Landscape, Regional Analysis, DROC & SWOT Analysis, Forecast Outlook |
| Key Segments | •By Type (Phthalate [Dioctyl phthalate (DOP), Diisononyl phthalate (DINP), Diisodecyl phthalate (DIDP), Di(2-propylheptyl) phthalate (DPHP), Dibutyl phthalate (DBP), Diisobutyl phthalate (DIBP)], Non-phthalate [Terephthalates, Adipates, Maleates, 1,2-cyclohexane dicarboxylic acid diisononyl ester (DINCH)]) •By Application (Wires & Cables, Floorings & Wall Coverings, Films & Sheets, Coated Fabrics, Consumer Goods, Others) |
| Regional Analysis/Coverage | North America (US, Canada, Mexico), Europe (Eastern Europe [Poland, Romania, Hungary, Turkey, Rest of Eastern Europe] Western Europe] Germany, France, UK, Italy, Spain, Netherlands, Switzerland, Austria, Rest of Western Europe]), Asia Pacific (China, India, Japan, South Korea, Vietnam, Singapore, Australia, Rest of Asia Pacific), Middle East & Africa (Middle East [UAE, Egypt, Saudi Arabia, Qatar, Rest of Middle East], Africa [Nigeria, South Africa, Rest of Africa], Latin America (Brazil, Argentina, Colombia, Rest of Latin America) |
| Company Profiles | BASF SE, ExxonMobil Corporation, Eastman Chemical Company, Evonik Industries AG, LG Chem Ltd., UPC Technology Corporation, Nan Ya Plastics Corporation, DIC Corporation, Aekyung Petrochemical, KLJ Group and other key players |
Ans: The Plasticizers Market was valued at USD 17.57 billion in 2023 and is expected to grow to USD 28.05 billion by 2032, with a CAGR of 5.34% during the forecast period.
Ans: The expanding electrical and electronics sectors, particularly the demand for flexible cables and insulation, are significantly driving the growth of the Plasticizers Market.
Ans: The growing use of bio-based plasticizers, particularly in sustainable packaging, is creating significant opportunities in the Plasticizers Market, driven by increasing environmental consciousness and regulatory support.
Ans: The Wires & Cables segment dominated the Plasticizers Market in 2023, accounting for 29.7%, driven by the increasing global demand for flexible and durable electrical wiring systems.
Ans: North America’s Plasticizers Market growth is driven by the shift to safer, non-phthalate plasticizers, construction sector investments, and the growing demand for flexible materials in renewable energy projects.
Table of Content
1. Introduction
1.1 Market Definition
1.2 Scope (Inclusion and Exclusions)
1.3 Research Assumptions
2. Executive Summary
2.1 Market Overview
2.2 Regional Synopsis
2.3 Competitive Summary
3. Research Methodology
3.1 Top-Down Approach
3.2 Bottom-up Approach
3.3. Data Validation
3.4 Primary Interviews
4. Market Dynamics Impact Analysis
4.1 Market Driving Factors Analysis
4.1.2 Drivers
4.1.2 Restraints
4.1.3 Opportunities
4.1.4 Challenges
4.2 PESTLE Analysis
4.3 Porter’s Five Forces Model
5. Statistical Insights and Trends Reporting
5.1 Price Fluctuations in Raw Materials for Plasticizers
5.2 Geographic Distribution of Plasticizers Demand
5.3 Government Subsidies and Support for Green Plasticizers
5.4 Trade Policies on Plasticizers Market Dynamics
5.5 Sustainability and Environmental Impact of Plasticizers
6. Competitive Landscape
6.1 List of Major Companies, By Region
6.2 Market Share Analysis, By Region
6.3 Product Benchmarking
6.3.1 Product specifications and features
6.3.2 Pricing
6.4 Strategic Initiatives
6.4.1 Marketing and promotional activities
6.4.2 Distribution and supply chain strategies
6.4.3 Expansion plans and new product launches
6.4.4 Strategic partnerships and collaborations
6.5 Technological Advancements
6.6 Market Positioning and Branding
7. Plasticizers Market Segmentation, by Type
7.1 Chapter Overview
7.2 Phthalate
7.2.1 Phthalate Market Trends Analysis (2020-2032)
7.2.2 Phthalate Market Size Estimates and Forecasts to 2032 (USD Billion)
7.2.3 Dioctyl phthalate (DOP)
7.2.3.1 Dioctyl phthalate (DOP) Market Trends Analysis (2020-2032)
7.2.3.2 Dioctyl phthalate (DOP) Market Size Estimates and Forecasts to 2032 (USD Billion)
7.2.4 Diisononyl phthalate (DINP)
7.2.4.1 Diisononyl phthalate (DINP) Market Trends Analysis (2020-2032)
7.2.4.2 Diisononyl phthalate (DINP) Market Size Estimates and Forecasts to 2032 (USD Billion)
7.2.5 Diisodecyl phthalate (DIDP)
7.2.5.1 Diisodecyl phthalate (DIDP) Market Trends Analysis (2020-2032)
7.2.5.2 Diisodecyl phthalate (DIDP) Market Size Estimates and Forecasts to 2032 (USD Billion)
7.2.6 Di(2-propylheptyl) phthalate (DPHP)
7.2.6.1 Di(2-propylheptyl) phthalate (DPHP) Market Trends Analysis (2020-2032)
7.2.6.2 Di(2-propylheptyl) phthalate (DPHP) Market Size Estimates and Forecasts to 2032 (USD Billion)
7.2.7 Dibutyl phthalate (DBP)
7.2.7.1 Dibutyl phthalate (DBP) Market Trends Analysis (2020-2032)
7.2.7.2 Dibutyl phthalate (DBP) Market Size Estimates and Forecasts to 2032 (USD Billion)
7.2.8 Diisobutyl phthalate (DIBP)
7.2.8.1 Diisobutyl phthalate (DIBP) Market Trends Analysis (2020-2032)
7.2.8.2 Diisobutyl phthalate (DIBP) Market Size Estimates and Forecasts to 2032 (USD Billion)
7.3 Non-phthalate
7.3.1 Non-phthalate Market Trends Analysis (2020-2032)
7.3.2 Non-phthalate Market Size Estimates and Forecasts to 2032 (USD Billion)
7.3.3 Terephthalates
7.3.3.1 Terephthalates Market Trends Analysis (2020-2032)
7.3.3.2 Terephthalates Market Size Estimates and Forecasts to 2032 (USD Billion)
7.4.4 Adipates
7.4.4.1 Adipates Market Trends Analysis (2020-2032)
7.4.4.2 Adipates Market Size Estimates and Forecasts to 2032 (USD Billion)
7.5.5 Maleates
7.5.5.1 Maleates Market Trends Analysis (2020-2032)
7.5.5.2 Maleates Market Size Estimates and Forecasts to 2032 (USD Billion)
7.6.6 1,2-cyclohexane dicarboxylic acid diisononyl ester (DINCH)
7.6.6.1 1,2-cyclohexane dicarboxylic acid diisononyl ester (DINCH) Market Trends Analysis (2020-2032)
7.6.6.2 1,2-cyclohexane dicarboxylic acid diisononyl ester (DINCH) Market Size Estimates and Forecasts to 2032 (USD Billion)
8. Plasticizers Market Segmentation, by Application
8.1 Chapter Overview
8.2 Wires & Cables
8.2.1 Wires & Cables Market Trends Analysis (2020-2032)
8.2.2 Wires & Cables Market Size Estimates and Forecasts to 2032 (USD Billion)
8.3 Floorings & Wall Coverings
8.3.1 Floorings & Wall Coverings Market Trends Analysis (2020-2032)
8.3.2 Floorings & Wall Coverings Market Size Estimates and Forecasts to 2032 (USD Billion)
8.4 Films & Sheets
8.4.1 Films & Sheets Market Trends Analysis (2020-2032)
8.4.2 Films & Sheets Market Size Estimates and Forecasts to 2032 (USD Billion)
8.5 Coated Fabrics
8.5.1 Coated Fabrics Market Trends Analysis (2020-2032)
8.5.2 Coated Fabrics Market Size Estimates and Forecasts to 2032 (USD Billion)
8.6 Consumer Goods
8.6.1 Consumer Goods Market Trends Analysis (2020-2032)
8.6.2 Consumer Goods Market Size Estimates and Forecasts to 2032 (USD Billion)
8.7 Others
8.7.1 Others Market Trends Analysis (2020-2032)
8.7.2 Others Market Size Estimates and Forecasts to 2032 (USD Billion)
9. Regional Analysis
9.1 Chapter Overview
9.2 North America
9.2.1 Trends Analysis
9.2.2 North America Plasticizers Market Estimates and Forecasts, by Country (2020-2032) (USD Billion)
9.2.3 North America Plasticizers Market Estimates and Forecasts, by Type (2020-2032) (USD Billion)
9.2.4 North America Plasticizers Market Estimates and Forecasts, by Application (2020-2032) (USD Billion)
9.2.5 USA
9.2.5.1 USA Plasticizers Market Estimates and Forecasts, by Type (2020-2032) (USD Billion)
9.2.5.2 USA Plasticizers Market Estimates and Forecasts, by Application (2020-2032) (USD Billion)
9.2.6 Canada
9.2.6.1 Canada Plasticizers Market Estimates and Forecasts, by Type (2020-2032) (USD Billion)
9.2.6.2 Canada Plasticizers Market Estimates and Forecasts, by Application (2020-2032) (USD Billion)
9.2.7 Mexico
9.2.7.1 Mexico Plasticizers Market Estimates and Forecasts, by Type (2020-2032) (USD Billion)
9.2.7.2 Mexico Plasticizers Market Estimates and Forecasts, by Application (2020-2032) (USD Billion)
9.3 Europe
9.3.1 Eastern Europe
9.3.1.1 Trends Analysis
9.3.1.2 Eastern Europe Plasticizers Market Estimates and Forecasts, by Country (2020-2032) (USD Billion)
9.3.1.3 Eastern Europe Plasticizers Market Estimates and Forecasts, by Type (2020-2032) (USD Billion)
9.3.1.4 Eastern Europe Plasticizers Market Estimates and Forecasts, by Application (2020-2032) (USD Billion)
9.3.1.5 Poland
9.3.1.5.1 Poland Plasticizers Market Estimates and Forecasts, by Type (2020-2032) (USD Billion)
9.3.1.5.2 Poland Plasticizers Market Estimates and Forecasts, by Application (2020-2032) (USD Billion)
9.3.1.6 Romania
9.3.1.6.1 Romania Plasticizers Market Estimates and Forecasts, by Type (2020-2032) (USD Billion)
9.3.1.6.2 Romania Plasticizers Market Estimates and Forecasts, by Application (2020-2032) (USD Billion)
9.3.1.7 Hungary
9.3.1.7.1 Hungary Plasticizers Market Estimates and Forecasts, by Type (2020-2032) (USD Billion)
9.3.1.7.2 Hungary Plasticizers Market Estimates and Forecasts, by Application (2020-2032) (USD Billion)
9.3.1.8 Turkey
9.3.1.8.1 Turkey Plasticizers Market Estimates and Forecasts, by Type (2020-2032) (USD Billion)
9.3.1.8.2 Turkey Plasticizers Market Estimates and Forecasts, by Application (2020-2032) (USD Billion)
9.3.1.9 Rest of Eastern Europe
9.3.1.9.1 Rest of Eastern Europe Plasticizers Market Estimates and Forecasts, by Type (2020-2032) (USD Billion)
9.3.1.9.2 Rest of Eastern Europe Plasticizers Market Estimates and Forecasts, by Application (2020-2032) (USD Billion)
9.3.2 Western Europe
9.3.2.1 Trends Analysis
9.3.2.2 Western Europe Plasticizers Market Estimates and Forecasts, by Country (2020-2032) (USD Billion)
9.3.2.3 Western Europe Plasticizers Market Estimates and Forecasts, by Type (2020-2032) (USD Billion)
9.3.2.4 Western Europe Plasticizers Market Estimates and Forecasts, by Application (2020-2032) (USD Billion)
9.3.2.5 Germany
9.3.2.5.1 Germany Plasticizers Market Estimates and Forecasts, by Type (2020-2032) (USD Billion)
9.3.2.5.2 Germany Plasticizers Market Estimates and Forecasts, by Application (2020-2032) (USD Billion)
9.3.2.6 France
9.3.2.6.1 France Plasticizers Market Estimates and Forecasts, by Type (2020-2032) (USD Billion)
9.3.2.6.2 France Plasticizers Market Estimates and Forecasts, by Application (2020-2032) (USD Billion)
9.3.2.7 UK
9.3.2.7.1 UK Plasticizers Market Estimates and Forecasts, by Type (2020-2032) (USD Billion)
9.3.2.7.2 UK Plasticizers Market Estimates and Forecasts, by Application (2020-2032) (USD Billion)
9.3.2.8 Italy
9.3.2.8.1 Italy Plasticizers Market Estimates and Forecasts, by Type (2020-2032) (USD Billion)
9.3.2.8.2 Italy Plasticizers Market Estimates and Forecasts, by Application (2020-2032) (USD Billion)
9.3.2.9 Spain
9.3.2.9.1 Spain Plasticizers Market Estimates and Forecasts, by Type (2020-2032) (USD Billion)
9.3.2.9.2 Spain Plasticizers Market Estimates and Forecasts, by Application (2020-2032) (USD Billion)
9.3.2.10 Netherlands
9.3.2.10.1 Netherlands Plasticizers Market Estimates and Forecasts, by Type (2020-2032) (USD Billion)
9.3.2.10.2 Netherlands Plasticizers Market Estimates and Forecasts, by Application (2020-2032) (USD Billion)
9.3.2.11 Switzerland
9.3.2.11.1 Switzerland Plasticizers Market Estimates and Forecasts, by Type (2020-2032) (USD Billion)
9.3.2.11.2 Switzerland Plasticizers Market Estimates and Forecasts, by Application (2020-2032) (USD Billion)
9.3.2.12 Austria
9.3.2.12.1 Austria Plasticizers Market Estimates and Forecasts, by Type (2020-2032) (USD Billion)
9.3.2.12.2 Austria Plasticizers Market Estimates and Forecasts, by Application (2020-2032) (USD Billion)
9.3.2.13 Rest of Western Europe
9.3.2.13.1 Rest of Western Europe Plasticizers Market Estimates and Forecasts, by Type (2020-2032) (USD Billion)
9.3.2.13.2 Rest of Western Europe Plasticizers Market Estimates and Forecasts, by Application (2020-2032) (USD Billion)
9.4 Asia Pacific
9.4.1 Trends Analysis
9.4.2 Asia Pacific Plasticizers Market Estimates and Forecasts, by Country (2020-2032) (USD Billion)
9.4.3 Asia Pacific Plasticizers Market Estimates and Forecasts, by Type (2020-2032) (USD Billion)
9.4.4 Asia Pacific Plasticizers Market Estimates and Forecasts, by Application (2020-2032) (USD Billion)
9.4.5 China
9.4.5.1 China Plasticizers Market Estimates and Forecasts, by Type (2020-2032) (USD Billion)
9.4.5.2 China Plasticizers Market Estimates and Forecasts, by Application (2020-2032) (USD Billion)
9.4.6 India
9.4.5.1 India Plasticizers Market Estimates and Forecasts, by Type (2020-2032) (USD Billion)
9.4.5.2 India Plasticizers Market Estimates and Forecasts, by Application (2020-2032) (USD Billion)
9.4.5 Japan
9.4.5.1 Japan Plasticizers Market Estimates and Forecasts, by Type (2020-2032) (USD Billion)
9.4.5.2 Japan Plasticizers Market Estimates and Forecasts, by Application (2020-2032) (USD Billion)
9.4.6 South Korea
9.4.6.1 South Korea Plasticizers Market Estimates and Forecasts, by Type (2020-2032) (USD Billion)
9.4.6.2 South Korea Plasticizers Market Estimates and Forecasts, by Application (2020-2032) (USD Billion)
9.4.7 Vietnam
9.4.7.1 Vietnam Plasticizers Market Estimates and Forecasts, by Type (2020-2032) (USD Billion)
9.2.7.2 Vietnam Plasticizers Market Estimates and Forecasts, by Application (2020-2032) (USD Billion)
9.4.8 Singapore
9.4.8.1 Singapore Plasticizers Market Estimates and Forecasts, by Type (2020-2032) (USD Billion)
9.4.8.2 Singapore Plasticizers Market Estimates and Forecasts, by Application (2020-2032) (USD Billion)
9.4.9 Australia
9.4.9.1 Australia Plasticizers Market Estimates and Forecasts, by Type (2020-2032) (USD Billion)
9.4.9.2 Australia Plasticizers Market Estimates and Forecasts, by Application (2020-2032) (USD Billion)
9.4.10 Rest of Asia Pacific
9.4.10.1 Rest of Asia Pacific Plasticizers Market Estimates and Forecasts, by Type (2020-2032) (USD Billion)
9.4.10.2 Rest of Asia Pacific Plasticizers Market Estimates and Forecasts, by Application (2020-2032) (USD Billion)
9.5 Middle East and Africa
9.5.1 Middle East
9.5.1.1 Trends Analysis
9.5.1.2 Middle East Plasticizers Market Estimates and Forecasts, by Country (2020-2032) (USD Billion)
9.5.1.3 Middle East Plasticizers Market Estimates and Forecasts, by Type (2020-2032) (USD Billion)
9.5.1.4 Middle East Plasticizers Market Estimates and Forecasts, by Application (2020-2032) (USD Billion)
9.5.1.5 UAE
9.5.1.5.1 UAE Plasticizers Market Estimates and Forecasts, by Type (2020-2032) (USD Billion)
9.5.1.5.2 UAE Plasticizers Market Estimates and Forecasts, by Application (2020-2032) (USD Billion)
9.5.1.6 Egypt
9.5.1.6.1 Egypt Plasticizers Market Estimates and Forecasts, by Type (2020-2032) (USD Billion)
9.5.1.6.2 Egypt Plasticizers Market Estimates and Forecasts, by Application (2020-2032) (USD Billion)
9.5.1.7 Saudi Arabia
9.5.1.7.1 Saudi Arabia Plasticizers Market Estimates and Forecasts, by Type (2020-2032) (USD Billion)
9.5.1.7.2 Saudi Arabia Plasticizers Market Estimates and Forecasts, by Application (2020-2032) (USD Billion)
9.5.1.8 Qatar
9.5.1.8.1 Qatar Plasticizers Market Estimates and Forecasts, by Type (2020-2032) (USD Billion)
9.5.1.8.2 Qatar Plasticizers Market Estimates and Forecasts, by Application (2020-2032) (USD Billion)
9.5.1.9 Rest of Middle East
9.5.1.9.1 Rest of Middle East Plasticizers Market Estimates and Forecasts, by Type (2020-2032) (USD Billion)
9.5.1.9.2 Rest of Middle East Plasticizers Market Estimates and Forecasts, by Application (2020-2032) (USD Billion)
9.5.2 Africa
9.5.2.1 Trends Analysis
9.5.2.2 Africa Plasticizers Market Estimates and Forecasts, by Country (2020-2032) (USD Billion)
9.5.2.3 Africa Plasticizers Market Estimates and Forecasts, by Type (2020-2032) (USD Billion)
9.5.2.4 Africa Plasticizers Market Estimates and Forecasts, by Application (2020-2032) (USD Billion)
9.5.2.5 South Africa
9.5.2.5.1 South Africa Plasticizers Market Estimates and Forecasts, by Type (2020-2032) (USD Billion)
9.5.2.5.2 South Africa Plasticizers Market Estimates and Forecasts, by Application (2020-2032) (USD Billion)
9.5.2.6 Nigeria
9.5.2.6.1 Nigeria Plasticizers Market Estimates and Forecasts, by Type (2020-2032) (USD Billion)
9.5.2.6.2 Nigeria Plasticizers Market Estimates and Forecasts, by Application (2020-2032) (USD Billion)
9.5.2.7 Rest of Africa
9.5.2.7.1 Rest of Africa Plasticizers Market Estimates and Forecasts, by Type (2020-2032) (USD Billion)
9.5.2.7.2 Rest of Africa Plasticizers Market Estimates and Forecasts, by Application (2020-2032) (USD Billion)
9.6 Latin America
9.6.1 Trends Analysis
9.6.2 Latin America Plasticizers Market Estimates and Forecasts, by Country (2020-2032) (USD Billion)
9.6.3 Latin America Plasticizers Market Estimates and Forecasts, by Type (2020-2032) (USD Billion)
9.6.4 Latin America Plasticizers Market Estimates and Forecasts, by Application (2020-2032) (USD Billion)
9.6.5 Brazil
9.6.5.1 Brazil Plasticizers Market Estimates and Forecasts, by Type (2020-2032) (USD Billion)
9.6.5.2 Brazil Plasticizers Market Estimates and Forecasts, by Application (2020-2032) (USD Billion)
9.6.6 Argentina
9.6.6.1 Argentina Plasticizers Market Estimates and Forecasts, by Type (2020-2032) (USD Billion)
9.6.6.2 Argentina Plasticizers Market Estimates and Forecasts, by Application (2020-2032) (USD Billion)
9.6.7 Colombia
9.6.7.1 Colombia Plasticizers Market Estimates and Forecasts, by Type (2020-2032) (USD Billion)
9.6.7.2 Colombia Plasticizers Market Estimates and Forecasts, by Application (2020-2032) (USD Billion)
9.6.8 Rest of Latin America
9.6.8.1 Rest of Latin America Plasticizers Market Estimates and Forecasts, by Type (2020-2032) (USD Billion)
9.6.8.2 Rest of Latin America Plasticizers Market Estimates and Forecasts, by Application (2020-2032) (USD Billion)
10. Company Profiles
10.1 BASF SE
10.1.1 Company Overview
10.1.2 Financial
10.1.3 Products/ Services Offered
110.1.4 SWOT Analysis
10.2 ExxonMobil Corporation
10.2.1 Company Overview
10.2.2 Financial
10.2.3 Products/ Services Offered
10.2.4 SWOT Analysis
10.3 Eastman Chemical Company
10.3.1 Company Overview
10.3.2 Financial
10.3.3 Products/ Services Offered
10.3.4 SWOT Analysis
10.4 Evonik Industries AG
10.4.1 Company Overview
10.4.2 Financial
10.4.3 Products/ Services Offered
10.4.4 SWOT Analysis
10.5 LG Chem Ltd.
10.5.1 Company Overview
10.5.2 Financial
10.5.3 Products/ Services Offered
10.5.4 SWOT Analysis
10.6 UPC Technology Corporation
10.6.1 Company Overview
10.6.2 Financial
10.6.3 Products/ Services Offered
10.6.4 SWOT Analysis
10.7 Nan Ya Plastics Corporation
10.7.1 Company Overview
10.7.2 Financial
10.7.3 Products/ Services Offered
10.7.4 SWOT Analysis
10.8 DIC Corporation
10.8.1 Company Overview
10.8.2 Financial
10.8.3 Products/ Services Offered
10.8.4 SWOT Analysis
10.9 Aekyung Petrochemical
10.9.1 Company Overview
10.9.2 Financial
10.9.3 Products/ Services Offered
10.9.4 SWOT Analysis
10.10 KLJ Group
10.9.1 Company Overview
10.9.2 Financial
10.9.3 Products/ Services Offered
10.9.4 SWOT Analysis
11. Use Cases and Best Practices
12. Conclusion
An accurate research report requires proper strategizing as well as implementation. There are multiple factors involved in the completion of good and accurate research report and selecting the best methodology to compete the research is the toughest part. Since the research reports we provide play a crucial role in any company’s decision-making process, therefore we at SNS Insider always believe that we should choose the best method which gives us results closer to reality. This allows us to reach at a stage wherein we can provide our clients best and accurate investment to output ratio.
Each report that we prepare takes a timeframe of 350-400 business hours for production. Starting from the selection of titles through a couple of in-depth brain storming session to the final QC process before uploading our titles on our website we dedicate around 350 working hours. The titles are selected based on their current market cap and the foreseen CAGR and growth.
The 5 steps process:
Step 1: Secondary Research:
Secondary Research or Desk Research is as the name suggests is a research process wherein, we collect data through the readily available information. In this process we use various paid and unpaid databases which our team has access to and gather data through the same. This includes examining of listed companies’ annual reports, Journals, SEC filling etc. Apart from this our team has access to various associations across the globe across different industries. Lastly, we have exchange relationships with various university as well as individual libraries.

Step 2: Primary Research
When we talk about primary research, it is a type of study in which the researchers collect relevant data samples directly, rather than relying on previously collected data. This type of research is focused on gaining content specific facts that can be sued to solve specific problems. Since the collected data is fresh and first hand therefore it makes the study more accurate and genuine.
We at SNS Insider have divided Primary Research into 2 parts.
Part 1 wherein we interview the KOLs of major players as well as the upcoming ones across various geographic regions. This allows us to have their view over the market scenario and acts as an important tool to come closer to the accurate market numbers. As many as 45 paid and unpaid primary interviews are taken from both the demand and supply side of the industry to make sure we land at an accurate judgement and analysis of the market.
This step involves the triangulation of data wherein our team analyses the interview transcripts, online survey responses and observation of on filed participants. The below mentioned chart should give a better understanding of the part 1 of the primary interview.

Part 2: In this part of primary research the data collected via secondary research and the part 1 of the primary research is validated with the interviews from individual consultants and subject matter experts.
Consultants are those set of people who have at least 12 years of experience and expertise within the industry whereas Subject Matter Experts are those with at least 15 years of experience behind their back within the same space. The data with the help of two main processes i.e., FGDs (Focused Group Discussions) and IDs (Individual Discussions). This gives us a 3rd party nonbiased primary view of the market scenario making it a more dependable one while collation of the data pointers.
Step 3: Data Bank Validation
Once all the information is collected via primary and secondary sources, we run that information for data validation. At our intelligence centre our research heads track a lot of information related to the market which includes the quarterly reports, the daily stock prices, and other relevant information. Our data bank server gets updated every fortnight and that is how the information which we collected using our primary and secondary information is revalidated in real time.

Step 4: QA/QC Process
After all the data collection and validation our team does a final level of quality check and quality assurance to get rid of any unwanted or undesired mistakes. This might include but not limited to getting rid of the any typos, duplication of numbers or missing of any important information. The people involved in this process include technical content writers, research heads and graphics people. Once this process is completed the title gets uploader on our platform for our clients to read it.
Step 5: Final QC/QA Process:
This is the last process and comes when the client has ordered the study. In this process a final QA/QC is done before the study is emailed to the client. Since we believe in giving our clients a good experience of our research studies, therefore, to make sure that we do not lack at our end in any way humanly possible we do a final round of quality check and then dispatch the study to the client.
Key Segments:
By Type
Phthalate
Dioctyl phthalate (DOP)
Diisononyl phthalate (DINP)
Diisodecyl phthalate (DIDP)
Di(2-propylheptyl) phthalate (DPHP)
Dibutyl phthalate (DBP)
Diisobutyl phthalate (DIBP)
Non-phthalate
Terephthalates
Adipates
Maleates
1,2-cyclohexane dicarboxylic acid diisononyl ester (DINCH)
By Application
Wires & Cables
Floorings & Wall Coverings
Films & Sheets
Coated Fabrics
Consumer Goods
Others
Request for Segment Customization as per your Business Requirement: Segment Customization Request
Regional Coverage:
North America
US
Canada
Mexico
Europe
Eastern Europe
Poland
Romania
Hungary
Turkey
Rest of Eastern Europe
Western Europe
Germany
France
UK
Italy
Spain
Netherlands
Switzerland
Austria
Rest of Western Europe
Asia Pacific
China
India
Japan
South Korea
Vietnam
Singapore
Australia
Rest of Asia Pacific
Middle East & Africa
Middle East
UAE
Egypt
Saudi Arabia
Qatar
Rest of Middle East
Africa
Nigeria
South Africa
Rest of Africa
Latin America
Brazil
Argentina
Colombia
Rest of Latin America
Request for Country Level Research Report: Country Level Customization Request
Available Customization
With the given market data, SNS Insider offers customization as per the company’s specific needs. The following customization options are available for the report:
Detailed Volume Analysis
Criss-Cross segment analysis (e.g. Product X Application)
Competitive Product Benchmarking
Geographic Analysis
Additional countries in any of the regions
Customized Data Representation
Detailed analysis and profiling of additional market players
The Argon Market Size was valued at USD 19.02 Billion in 2023 and is expected to reach USD 34.97 Billion by 2032, growing at a CAGR of 7.00% from 2024 to 2032.
Self-Healing Coatings Market was valued at USD 2.69 Billion in 2023 and is expected to reach USD 19.60 Billion by 2032, at a CAGR of 24.68% from 2024-2032.
Electric Vehicle Fluids Market Size was valued at USD 1.2 Billion in 2023 and is expected to reach USD 12.6 Billion by 2032 and grow at a CAGR of 29.5% over the forecast period 2024-2032.
Emulsifiers Market was valued at USD 9.02 Billion in 2023 and is expected to reach USD 14.82 Billion by 2032, growing at a CAGR of 5.68% from 2024 to 2032.
Hydrodesulfurization Catalysts Market was valued at USD 2.91 billion in 2023 and is expected to reach USD 4.20 billion by 2032, at a CAGR of 4.20% by 2024-2032.
The Aluminum Extrusion Market Size was valued at USD 84.26 billion in 2023 and is expected to reach USD 165.32 billion by 2032 and grow at a CAGR of 8.88% over the forecast period 2024-2032.

Hi! Click one of our member below to chat on Phone
© 2025 All Rights Reserved by SNS Insider Pvt Ltd


