Plastic To Fuel Market Size:
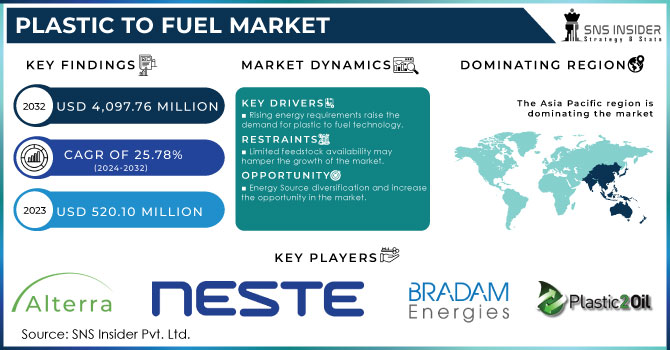
The Plastic To Fuel Market Size was valued at USD 520.10 million in 2023 and is expected to reach USD 4,097.76 million by 2032 and grow at a CAGR of 25.78% over the forecast period 2024-2032.
This industry is expanding due to rising demand for energy produced from waste. Governments in many locations are turning to plastic to produce energy due to an increase in garbage from homes and industries. The market's growth is projected to be positively impacted in the upcoming years by a favorable regulatory environment together with government support in the form of tax breaks and financial incentives.
Get More Information on Plastic To Fuel Market - Request Sample Report
Across the United States, a growing number of states are taking action to address plastic waste by implementing policies that promote the conversion of plastic waste into fuel. These initiatives are driven by a multi-pronged approach, aiming to tackle environmental concerns, bolster renewable energy sources, and create economic opportunities.
Moreover, the financial support helps to reduce the initial investment costs associated with these technologies, making them more commercially viable. Additionally, some states have established mandates for blending alternative fuels, including those derived from plastic waste, into the transportation fuel supply. These blending mandates create a guaranteed market for the fuel produced from plastic waste, further incentivizing investment in this sector. By implementing these supportive policies, U.S. states are playing a key role in fostering the growth of the plastic-to-fuel market and contributing to a more sustainable future.
Plastic to Fuel technology emerges as a game-changing solution, transforming plastic waste into valuable fuels. This not only alleviates the burden on overflowing landfills but also diverts plastic from environmentally harmful incinerators. Economic factors are also adding fuel to the fire of growth. As crude oil prices soar, alternative fuels derived from plastic become more economically sensible. This cost-reduction effect makes Plastic-to-Fuel a viable and attractive option. Finally, advancements in conversion technologies like pyrolysis and gasification are making plastic-to-fuel processes more efficient and cost-effective. This technological leap further propels the market forward.
In essence, the Plastic-to-Fuel market is propelled by a powerful combination of environmental concerns, economic benefits, supportive regulations, and cutting-edge technology. This is a market poised for a bright and affluent future.
Market Dynamics
Drivers
-
Rising energy requirements raise the demand for plastic to fuel technology.
The world's insatiable appetite for energy is another factor strengthening the flames of plastic-to-fuel market growth. Its ever-growing demand for power shows no signs of reduction, fueled by a booming global population, flourishing economies, and sprawling urban centers. This is where Plastic-to-Fuel technology emerges as a potential industry. It offers a revolutionary solution: transforming plastic waste into usable fuels like gasoline, diesel, or synthetic gas. By creating alternative sources of energy, Plastic-to-Fuel can help us combat the growing energy crisis, especially as traditional fossil fuels become scarcer and more expensive. In a nutshell, it's a double win, addressing both its growing energy demands and its overflowing landfills.
Restraint
-
Limited feedstock availability may hamper the growth of the market.
Plastic-to-Fuel technology is like a particular user with a specific menu. Not all plastic waste is created equal, and only certain types with a particular chemical are suitable for conversion into usable fuels. Even for these compatible plastics, getting the most out of the conversion process relies on a clean and well-sorted "plastic diet." Food scraps or mixed plastic types are unwanted ingredients that can disrupt the recipe. Further complicating matters, reliable large-scale collection and sorting systems for plastic waste might not be readily available in all regions. This limits the readily available high-quality "fuel feedstock" for plastic-to-fuel plants. In essence, the technology needs to broaden its appetite to accept a wider variety of plastics and develop a more robust waste collection and sorting infrastructure to truly flourish.
Opportunities
-
Energy Source diversification and increase the opportunity in the market.
The Plastic-to-Fuel market stands as an example of hope in their pursuit to diversify energy sources. It currently tethered to fossil fuels like oil and gas, a situation fraught with vulnerability. But Plastic-to-Fuel technology bursts onto the scene as a game-changer. It offers a transformative solution alchemy-like conversion of plastic waste into alternative fuels like gasoline, diesel, or synthetic gas. This not only stains its dependence on diminishing fossil fuel reserves but also injects a dose of security into the global energy landscape. By creating a new domestic source of energy, plastic-to-fuel can potentially sever the chains that bind us to foreign oil imports and the price swings that come with them. In essence, plastic-to-fuel offers a double victory a cleaner alternative to fossil fuels and a more stable energy future for nations worldwide.
Market Segmentation
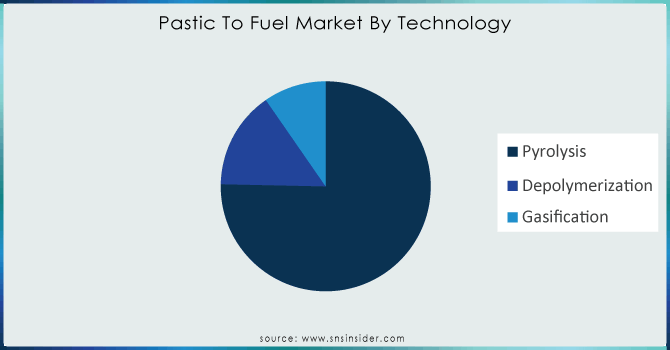
By Technology Type
The pyrolysis dominated the plastic to fuel Market with the highest revenue share of around 75.02% in 2023. Charcoal, biomass sources, and municipal solid waste are the commercial sources of plastic used to power pyrolysis. Although mixed plastics pyrolysis technology has been developed over the past 20 years, it is now becoming commercially viable due to the operation of several commercial plastic-to-fuel plants and the scheduled commissioning of numerous additional units over the next few years.
For example, Needa Green Energy Limited in Guntur, Andhra Pradesh, India, runs the world's first plastic-to-fuel facility, converting gasoline into reusable fuels like diesel and gasoline. Polybutylene, polyethylene, polystyrene, and PMMA (poly-methyl methacrylate), or acrylic glass, are among the plastics that can be pyrolyzed. Because of these plastic kinds, which can be used as a feedstock for fuel made from plastic.
Need any customization research on plastic to fuel market - Enquiry Now
By Plastic Type
Polyethylene dominated the plastic to fuel market with the highest revenue share of more than 35.11% in 2023. Polyethylene finds its application in consumer goods, food and beverage, and industrial packaging as a packaging material. The rising usage of polyethylene in packaging applications is anticipated to fuel demand for the material. Furthermore, it is anticipated that its use would increase dramatically in the production of other advanced polymers used in high-performance applications, such as extended polyethylene, polyethylene terephthalate, and high-density polyethylene.
By Source Type
The commercial & industrial waste dominated the plastic to fuel market with the highest revenue share of more than 61.40% in 2023. The United States is predicted to produce more plastic garbage due to the expanding hotel sector and the increased need for plastics from the medical industry. Governments all throughout the world were moving toward outlawing plastic bags and switching to reusable cloth or paper bags in place of single-use plastic products
Packaging, building and construction, textiles, consumer products, transportation, electrical and electronic, and machinery manufacturing are among the industries that utilize a lot of plastic. During the projected period, there is predicted to be a rise in the output of plastic waste from various industrial sources due to the increasing demand for consumer electronics, including dishwashers, washing machines, PCs/laptops, mobile phones, and portable gadgets, which are usually composed of 40% plastic.
By End Fuel
The crude oil segment held the highest revenue share of more than 59.25% in 2023. because crude oil is widely used in power generators, vehicles, tractors, cars, ships, boilers, and construction equipment. Over the course of the forecast period, the growing use of crude oil as fuel in key nations like the United States, China, Germany, and India which are known for having thriving automobile industries is anticipated to propel market growth.
In 2023, sulfur made up the second-largest portion. In comparison to its production from crude oil, low-sulfur diesel fuel made by pyrolyzing waste plastics has up to 14% lower greenhouse gas (GHG) intensity, according to a study released by Argonne National Laboratory. Plastic2Oil Inc., a US-based company, specialized in turning plastic into ultra-low sulfur fuel, which has a sulfur level of 15 ppm or below. This kind of fuel aids in reducing carbon emissions and aids in obtaining funds for pilot projects and technological development. In the upcoming years, these variables are expected to propel the sulfur production from plastic.
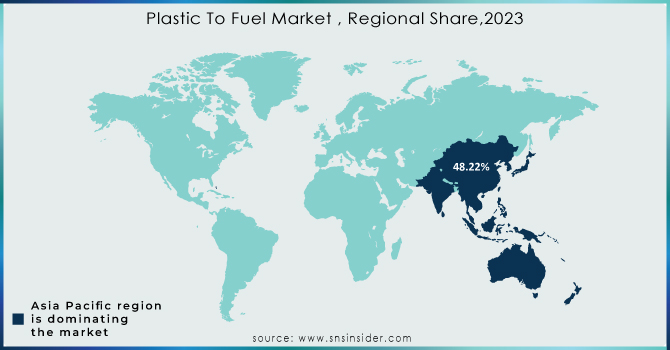
Regional Analysis
Asia Pacific led the plastic to fuel market with the highest revenue share of approx. 48.22% in 2023. It is anticipated that China, Japan, India, Singapore, Indonesia, and Vietnam will have the highest demand for plastic fuel. In the upcoming years, it is anticipated that this region's rapid industrialization and urbanization will stimulate market expansion. Positive laws and regulations that support the advancement of renewable energy technology are expected to accelerate industry expansion.
North America held the second largest share in the plastic to fuel market. Owing to growing amounts of household and industrial plastic garbage in North America have prompted governments to enact stringent laws prohibiting the disposal of solid waste in landfills in various areas of the continent. The region's waste is now being used to generate electricity thanks to increased municipal solid waste and stringent regulations from the regional governments.
Key Players
Alterra Energy, Neste, Plastic2oil, BRADAM Group, LLC, Agilyx Inc., Brightmark LLC, Klean Industries, Plastic Energy, Beston (Henan) Machinery Co. Ltd., Agilyx Inc., and Others.
Recent Development:
-
In July 2023, GAIL and Lanza Tech partnered to investigate the possibility of bio-recycling carbon waste into chemicals and fuels. The collaboration will support GAIL's net zero 2040 objectives, enabling extensive decarbonization applications across many geographical locations.
-
In June 2023 Lummus Technology and the MOL group have partnered to provide sophisticated waste plastic recycling services. The collaboration centers on the implementation and assimilation of chemical recycling within MOL's Slovakian and Hungarian plants.
| Report Attributes | Details |
|---|---|
| Market Size in 2023 | US$ 520.10 Million |
| Market Size by 2032 | US$ 4097.76 Million |
| CAGR | CAGR of 25.78 % From 2024 to 2032 |
| Base Year | 2023 |
| Forecast Period | 2024-2032 |
| Historical Data | 2020-2022 |
| Report Scope & Coverage | Market Size, Segments Analysis, Competitive Landscape, Regional Analysis, DROC & SWOT Analysis, Forecast Outlook |
| Key Segments | •By Technology Type (Pyrolysis, Depolymerization, and Gasification) •By Plastic Type (Polyethylene, Polyethylene Terephthalate, Polyvinyl Chloride, Polypropylene, Polystyrene, and Others) •By Source (Municipal Solid Waste, and Commercial & Industrial Waste) •By End Fuel (Sulfur, Hydrogen, Crude Oil, and Others) |
| Regional Analysis/Coverage | North America (US, Canada, Mexico), Europe (Eastern Europe [Poland, Romania, Hungary, Turkey, Rest of Eastern Europe] Western Europe] Germany, France, UK, Italy, Spain, Netherlands, Switzerland, Austria, Rest of Western Europe]), Asia Pacific (China, India, Japan, South Korea, Vietnam, Singapore, Australia, Rest of Asia Pacific), Middle East & Africa (Middle East [UAE, Egypt, Saudi Arabia, Qatar, Rest of Middle East], Africa [Nigeria, South Africa, Rest of Africa], Latin America (Brazil, Argentina, Colombia, Rest of Latin America) |
| Company Profiles | Alterra Energy, Neste, Plastic2oil, BRADAM Group, LLC, Agilyx Inc., Brightmark LLC, Klean Industries, Plastic Energy, Beston (Henan) Machinery Co. Ltd., Agilyx Inc., and Others. |
| Key Drivers | • Rising energy requirements raise the demand for plastic to fuel technology |
| RESTRAINTS | • Limited feedstock availability may hamper the growth of the market. |
