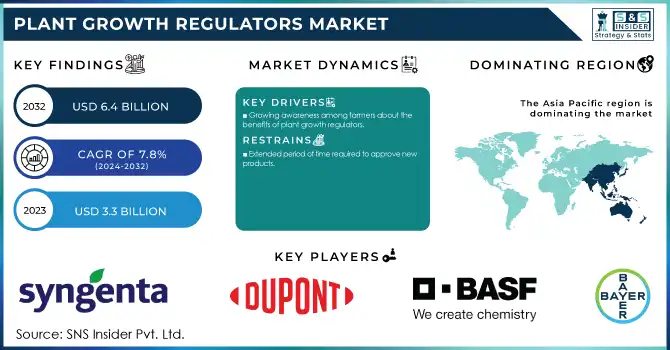
The plant growth regulators market size was valued at USD 3.29 billion in 2023 and is expected to reach USD 6.45 billion by 2032, growing at a CAGR of 7.77% over the forecast period of 2024-2032. The report provides a comprehensive analysis of production capacity and utilization by country, highlighting key manufacturing hubs and efficiency levels. It examines feedstock price trends across major regions, assessing cost fluctuations in raw materials. The report explores regulatory impacts on synthetic and bio-based plant growth regulators, focusing on policies from agencies like the EPA, EFSA, and ICAR. Additionally, it presents environmental metrics, including emissions data and sustainability initiatives in the industry. Innovation trends, particularly in bio-based formulations and nano-regulators, are analyzed alongside adoption rates in agriculture and horticulture, with a special focus on controlled environment agriculture.
Get E-PDF Sample Report on Plant Growth Regulators Market - Request Sample Report
Drivers
Increasing demand for high-quality crops drives market growth.
As consumers increasingly demand produce that is rich in nutrients, aesthetically pleasing, and free of pesticide residue, the use of plant growth regulators (PGRs) is gaining momentum, especially in high-value crops like fruits, vegetables, and cereals. These PGRs are very essential for getting better flowering, fruit set, root growth, and plant health, leading to better marketability and exportable quality. Moreover, amid rising challenges to global food security, growth regulators are also advocated by governments and agronomic institutions to enhance productivity with sustainable crop practices. Further, rising demand for bio-based and residue-free PGRs due to the increasing replacement of controlled environment agriculture, hydroponics, and organic will boost the industry trend.
Restraint
High costs associated with plant growth regulators may hamper the market growth.
The high costs of plant growth regulators (PGRs) are one of the major hindrances to the market growth of PGRs; however, it has a considerable impact on small and medium-scale farmers aiming to operate on a very low budget. High costs associated with PGRs can make them inaccessible for some farmers, resulting in low adoption rates and consequently market demand. Also, the stringent regulatory frameworks surrounding PGR approval and use also lead to higher costs and longer timelines for new products. In such cases, it has been observed that these factors inhibit the wider adoption of PGRs, despite enhancing crop yield and quality potential.
Opportunities
Increasing adoption of precision agriculture techniques creates an opportunity for the market.
Agriculture is gaining importance as it benefits growers by reducing costs, enhancing efficiency, maximizing yield, saving time, and minimizing chemicals and resource consumption. Technologies such as GPS, remote sensing, and data analytics advance precision agriculture, which allows for the application of inputs such as PGRs more efficiently. According to the time when the plants need the treatment with plant growth regulators (PGRs); this method optimizes crop yield and quality, minimizes wastage, and reduces the environmental burden. High-growth rates of organic and bulk agricultural input sales in Asia have increased the dependence of farmers on the usage of precision farming techniques to farm crops with higher efficiency and sustainability and hence maintain the growth stimulation for specialized PGRs implementing precision farming technologies more appealing to farmers, which, directly or indirectly, will expand the market development for these products.
Challenges
Presence of low-quality and counterfeit products in the market.
The prevalence of adulterated and duplicative plant growth regulators (PGRs) is one of the widespread problems faced by the agriculture fraternity. Farmers using these polluted products often suffer from reduced crop yield, diseases in plants, and soil depletion issues. Such consequences not only result in monetary loss to Punjab farmers but also destroy their confidence in agricultural inputs further growing reluctance to pay for true PGRs in the future. Additionally, counterfeit PGRs can also be found with untested or dangerous contents, which can threaten both human and environmental health. The entry of these false products into the market also affects genuine manufacturers' credibility as well as the supply chain and eventually impedes the growth and sustainability of the PGR market as a whole.
By Material Type
Cytokinin held the largest market share around 42% in 2023. They are widely favorable among the farmers due to their important role in increasing the crop yield, and quality of fruits and vegetables and improving the plant resistance against environmental stress. The increased adoption of high-yield crops and the high need for better seed germination and root growth have provided an additional boost to the market with the use of cytokinins (particularly in cereals, pulses, and fruits). Moreover, innovations in biotechnological compositions and the growing transition to bio-based plant growth regulators have swayed the power in favor of cytokinin in the market. Another reason that has been responsible for their significant market share is the widespread use of these products in tissue culture applications and controlled environment agriculture which includes hydroponics and vertical farming.
By Crop Type
The Cereals & Grains segment held the largest market share around 34% in 2023. With population pressing and the food security quest becoming more pivotal, plant growth regulators (PGRs) are being widely utilized by farmers to increase crop yield, better stress toleration, and finally germination and maturation cycles. To obtain high productivity, cereals and grains need optimal conditions of growth; and PGRs (plant growth regulators), especially cytokinins and gibberellins, are vital for grain quality, seed development, and well-being of plants. Moreover, the use of PGRs in this segment has been further boosted by government initiatives and agricultural subsidies that are promoting sustainable farming. Cereals & grains also continue to lead the way in the market with the rising popularity of precision farming techniques and controlled environment agriculture.
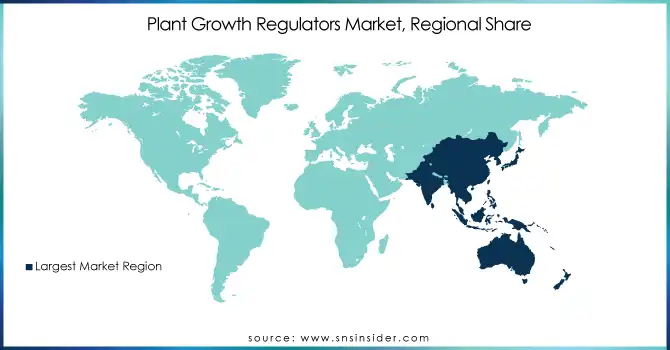
Asia Pacific held the largest market share around 42% in 2023. The region has been witnessing expansion in the agricultural sector over the last few years along with adoption of crop production on a large scale and the local population, adopting modern agriculture techniques. Plant Growth Regulators Market Research Report is a professional and in-depth study on the existing state of the Plant Growth Regulators Market Plant Growth Regulators market in the Asia-Pacific region is growing at a rapid pace driven by countries such as China, India in addition to Indonesia, which are amongst the major growers of rice, wheat, and other staple crops, which subsequently is generating huge demand for increase yield & quality of yield boosting the consumption of PGRs. Moreover, increasing worries about food security, a robust population, and government support for sustainable agriculture have further expedited the implementation of PGR. Apart from this, the region is undergoing developmental initiatives towards bio-based plant growth regulators, which is mainly fueled by supportive environmental regulations and growing consciousness over organic farming.
North America region is projected to witness the fastest growth rate in forecast period 2024- 2032. Federal policies in the United States have created a conducive climate for innovation and investment in the agricultural sector and stimulated plant growth regulator development and adoption. In addition to this, few key vendors of plant growth regulators exist in the U.S. This has resulted in these companies making significant investments in the development of innovative products and technologies. The powerful protection of intellectual property rights and well-established distribution networks that exist in the United States has also bolstered US dominance in this sector, as domestic films get the greatest support from these conditions. A crucial issue is the sustainable agriculture practices of the US. The nation has taken the lead in sustainable farming methods, including environmental protection agents, and plant growth regulator agrochemicals. These inputs help farmers to rely less on harmful chemical inputs, reduce environmental footprints, and improve resource use efficiency.
Get Customized Report as Per Your Business Requirement - Request For Customized Report
Bayer AG (ProGibb, Ethrel)
BASF SE (Regalis Plus, Smartblock)
DuPont (Agris-Fos, Fontelis)
DSM (Maxi-Grow, Ripener)
Nestlé (Nutrigrow, BioStim)
Biosynth Carbosynth (Gibberellin A3, Zeatin)
Syngenta AG (Primo Maxx, Moddus)
Nufarm Ltd. (B-Nine, Cytoplex)
Corteva, Inc. (RyzUp, N-Large)
UPL Limited (Surplus, Stomp)
Tata Chemicals Ltd. (Grow-One, StimRich)
Sumitomo Chemical Co. Ltd. (Promalin, SumiGro)
FMC Corporation (Accede, Pix)
Sichuan Guoguang Agrochemical Co., Ltd. (Guoguang GA3, Green-Up)
Dextra Laboratories (Indole-3-Butyric Acid, 6-Benzylaminopurine)
Arysta LifeScience (Apogee, Regulex)
Fine Americas, Inc. (Perlan, Novagib)
Valent BioSciences (ProTone, ReTain)
Xinyi Industrial Co., Ltd. (Xinyi GA4, Xinyi KT-30)
Redox Industries Limited (BioGro, StimPlus)
In August 2023, Bayer invested USD 238.1 million in a new R&D facility at its Monheim site. The facility aims to develop the next generation of crop protection chemicals. This initiative enhances Bayer’s innovation in sustainable agriculture solutions.
In March 2023, Sumitomo Chemical India Ltd. launched Promalin, a plant growth regulator, in India. The product aims to enhance fruit quality, size, and yield in orchards. This launch strengthens Sumitomo’s presence in the Indian agricultural market.
Report Attributes | Details |
---|---|
Market Size in 2023 |
USD 3.29 Billion |
Market Size by 2032 |
USD 6.45 Billion |
CAGR |
CAGR of 7.77% From 2024 to 2032 |
Base Year |
2023 |
Forecast Period |
2024-2032 |
Historical Data |
2020-2022 |
Report Scope & Coverage |
Market Size, Segments Analysis, Competitive Landscape, Regional Analysis, DROC & SWOT Analysis, Forecast Outlook |
Key Segments |
• By Type (Cytokinin, Gibberellins, Auxins, Ethylene, and Others) |
Regional Analysis/Coverage |
North America (US, Canada, Mexico), Europe (Eastern Europe [Poland, Romania, Hungary, Turkey, Rest of Eastern Europe] Western Europe] Germany, France, UK, Italy, Spain, Netherlands, Switzerland, Austria, Rest of Western Europe]), Asia Pacific (China, India, Japan, South Korea, Vietnam, Singapore, Australia, Rest of Asia Pacific), Middle East & Africa (Middle East [UAE, Egypt, Saudi Arabia, Qatar, Rest of Middle East], Africa [Nigeria, South Africa, Rest of Africa], Latin America (Brazil, Argentina, Colombia, Rest of Latin America) |
Company Profiles |
|
Ans: The Plant Growth Regulators Market was valued at USD 3.29 Billion in 2023.
Ans: The expected CAGR of the global Plant Growth Regulators Market during the forecast period is 7.77%.
Ans: The Cereals & Grains will grow rapidly in the Plant Growth Regulators Market from 2024-2032.
Ans: Increasing demand for high-quality crops drives market growth.
Ans: The Asia Pacific led the Plant Growth Regulators Market in the region with the highest revenue share in 2023.
1. Introduction
1.1 Market Definition
1.2 Scope (Inclusion and Exclusions)
1.3 Research Assumptions
2. Executive Summary
2.1 Market Overview
2.2 Regional Synopsis
2.3 Competitive Summary
3. Research Methodology
3.1 Top-Down Approach
3.2 Bottom-up Approach
3.3. Data Validation
3.4 Primary Interviews
4. Market Dynamics Impact Analysis
3.1 Market Driving Factors Analysis
3.1.2 Drivers
3.1.2 Restraints
3.1.3 Opportunities
3.1.4 Challenges
3.2 PESTLE Analysis
3.3 Porter’s Five Forces Model
5. Statistical Insights and Trends Reporting
5.1 Production Capacity and Utilization, by Country, By Type, 2023
5.2 Feedstock Prices, by Country, By Type, 2023
5.3 Regulatory Impact, by Country, By Type 2023.
5.4 Environmental Metrics: Emissions Data, Waste Management Practices, and Sustainability Initiatives, by Region
5.5 Innovation and R&D, Type, 2023
6. Competitive Landscape
6.1 List of Major Companies, By Region
6.2 Market Share Analysis, By Region
6.3 Product Benchmarking
6.3.1 Product specifications and features
6.3.2 Pricing
6.4 Strategic Initiatives
6.4.1 Marketing and promotional activities
6.4.2 Distribution and Supply Chain Strategies
6.4.3 Expansion Plans and New Product Launches
6.4.4 Strategic partnerships and collaborations
6.5 Technological Advancements
6.6 Market Positioning and Branding
7. Plant Growth Regulators Market Segmentation, By Type
7.1 Chapter Overview
7.2 Cytokinin
7.2.1 Cytokinin Trends Analysis (2020-2032)
7.2.2 Cytokinin Market Size Estimates and Forecasts to 2032 (USD Billion)
7.3 Gibberellins
7.3.1 Gibberellins Market Trends Analysis (2020-2032)
7.3.2 Gibberellins Market Size Estimates and Forecasts to 2032 (USD Billion)
7.4 Auxins
7.4.1 Auxins Trends Analysis (2020-2032)
7.4.2 Auxins Market Size Estimates and Forecasts to 2032 (USD Billion)
7.5 Ethylene
7.5.1 Ethylene Market Trends Analysis (2020-2032)
7.5.2 Ethylene Market Size Estimates and Forecasts to 2032 (USD Billion)
7.6 Others
7.6.1 Others Trends Analysis (2020-2032)
7.6.2 Others Market Size Estimates and Forecasts to 2032 (USD Billion)
8. Plant Growth Regulators Market Segmentation, by Crop Type
8.1 Chapter Overview
8.2 Cereals & Grains
8.2.1 Cereals & Grains Market Trends Analysis (2020-2032)
8.2.2 Cereals & Grains Market Size Estimates and Forecasts to 2032 (USD Billion)
8.3 Fruits & Vegetables
8.3.1 Fruits & Vegetables Market Trends Analysis (2020-2032)
8.3.2 Fruits & Vegetables Market Size Estimates and Forecasts to 2032 (USD Billion)
8.4 Oilseeds & Pulses
8.4.1 Oilseeds & Pulses Market Trends Analysis (2020-2032)
8.4.2 Oilseeds & Pulses Market Size Estimates and Forecasts to 2032 (USD Billion)
8.5 Turf & Ornamentals
8.5.1 Turf & Ornamentals Market Trends Analysis (2020-2032)
8.5.2 Turf & Ornamentals Market Size Estimates and Forecasts to 2032 (USD Billion)
8.6 Others
8.6.1 Others Market Trends Analysis (2020-2032)
8.6.2 Others Market Size Estimates and Forecasts to 2032 (USD Billion)
9. Regional Analysis
9.1 Chapter Overview
9.2 North America
9.2.1 Trends Analysis
9.2.2 North America Plant Growth Regulators Market Estimates and Forecasts, by Country (2020-2032) (USD Billion)
9.2.3 North America Plant Growth Regulators Market Estimates and Forecasts, By Type (2020-2032) (USD Billion)
9.2.4 North America Plant Growth Regulators Market Estimates and Forecasts, by Crop Type (2020-2032) (USD Billion)
9.2.5 USA
9.2.5.1 USA Plant Growth Regulators Market Estimates and Forecasts, By Type (2020-2032) (USD Billion)
9.2.5.2 USA Plant Growth Regulators Market Estimates and Forecasts, by Crop Type (2020-2032) (USD Billion)
9.2.6 Canada
9.2.6.1 Canada Plant Growth Regulators Market Estimates and Forecasts, By Type (2020-2032) (USD Billion)
9.2.6.2 Canada Plant Growth Regulators Market Estimates and Forecasts, by Crop Type (2020-2032) (USD Billion)
9.2.7 Mexico
9.2.7.1 Mexico Plant Growth Regulators Market Estimates and Forecasts, By Type (2020-2032) (USD Billion)
9.2.7.2 Mexico Plant Growth Regulators Market Estimates and Forecasts, by Crop Type (2020-2032) (USD Billion)
9.3 Europe
9.3.1 Eastern Europe
9.3.1.1 Trends Analysis
9.3.1.2 Eastern Europe Plant Growth Regulators Market Estimates and Forecasts, by Country (2020-2032) (USD Billion)
9.3.1.3 Eastern Europe Plant Growth Regulators Market Estimates and Forecasts, By Type (2020-2032) (USD Billion)
9.3.1.4 Eastern Europe Plant Growth Regulators Market Estimates and Forecasts, by Crop Type (2020-2032) (USD Billion)
9.3.1.5 Poland
9.3.1.5.1 Poland Plant Growth Regulators Market Estimates and Forecasts, By Type (2020-2032) (USD Billion)
9.3.1.5.2 Poland Plant Growth Regulators Market Estimates and Forecasts, by Crop Type (2020-2032) (USD Billion)
9.3.1.6 Romania
9.3.1.6.1 Romania Plant Growth Regulators Market Estimates and Forecasts, By Type (2020-2032) (USD Billion)
9.3.1.6.2 Romania Plant Growth Regulators Market Estimates and Forecasts, by Crop Type (2020-2032) (USD Billion)
9.3.1.7 Hungary
9.3.1.7.1 Hungary Plant Growth Regulators Market Estimates and Forecasts, By Type (2020-2032) (USD Billion)
9.3.1.7.2 Hungary Plant Growth Regulators Market Estimates and Forecasts, by Crop Type (2020-2032) (USD Billion)
9.3.1.8 Turkey
9.3.1.8.1 Turkey Plant Growth Regulators Market Estimates and Forecasts, By Type (2020-2032) (USD Billion)
9.3.1.8.2 Turkey Plant Growth Regulators Market Estimates and Forecasts, by Crop Type (2020-2032) (USD Billion)
9.3.1.9 Rest of Eastern Europe
9.3.1.9.1 Rest of Eastern Europe Plant Growth Regulators Market Estimates and Forecasts, By Type (2020-2032) (USD Billion)
9.3.1.9.2 Rest of Eastern Europe Plant Growth Regulators Market Estimates and Forecasts, by Crop Type (2020-2032) (USD Billion)
9.3.2 Western Europe
9.3.2.1 Trends Analysis
9.3.2.2 Western Europe Plant Growth Regulators Market Estimates and Forecasts, by Country (2020-2032) (USD Billion)
9.3.2.3 Western Europe Plant Growth Regulators Market Estimates and Forecasts, By Type (2020-2032) (USD Billion)
9.3.2.4 Western Europe Plant Growth Regulators Market Estimates and Forecasts, by Crop Type (2020-2032) (USD Billion)
9.3.2.5 Germany
9.3.2.5.1 Germany Plant Growth Regulators Market Estimates and Forecasts, By Type (2020-2032) (USD Billion)
9.3.2.5.2 Germany Plant Growth Regulators Market Estimates and Forecasts, by Crop Type (2020-2032) (USD Billion)
9.3.2.6 France
9.3.2.6.1 France Plant Growth Regulators Market Estimates and Forecasts, By Type (2020-2032) (USD Billion)
9.3.2.6.2 France Plant Growth Regulators Market Estimates and Forecasts, by Crop Type (2020-2032) (USD Billion)
9.3.2.7 UK
9.3.2.7.1 UK Plant Growth Regulators Market Estimates and Forecasts, By Type (2020-2032) (USD Billion)
9.3.2.7.2 UK Plant Growth Regulators Market Estimates and Forecasts, by Crop Type (2020-2032) (USD Billion)
9.3.2.8 Italy
9.3.2.8.1 Italy Plant Growth Regulators Market Estimates and Forecasts, By Type (2020-2032) (USD Billion)
9.3.2.8.2 Italy Plant Growth Regulators Market Estimates and Forecasts, by Crop Type (2020-2032) (USD Billion)
9.3.2.9 Spain
9.3.2.9.1 Spain Plant Growth Regulators Market Estimates and Forecasts, By Type (2020-2032) (USD Billion)
9.3.2.9.2 Spain Plant Growth Regulators Market Estimates and Forecasts, by Crop Type (2020-2032) (USD Billion)
9.3.2.10 Netherlands
9.3.2.10.1 Netherlands Plant Growth Regulators Market Estimates and Forecasts, By Type (2020-2032) (USD Billion)
9.3.2.10.2 Netherlands Plant Growth Regulators Market Estimates and Forecasts, by Crop Type (2020-2032) (USD Billion)
9.3.2.11 Switzerland
9.3.2.11.1 Switzerland Plant Growth Regulators Market Estimates and Forecasts, By Type (2020-2032) (USD Billion)
9.3.2.11.2 Switzerland Plant Growth Regulators Market Estimates and Forecasts, by Crop Type (2020-2032) (USD Billion)
9.3.2.12 Austria
9.3.2.12.1 Austria Plant Growth Regulators Market Estimates and Forecasts, By Type (2020-2032) (USD Billion)
9.3.2.12.2 Austria Plant Growth Regulators Market Estimates and Forecasts, by Crop Type (2020-2032) (USD Billion)
9.3.2.13 Rest of Western Europe
9.3.2.13.1 Rest of Western Europe Plant Growth Regulators Market Estimates and Forecasts, By Type (2020-2032) (USD Billion)
9.3.2.13.2 Rest of Western Europe Plant Growth Regulators Market Estimates and Forecasts, by Crop Type (2020-2032) (USD Billion)
9.4 Asia Pacific
9.4.1 Trends Analysis
9.4.2 Asia Pacific Plant Growth Regulators Market Estimates and Forecasts, by Country (2020-2032) (USD Billion)
9.4.3 Asia Pacific Plant Growth Regulators Market Estimates and Forecasts, By Type (2020-2032) (USD Billion)
9.4.4 Asia Pacific Plant Growth Regulators Market Estimates and Forecasts, by Crop Type (2020-2032) (USD Billion)
9.4.5 China
9.4.5.1 China Plant Growth Regulators Market Estimates and Forecasts, By Type (2020-2032) (USD Billion)
9.4.5.2 China Plant Growth Regulators Market Estimates and Forecasts, by Crop Type (2020-2032) (USD Billion)
9.4.6 India
9.4.5.1 India Plant Growth Regulators Market Estimates and Forecasts, By Type (2020-2032) (USD Billion)
9.4.5.2 India Plant Growth Regulators Market Estimates and Forecasts, by Crop Type (2020-2032) (USD Billion)
9.4.5 Japan
9.4.5.1 Japan Plant Growth Regulators Market Estimates and Forecasts, By Type (2020-2032) (USD Billion)
9.4.5.2 Japan Plant Growth Regulators Market Estimates and Forecasts, by Crop Type (2020-2032) (USD Billion)
9.4.6 South Korea
9.4.6.1 South Korea Plant Growth Regulators Market Estimates and Forecasts, By Type (2020-2032) (USD Billion)
9.4.6.2 South Korea Plant Growth Regulators Market Estimates and Forecasts, by Crop Type (2020-2032) (USD Billion)
9.4.7 Vietnam
9.4.7.1 Vietnam Plant Growth Regulators Market Estimates and Forecasts, By Type (2020-2032) (USD Billion)
9.2.7.2 Vietnam Plant Growth Regulators Market Estimates and Forecasts, by Crop Type (2020-2032) (USD Billion)
9.4.8 Singapore
9.4.8.1 Singapore Plant Growth Regulators Market Estimates and Forecasts, By Type (2020-2032) (USD Billion)
9.4.8.2 Singapore Plant Growth Regulators Market Estimates and Forecasts, by Crop Type (2020-2032) (USD Billion)
9.4.9 Australia
9.4.9.1 Australia Plant Growth Regulators Market Estimates and Forecasts, By Type (2020-2032) (USD Billion)
9.4.9.2 Australia Plant Growth Regulators Market Estimates and Forecasts, by Crop Type (2020-2032) (USD Billion)
9.4.10 Rest of Asia Pacific
9.4.10.1 Rest of Asia Pacific Plant Growth Regulators Market Estimates and Forecasts, By Type (2020-2032) (USD Billion)
9.4.10.2 Rest of Asia Pacific Plant Growth Regulators Market Estimates and Forecasts, by Crop Type (2020-2032) (USD Billion)
9.5 Middle East and Africa
9.5.1 Middle East
9.5.1.1 Trends Analysis
9.5.1.2 Middle East Plant Growth Regulators Market Estimates and Forecasts, by Country (2020-2032) (USD Billion)
9.5.1.3 Middle East Plant Growth Regulators Market Estimates and Forecasts, By Type (2020-2032) (USD Billion)
9.5.1.4 Middle East Plant Growth Regulators Market Estimates and Forecasts, by Crop Type (2020-2032) (USD Billion)
9.5.1.5 UAE
9.5.1.5.1 UAE Plant Growth Regulators Market Estimates and Forecasts, By Type (2020-2032) (USD Billion)
9.5.1.5.2 UAE Plant Growth Regulators Market Estimates and Forecasts, by Crop Type (2020-2032) (USD Billion)
9.5.1.6 Egypt
9.5.1.6.1 Egypt Plant Growth Regulators Market Estimates and Forecasts, By Type (2020-2032) (USD Billion)
9.5.1.6.2 Egypt Plant Growth Regulators Market Estimates and Forecasts, by Crop Type (2020-2032) (USD Billion)
9.5.1.7 Saudi Arabia
9.5.1.7.1 Saudi Arabia Plant Growth Regulators Market Estimates and Forecasts, By Type (2020-2032) (USD Billion)
9.5.1.7.2 Saudi Arabia Plant Growth Regulators Market Estimates and Forecasts, by Crop Type (2020-2032) (USD Billion)
9.5.1.8 Qatar
9.5.1.8.1 Qatar Plant Growth Regulators Market Estimates and Forecasts, By Type (2020-2032) (USD Billion)
9.5.1.8.2 Qatar Plant Growth Regulators Market Estimates and Forecasts, by Crop Type (2020-2032) (USD Billion)
9.5.1.9 Rest of Middle East
9.5.1.9.1 Rest of Middle East Plant Growth Regulators Market Estimates and Forecasts, By Type (2020-2032) (USD Billion)
9.5.1.9.2 Rest of Middle East Plant Growth Regulators Market Estimates and Forecasts, by Crop Type (2020-2032) (USD Billion)
9.5.2 Africa
9.5.2.1 Trends Analysis
9.5.2.2 Africa Plant Growth Regulators Market Estimates and Forecasts, by Country (2020-2032) (USD Billion)
9.5.2.3 Africa Plant Growth Regulators Market Estimates and Forecasts, By Type (2020-2032) (USD Billion)
9.5.2.4 Africa Plant Growth Regulators Market Estimates and Forecasts, by Crop Type (2020-2032) (USD Billion)
9.5.2.5 South Africa
9.5.2.5.1 South Africa Plant Growth Regulators Market Estimates and Forecasts, By Type (2020-2032) (USD Billion)
9.5.2.5.2 South Africa Plant Growth Regulators Market Estimates and Forecasts, by Crop Type (2020-2032) (USD Billion)
9.5.2.6 Nigeria
9.5.2.6.1 Nigeria Plant Growth Regulators Market Estimates and Forecasts, By Type (2020-2032) (USD Billion)
9.5.2.6.2 Nigeria Plant Growth Regulators Market Estimates and Forecasts, by Crop Type (2020-2032) (USD Billion)
9.6 Latin America
9.6.1 Trends Analysis
9.6.2 Latin America Plant Growth Regulators Market Estimates and Forecasts, by Country (2020-2032) (USD Billion)
9.6.3 Latin America Plant Growth Regulators Market Estimates and Forecasts, By Type (2020-2032) (USD Billion)
9.6.4 Latin America Plant Growth Regulators Market Estimates and Forecasts, by Crop Type (2020-2032) (USD Billion)
9.6.5 Brazil
9.6.5.1 Brazil Plant Growth Regulators Market Estimates and Forecasts, By Type (2020-2032) (USD Billion)
9.6.5.2 Brazil Plant Growth Regulators Market Estimates and Forecasts, by Crop Type (2020-2032) (USD Billion)
9.6.6 Argentina
9.6.6.1 Argentina Plant Growth Regulators Market Estimates and Forecasts, By Type (2020-2032) (USD Billion)
9.6.6.2 Argentina Plant Growth Regulators Market Estimates and Forecasts, by Crop Type (2020-2032) (USD Billion)
9.6.7 Colombia
9.6.7.1 Colombia Plant Growth Regulators Market Estimates and Forecasts, By Type (2020-2032) (USD Billion)
9.6.7.2 Colombia Plant Growth Regulators Market Estimates and Forecasts, by Crop Type (2020-2032) (USD Billion)
9.6.8 Rest of Latin America
9.6.8.1 Rest of Latin America Plant Growth Regulators Market Estimates and Forecasts, By Type (2020-2032) (USD Billion)
9.6.8.2 Rest of Latin America Plant Growth Regulators Market Estimates and Forecasts, by Crop Type (2020-2032) (USD Billion)
10. Company Profiles
10.1 Bayer AG
10.1.1 Company Overview
10.1.2 Financial
10.1.3 Product / Services Offered
10.1.4 SWOT Analysis
10.2 BASF SE
10.2.1 Company Overview
10.2.2 Financial
10.2.3 Product/ Services Offered
10.2.4 SWOT Analysis
10.3 DuPont
10.3.1 Company Overview
10.3.2 Financial
10.3.3 Product/ Services Offered
10.3.4 SWOT Analysis
10.4 DSM
10.4.1 Company Overview
10.4.2 Financial
10.4.3 Product/ Services Offered
10.4.4 SWOT Analysis
10.5 Nestle
10.5.1 Company Overview
10.5.2 Financial
10.5.3 Product/ Services Offered
10.5.4 SWOT Analysis
10.6 Biosynth Carbosynth
10.6.1 Company Overview
10.6.2 Financial
10.6.3 Product/ Services Offered
10.6.4 SWOT Analysis
10.7 Syngenta AG
10.7.1 Company Overview
10.7.2 Financial
10.7.3 Product/ Services Offered
10.7.4 SWOT Analysis
10.8 Nufarm Ltd.
10.8.1 Company Overview
10.8.2 Financial
10.8.3 Product/ Services Offered
10.8.4 SWOT Analysis
10.9 Corteva, Inc.
10.9.1 Company Overview
10.9.2 Financial
10.9.3 Product/ Services Offered
10.9.4 SWOT Analysis
10.10 UPL Limited
10.10.1 Company Overview
10.10.2 Financial
10.10.3 Product/ Services Offered
10.10.4 SWOT Analysis
11. Use Cases and Best Practices
12. Conclusion
An accurate research report requires proper strategizing as well as implementation. There are multiple factors involved in the completion of good and accurate research report and selecting the best methodology to compete the research is the toughest part. Since the research reports we provide play a crucial role in any company’s decision-making process, therefore we at SNS Insider always believe that we should choose the best method which gives us results closer to reality. This allows us to reach at a stage wherein we can provide our clients best and accurate investment to output ratio.
Each report that we prepare takes a timeframe of 350-400 business hours for production. Starting from the selection of titles through a couple of in-depth brain storming session to the final QC process before uploading our titles on our website we dedicate around 350 working hours. The titles are selected based on their current market cap and the foreseen CAGR and growth.
The 5 steps process:
Step 1: Secondary Research:
Secondary Research or Desk Research is as the name suggests is a research process wherein, we collect data through the readily available information. In this process we use various paid and unpaid databases which our team has access to and gather data through the same. This includes examining of listed companies’ annual reports, Journals, SEC filling etc. Apart from this our team has access to various associations across the globe across different industries. Lastly, we have exchange relationships with various university as well as individual libraries.
Step 2: Primary Research
When we talk about primary research, it is a type of study in which the researchers collect relevant data samples directly, rather than relying on previously collected data. This type of research is focused on gaining content specific facts that can be sued to solve specific problems. Since the collected data is fresh and first hand therefore it makes the study more accurate and genuine.
We at SNS Insider have divided Primary Research into 2 parts.
Part 1 wherein we interview the KOLs of major players as well as the upcoming ones across various geographic regions. This allows us to have their view over the market scenario and acts as an important tool to come closer to the accurate market numbers. As many as 45 paid and unpaid primary interviews are taken from both the demand and supply side of the industry to make sure we land at an accurate judgement and analysis of the market.
This step involves the triangulation of data wherein our team analyses the interview transcripts, online survey responses and observation of on filed participants. The below mentioned chart should give a better understanding of the part 1 of the primary interview.
Part 2: In this part of primary research the data collected via secondary research and the part 1 of the primary research is validated with the interviews from individual consultants and subject matter experts.
Consultants are those set of people who have at least 12 years of experience and expertise within the industry whereas Subject Matter Experts are those with at least 15 years of experience behind their back within the same space. The data with the help of two main processes i.e., FGDs (Focused Group Discussions) and IDs (Individual Discussions). This gives us a 3rd party nonbiased primary view of the market scenario making it a more dependable one while collation of the data pointers.
Step 3: Data Bank Validation
Once all the information is collected via primary and secondary sources, we run that information for data validation. At our intelligence centre our research heads track a lot of information related to the market which includes the quarterly reports, the daily stock prices, and other relevant information. Our data bank server gets updated every fortnight and that is how the information which we collected using our primary and secondary information is revalidated in real time.
Step 4: QA/QC Process
After all the data collection and validation our team does a final level of quality check and quality assurance to get rid of any unwanted or undesired mistakes. This might include but not limited to getting rid of the any typos, duplication of numbers or missing of any important information. The people involved in this process include technical content writers, research heads and graphics people. Once this process is completed the title gets uploader on our platform for our clients to read it.
Step 5: Final QC/QA Process:
This is the last process and comes when the client has ordered the study. In this process a final QA/QC is done before the study is emailed to the client. Since we believe in giving our clients a good experience of our research studies, therefore, to make sure that we do not lack at our end in any way humanly possible we do a final round of quality check and then dispatch the study to the client.
By Type
Cytokinin
Gibberellins
Auxins
Ethylene
Others
By Crop Type
Cereals & Grains
Fruits & Vegetables
Oilseeds & Pulses
Turf & Ornamentals
Others
Request for Segment Customization as per your Business Requirement: Segment Customization Request
Regional Coverage:
North America
US
Canada
Mexico
Europe
Eastern Europe
Poland
Romania
Hungary
Turkey
Rest of Eastern Europe
Western Europe
Germany
France
UK
Italy
Spain
Netherlands
Switzerland
Austria
Rest of Western Europe
Asia Pacific
China
India
Japan
South Korea
Vietnam
Singapore
Australia
Rest of Asia Pacific
Middle East & Africa
Middle East
UAE
Egypt
Saudi Arabia
Qatar
Rest of Middle East
Africa
Nigeria
South Africa
Rest of Africa
Latin America
Brazil
Argentina
Colombia
Rest of Latin America
Request for Country Level Research Report: Country Level Customization Request
Available Customization
With the given market data, SNS Insider offers customization as per the company’s specific needs. The following customization options are available for the report:
Product Analysis
Criss-Cross segment analysis (e.g. Product X Application)
Product Matrix which gives a detailed comparison of the product portfolio of each company
Geographic Analysis
Additional countries in any of the regions
Company Information
Detailed analysis and profiling of additional market players (Up to five)
The Multi-Layer Cryogenic Insulation Market size was valued at USD 1114.6 Million in 2023 and is expected to reach USD 1981.22 Million by 2032, growing at a CAGR of 6.60% over the forecast period 2024-2032.
The Liquid Ring Vacuum Pumps Market Size was USD 1.5 billion in 2023 and is expected to reach USD 2.4 Bn by 2032 and grow at a CAGR of 5.3% by 2024-2032.
The Lithium Mining Market size was valued at USD 11 billion in 2023 and is expected to reach USD 17.9 by 2032 at a CAGR of 5.56% during the forecast period of 2024-2032.
Electronic Materials and Chemicals Market Size was valued at USD 64.1 billion in 2023 and is expected to reach USD 110.2 billion by 2032 and grow at a CAGR of 6.2% over the forecast period 2024-2032.
The Crude Sulfate Turpentine (CST) market is a critical segment within the global chemicals industry, with wide-ranging applications across sectors such as fragrances, pharmaceuticals, and paints.
The Bitumen Market size was valued at USD 55.9 Billion in 2023. It is expected to grow to USD 76.6 Billion by 2032 and grow at a CAGR of 3.6% by 2024-2032.
Hi! Click one of our member below to chat on Phone