Get more information on Plant Genotyping Equipment Market - Request Free Sample Report
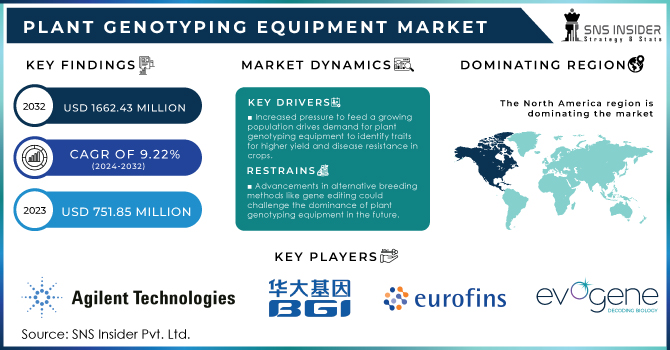
The Plant Genotyping Equipment Market was valued at USD 751.85 Million in 2023, and it is expected to reach USD 1662.43 Million by 2032, registering a CAGR 9.22% of during the period of 2024-2032.
Agricultural demand is increasing daily as the human population grows. There is a growing need to produce high yielding crops to ensure global food security for the human population. According to United Nations, Over the next 30 years, the global population is projected to grow by almost 2 billion people, reaching 9.7 billion in 2050 and possibly reaching a peak of nearly 10.4 billion in the mid-2080s. One factor conducive to achieving this is to monitor and enhance the tolerance and adaptative capacities of plants grown in or exposed to diverse stressful environments. Characterization of complex plant traits is vital in this context since it triggers an understanding of the environmental factors related to the trait and the corresponding locus about the various genetic mechanisms.
Some important agronomic traits, such as production, tolerance, adaptation, or resistance against the abiotic and biotic stress, are relevant choices to understand the interaction between genotypes and an environment. Thus, understanding the behavior of a certain genotype that is subjected to a given environment is highly vital to the sustainable production of crops and stability. This is, in fact, one of the most influential and legitimate scientific areas of study in plant biology for growing plant varieties that are capable of producing at rates potentially twice that of their ancestors or the existing levels and produce value to those connected with the agricultural industries.
The generation of sequence data from Next-Generation Sequencing technologies facilitates an order of magnitude rise in the rate of discovery of polymorphisms since Sequence Characterized Amplified Region markers were initially developed. The process can be sequenced massively. The application of SNPs is the most preferred choice in polymorphism discovery, and an increase in polymorphic marker resources will eventually build up high-throughput genotyping examines.
DRIVERS
Increased pressure to feed a growing population drives demand for plant genotyping equipment to identify traits for higher yield and disease resistance in crops.
Rapid population growth is straining food resources, exerting unprecedented pressure on agricultural systems to achieve higher yields and food security. Plant genotyping equipment is one critical technology in the pursuit to identify crop traits that will enhance yield and resistance to disease. By analyzing the genetic structure of plants, relevant traits can be identified and selected for the rushed development of improved crop types. This genotypic knowledge also allows for the breeding of both high-yield and disease-resistant types of crops that reduce the need for pest control chemicals and promote alternate sustainable farming strategies. The adoption of this advanced equipment results from the need to feed an ever-growing world population that continually encounters such challenges as climate change, land degradation, and inadequate availability of this crucial resource. High rates of food production are only achievable with plant testing genotyping tool, since tens of thousands of plants can be screened quickly and only the best promoted. This technology is therefore critical to the satisfaction of both the food and nutrition demands of the swelling population.
Personalized agriculture adoption fuels the plant genotyping equipment market as it allows selection of seeds optimized for specific environments.
Personalized agriculture is becoming increasingly popular as the optimum way to grow crops by fitting the practice into the site-specifics of the environment. It allows for choosing the right crops and their variety types based on the particular condition of the site with its own climate, soil, pests, etc. Personalized agriculture uses plant genotyping equipment to select seeds with specific acclimated characteristics, breeding seeds that will perform best in a specific area. The farmers’ understanding of the plants’ genetic data enables them to know how much fertilizer the plant needs, how much water to provide it with, and how the pest will resist it. It plays a major role in increasing the overall crop yield and sustainability as it reduces the over-use of fertilizers, pesticides, and water. Utilizing the plant genotyping equipment to personalize the crop selection to the local conditions, the technology becomes increasingly essential for more farmers to make the transition toward environmentally friendly farm practices. More and more farmers are becoming environmentally conscious meaning that the demand for the plant genotyping equipment is set to increase in the future.
RESTRAIN
Advancements in alternative breeding methods like gene editing could challenge the dominance of plant genotyping equipment in the future.
The advancements in alternative breeding methods, in particular, a new approach, CRISPR-Cas9, has a potential to challenge plant genotyping equipment. Whereas, a new method enables scientists to conduct accurate adjustments to the DNA coding of the plant, making it possible to directly change its characteristics to achieve better yield and resistance to various diseases and stresses. The standard breeding would take dozens of generations to transform the characteristics of the plant. This way, the need in plant genotyping equipment and special technology would diminish due to them not being used to analyze different traits any longer. In addition, a new gene-editing approach can either suppress particular genes or introduce one, whereas plant genotyping does not allow for such a level of specifics. Therefore, simple, and inexpensive gene-editing methods would replace traditional breeding and plant genotyping equipment. Although such a solution is not instantaneous as they still must develop plants, the method would allow for the faster and simpler development of new varieties. The chances are high that simple and cheap options would become preferable to traditional methods. As a result, one would observe a decreased demand for expensive equipment. On the other hand, the integration of both technologies would be highly beneficial as gene editing would be used for the development of innovations. At the same time, plant genotyping technologies and equipment would be used to study the characteristics of cultivated plants.
By Equipment
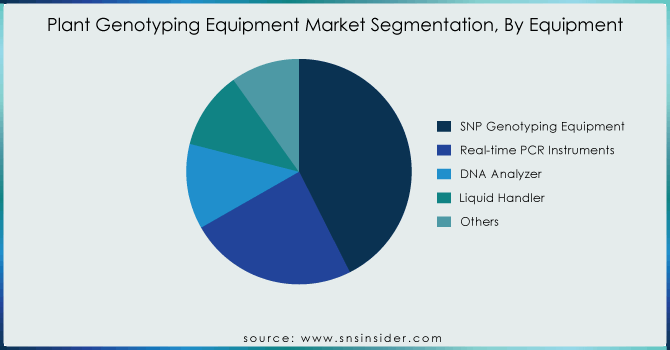
The SNP genotyping equipment segment dominated the market in 2023 and has the largest revenue share of 42.56%. The liquid handler segment is expected to exhibit the highest CAGR of forecasted period. SNPs are small DNA sequence variations that are related to desired plant traits. In combination with QTL mapping, SNPs are used for the delivery of assays to establish marker-supported selection programs aimed at improving or augmenting plant characteristics such as enhanced resistance to pests, better tolerance to stress, or increased yield.
Get Customized Report as per your Business Requirement - Request For Customized Report
By Application
The breeding segment was leading and has the largest revenue share of 42.29% in 2023 and is expected to retain over the forecast period. Genotype-By-Sequencing has unlocked new opportunities in plant genetics and plant breeding research, as it is a proficient, cost-effective multiplexed sequencing and genome-wide scanning platforms. Further, the recent advances in GBS have led to the development of Marker-Assisted Selection tool to accelerate crop improvement and plant breeding. The tool has been widely used in plant breeding to improve crop quality, yield, or tolerance to abiotic or biotic stresses.
By End Use
The laboratory segment was a leading segment and has the largest revenue share of 40.32% in 2023. The presence of a significant number of research labs using plant genotyping to examine several applied and fundamental aspects of plants.
The greenhouse segment is anticipated to present the highest CAGR of more than 9.42% over the forecast period. A rise in demand for genotyping platforms to be deployed in greenhouses in recent years.
REGIONAL ANALYSIS
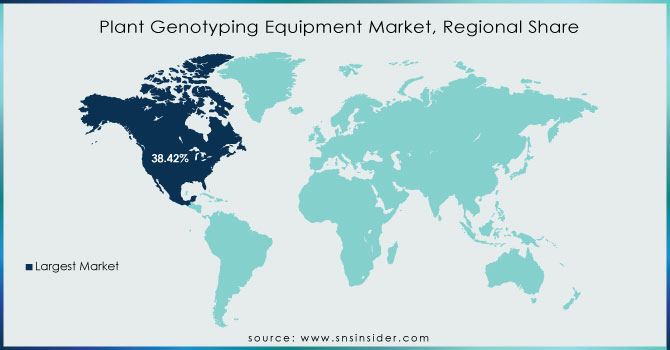
North America dominated the market and accounted for the largest revenue share of 38.42% in 2023. The United States, in particular, has a well-hooked up agricultural and biotechnology region, which drives the call for a superior plant genotyping device. The presence of main biotech groups and studies institutions, mixed with considerable investments in agriculture and genomics research, has contributed to North America’s dominance in this marketplace. Additionally, favourable authorities’ guidelines and projects aimed at enhancing crop yield and food safety have, in addition, inspired the adoption of genotyping technology in the vicinity.
Asia-Pacific is expected to register the highest CAGR of 24.44% over the forecast period. In particular, countries like China and India, has emerged because of the fastest-growing vicinity within the world plant genotyping device market. The location’s rapid population growth and increasing meals demand have brought about a focal point on the development of crop productivity and first-rate. Governments and personal companies are investing considerably in agriculture studies and biotechnology, leading to a surge in the adoption of plant genotyping devices.
The major Players are Agilent Technologies Inc., BGI Genomics, Eurofins Scientific, Evogene Ltd., Illumina Inc., LGC Biosearch Technologies, Merck KgaA, Oxford Nanopore Technologies Limited, PerkinElmer Inc., Promega Corporation, Thermo Fisher Scientific and others.
Recent Developments
In April 2023: PerkinElmer Inc. Released the Genotyper Flex for Plants, an excessive-throughput SNP genotyping instrument for plant breeding and research. The device makes use of the Genotyper Flex platform to genotype up to 1,000 SNPs in an unmarried response.
In May 2023: Eurofins Scientific launched the Plant Genotyping Services, a set of genotyping services for plant breeding and studies. The services encompass SNP genotyping, DNA sequencing, and bioinformatics analysis.
| Report Attributes | Details |
|---|---|
| Market Size in 2023 | US$ 751.85 Million |
| Market Size by 2032 | US$ 1662.43 Million |
| CAGR | CAGR of 9.22% From 2024 to 2032 |
| Base Year | 2023 |
| Forecast Period | 2024-2032 |
| Historical Data | 2020-2022 |
| Report Scope & Coverage | Market Size, Segments Analysis, Competitive Landscape, Regional Analysis, DROC & SWOT Analysis, Forecast Outlook |
| Key Segments | • By Equipment (SNP Genotyping Equipment, Real-time PCR Instruments, DNA Analyzer, Liquid Handler, Others) • By Application (Plant Research, Breeding, Product Development, Quality Assessment) • By End Use (Greenhouse, Field, Laboratory) |
| Regional Analysis/Coverage | North America (US, Canada, Mexico), Europe (Eastern Europe [Poland, Romania, Hungary, Turkey, Rest of Eastern Europe] Western Europe] Germany, France, UK, Italy, Spain, Netherlands, Switzerland, Austria, Rest of Western Europe]), Asia Pacific (China, India, Japan, South Korea, Vietnam, Singapore, Australia, Rest of Asia Pacific), Middle East & Africa (Middle East [UAE, Egypt, Saudi Arabia, Qatar, Rest of Middle East], Africa [Nigeria, South Africa, Rest of Africa], Latin America (Brazil, Argentina, Colombia, Rest of Latin America) |
| Company Profiles | Agilent Technologies Inc., BGI Genomics, Eurofins Scientific, Evogene Ltd., Illumina Inc., LGC Biosearch Technologies, Merck KgaA, Oxford Nanopore Technologies Limited, PerkinElmer Inc., Promega Corporation, Thermo Fisher Scientific |
| Key Drivers | • Increased pressure to feed a growing population drives demand for plant genotyping equipment to identify traits for higher yield and disease resistance in crops. • Personalized agriculture adoption fuels the plant genotyping equipment market as it allows selection of seeds optimized for specific environments. |
| RESTRAINTS | • Advancements in alternative breeding methods like gene editing could challenge the dominance of plant genotyping equipment in the future. |
Ans: The Plant Genotyping Equipment Market is expected to grow at a CAGR of 9.22%.
Ans: Plant Genotyping Equipment Market size was USD 751.85 billion in 2023 and is expected to Reach USD 1662.43 billion by 2032.
Ans: Breeding is the dominating segment by application in the Plant Genotyping Equipment Market.
Ans: Personalized agriculture adoption fuels the plant genotyping equipment market as it allows selection of seeds optimized for specific environments.
Ans: North America is the dominating region in the Plant Genotyping Equipment Market.
TABLE OF CONTENTS
1. Introduction
1.1 Market Definition
1.2 Scope
1.3 Research Assumptions
2. Industry Flowchart
3. Research Methodology
4. Market Dynamics
4.1 Drivers
4.2 Restraints
5. Porter’s 5 Forces Model
6. Pest Analysis
7. Plant Genotyping Equipment Market Segmentation by Equipment
7.1 Introduction
7.2 SNP Genotyping Equipment
7.3 Real-time PCR Instruments
7.4 DNA Analyzer
7.5 Liquid Handler
7.6 Others
8. Plant Genotyping Equipment Market Segmentation by Application
8.1 Introduction
8.2 Plant Research
8.3 Breeding
8.4 Product Development
8.5 Quality Assessment
9. Plant Genotyping Equipment Market Segmentation by End-User
9.1 Introduction
9.2 Greenhouse
9.3 Field
9.4 Laboratory
10. Regional Analysis
10.1 Introduction
10.2 North America
10.2.1 Trend Analysis
10.2.2 North America Plant Genotyping Equipment Market by Country
10.2.3 North America Plant Genotyping Equipment Market by Equipment
10.2.4 North America Plant Genotyping Equipment Market by Application
10.2.5 North America Plant Genotyping Equipment Market by End-User
10.2.6 USA
10.2.6.1 USA Plant Genotyping Equipment Market by Equipment
10.2.6.2 USA Plant Genotyping Equipment Market by Application
10.2.6.3 USA Plant Genotyping Equipment Market by End-User
10.2.7 Canada
10.2.7.1 Canada Plant Genotyping Equipment Market by Equipment
10.2.7.2 Canada Plant Genotyping Equipment Market by Application
10.2.7.3 Canada Plant Genotyping Equipment Market by End-User
10.2.8 Mexico
10.2.8.1 Mexico Plant Genotyping Equipment Market by Equipment
10.2.8.2 Mexico Plant Genotyping Equipment Market by Application
10.2.8.3 Mexico Plant Genotyping Equipment Market by End-User
10.3 Europe
10.3.1 Trend Analysis
10.3.2 Eastern Europe
10.3.2.1 Eastern Europe Plant Genotyping Equipment Market by Country
10.3.2.2 Eastern Europe Plant Genotyping Equipment Market by Equipment
10.3.2.3 Eastern Europe Plant Genotyping Equipment Market by Application
10.3.2.4 Eastern Europe Plant Genotyping Equipment Market by End-User
10.3.2.5 Poland
10.3.2.5.1 Poland Plant Genotyping Equipment Market by Equipment
10.3.2.5.2 Poland Plant Genotyping Equipment Market by Application
10.3.2.5.3 Poland Plant Genotyping Equipment Market by End-User
10.3.2.6 Romania
10.3.2.6.1 Romania Plant Genotyping Equipment Market by Equipment
10.3.2.6.2 Romania Plant Genotyping Equipment Market by Application
10.3.2.6.4 Romania Plant Genotyping Equipment Market by End-User
10.3.2.7 Hungary
10.3.2.7.1 Hungary Plant Genotyping Equipment Market by Equipment
10.3.2.7.2 Hungary Plant Genotyping Equipment Market by Application
10.3.2.7.3 Hungary Plant Genotyping Equipment Market by End-User
10.3.2.8 Turkey
10.3.2.8.1 Turkey Plant Genotyping Equipment Market by Equipment
10.3.2.8.2 Turkey Plant Genotyping Equipment Market by Application
10.3.2.8.3 Turkey Plant Genotyping Equipment Market by End-User
10.3.2.9 Rest of Eastern Europe
10.3.2.9.1 Rest of Eastern Europe Plant Genotyping Equipment Market by Equipment
10.3.2.9.2 Rest of Eastern Europe Plant Genotyping Equipment Market by Application
10.3.2.9.3 Rest of Eastern Europe Plant Genotyping Equipment Market by End-User
10.3.3 Western Europe
10.3.3.1 Western Europe Plant Genotyping Equipment Market by Country
10.3.3.2 Western Europe Plant Genotyping Equipment Market by Equipment
10.3.3.3 Western Europe Plant Genotyping Equipment Market by Application
10.3.3.4 Western Europe Plant Genotyping Equipment Market by End-User
10.3.3.5 Germany
10.3.3.5.1 Germany Plant Genotyping Equipment Market by Equipment
10.3.3.5.2 Germany Plant Genotyping Equipment Market by Application
10.3.3.5.3 Germany Plant Genotyping Equipment Market by End-User
10.3.3.6 France
10.3.3.6.1 France Plant Genotyping Equipment Market by Equipment
10.3.3.6.2 France Plant Genotyping Equipment Market by Application
10.3.3.6.3 France Plant Genotyping Equipment Market by End-User
10.3.3.7 UK
10.3.3.7.1 UK Plant Genotyping Equipment Market by Equipment
10.3.3.7.2 UK Plant Genotyping Equipment Market by Application
10.3.3.7.3 UK Plant Genotyping Equipment Market by End-User
10.3.3.8 Italy
10.3.3.8.1 Italy Plant Genotyping Equipment Market by Equipment
10.3.3.8.2 Italy Plant Genotyping Equipment Market by Application
10.3.3.8.3 Italy Plant Genotyping Equipment Market by End-User
10.3.3.9 Spain
10.3.3.9.1 Spain Plant Genotyping Equipment Market by Equipment
10.3.3.9.2 Spain Plant Genotyping Equipment Market by Application
10.3.3.9.3 Spain Plant Genotyping Equipment Market by End-User
10.3.3.10 Netherlands
10.3.3.10.1 Netherlands Plant Genotyping Equipment Market by Equipment
10.3.3.10.2 Netherlands Plant Genotyping Equipment Market by Application
10.3.3.10.3 Netherlands Plant Genotyping Equipment Market by End-User
10.3.3.11 Switzerland
10.3.3.11.1 Switzerland Plant Genotyping Equipment Market by Equipment
10.3.3.11.2 Switzerland Plant Genotyping Equipment Market by Application
10.3.3.11.3 Switzerland Plant Genotyping Equipment Market by End-User
10.3.3.12 Austria
10.3.3.12.1 Austria Plant Genotyping Equipment Market by Equipment
10.3.3.12.2 Austria Plant Genotyping Equipment Market by Application
10.3.3.12.3 Austria Plant Genotyping Equipment Market by End-User
10.3.3.13 Rest of Western Europe
10.3.3.13.1 Rest of Western Europe Plant Genotyping Equipment Market by Equipment
10.3.3.13.2 Rest of Western Europe Plant Genotyping Equipment Market by Application
10.3.3.13.3 Rest of Western Europe Plant Genotyping Equipment Market by End-User
10.4 Asia-Pacific
10.4.1 Trend Analysis
10.4.2 Asia-Pacific Plant Genotyping Equipment Market by Country
10.4.3 Asia-Pacific Plant Genotyping Equipment Market by Equipment
10.4.4 Asia-Pacific Plant Genotyping Equipment Market by Application
10.4.5 Asia-Pacific Plant Genotyping Equipment Market by End-User
10.4.6 China
10.4.6.1 China Plant Genotyping Equipment Market by Equipment
10.4.6.2 China Plant Genotyping Equipment Market by Application
10.4.6.3 China Plant Genotyping Equipment Market by End-User
10.4.7 India
10.4.7.1 India Plant Genotyping Equipment Market by Equipment
10.4.7.2 India Plant Genotyping Equipment Market by Application
10.4.7.3 India Plant Genotyping Equipment Market by End-User
10.4.8 Japan
10.4.8.1 Japan Plant Genotyping Equipment Market by Equipment
10.4.8.2 Japan Plant Genotyping Equipment Market by Application
10.4.8.3 Japan Plant Genotyping Equipment Market by End-User
10.4.9 South Korea
10.4.9.1 South Korea Plant Genotyping Equipment Market by Equipment
10.4.9.2 South Korea Plant Genotyping Equipment Market by Application
10.4.9.3 South Korea Plant Genotyping Equipment Market by End-User
10.4.10 Vietnam
10.4.10.1 Vietnam Plant Genotyping Equipment Market by Equipment
10.4.10.2 Vietnam Plant Genotyping Equipment Market by Application
10.4.10.3 Vietnam Plant Genotyping Equipment Market by End-User
10.4.11 Singapore
10.4.11.1 Singapore Plant Genotyping Equipment Market by Equipment
10.4.11.2 Singapore Plant Genotyping Equipment Market by Application
10.4.11.3 Singapore Plant Genotyping Equipment Market by End-User
10.4.12 Australia
10.4.12.1 Australia Plant Genotyping Equipment Market by Equipment
10.4.12.2 Australia Plant Genotyping Equipment Market by Application
10.4.12.3 Australia Plant Genotyping Equipment Market by End-User
10.4.13 Rest of Asia-Pacific
10.4.13.1 Rest of Asia-Pacific Plant Genotyping Equipment Market by Equipment
10.4.13.2 Rest of Asia-Pacific Plant Genotyping Equipment Market by Application
10.4.13.3 Rest of Asia-Pacific Plant Genotyping Equipment Market by End-User
10.5 Middle East & Africa
10.5.1 Trend Analysis
10.5.2 Middle East
10.5.2.1 Middle East Plant Genotyping Equipment Market by Country
10.5.2.2 Middle East Plant Genotyping Equipment Market by Equipment
10.5.2.3 Middle East Plant Genotyping Equipment Market by Application
10.5.2.4 Middle East Plant Genotyping Equipment Market by End-User
10.5.2.5 UAE
10.5.2.5.1 UAE Plant Genotyping Equipment Market by Equipment
10.5.2.5.2 UAE Plant Genotyping Equipment Market by Application
10.5.2.5.3 UAE Plant Genotyping Equipment Market by End-User
10.5.2.6 Egypt
10.5.2.6.1 Egypt Plant Genotyping Equipment Market by Equipment
10.5.2.6.2 Egypt Plant Genotyping Equipment Market by Application
10.5.2.6.3 Egypt Plant Genotyping Equipment Market by End-User
10.5.2.7 Saudi Arabia
10.5.2.7.1 Saudi Arabia Plant Genotyping Equipment Market by Equipment
10.5.2.7.2 Saudi Arabia Plant Genotyping Equipment Market by Application
10.5.2.7.3 Saudi Arabia Plant Genotyping Equipment Market by End-User
10.5.2.8 Qatar
10.5.2.8.1 Qatar Plant Genotyping Equipment Market by Equipment
10.5.2.8.2 Qatar Plant Genotyping Equipment Market by Application
10.5.2.8.3 Qatar Plant Genotyping Equipment Market by End-User
10.5.2.9 Rest of Middle East
10.5.2.9.1 Rest of Middle East Plant Genotyping Equipment Market by Equipment
10.5.2.9.2 Rest of Middle East Plant Genotyping Equipment Market by Application
10.5.2.9.3 Rest of Middle East Plant Genotyping Equipment Market by End-User
10.5.3 Africa
10.5.3.1 Africa Plant Genotyping Equipment Market by Country
10.5.3.2 Africa Plant Genotyping Equipment Market by Equipment
10.5.3.3 Africa Plant Genotyping Equipment Market by Application
10.5.3.4 Africa Plant Genotyping Equipment Market by End-User
10.5.3.5 Nigeria
10.5.3.5.1 Nigeria Plant Genotyping Equipment Market by Equipment
10.5.3.5.2 Nigeria Plant Genotyping Equipment Market by Application
10.5.3.5.3 Nigeria Plant Genotyping Equipment Market by End-User
10.5.3.6 South Africa
10.5.3.6.1 South Africa Plant Genotyping Equipment Market by Equipment
10.5.3.6.2 South Africa Plant Genotyping Equipment Market by Application
10.5.3.6.3 South Africa Plant Genotyping Equipment Market by End-User
10.5.3.7 Rest of Africa
10.5.3.7.1 Rest of Africa Plant Genotyping Equipment Market by Equipment
10.5.3.7.2 Rest of Africa Plant Genotyping Equipment Market by Application
10.5.3.7.3 Rest of Africa Plant Genotyping Equipment Market by End-User
10.6 Latin America
10.6.1 Trend Analysis
10.6.2 Latin America Plant Genotyping Equipment Market by Country
10.6.3 Latin America Plant Genotyping Equipment Market by Equipment
10.6.4 Latin America Plant Genotyping Equipment Market by Application
10.6.5 Latin America Plant Genotyping Equipment Market by End-User
10.6.6 Brazil
10.6.6.1 Brazil Plant Genotyping Equipment Market by Equipment
10.6.6.2 Brazil Plant Genotyping Equipment Market by Application
10.6.6.3 Brazil Plant Genotyping Equipment Market by End-User
10.6.7 Argentina
10.6.7.1 Argentina Plant Genotyping Equipment Market by Equipment
10.6.7.2 Argentina Plant Genotyping Equipment Market by Application
10.6.7.3 Argentina Plant Genotyping Equipment Market by End-User
10.6.8 Colombia
10.6.8.1 Colombia Plant Genotyping Equipment Market by Equipment
10.6.8.2 Colombia Plant Genotyping Equipment Market by Application
10.6.8.3 Colombia Plant Genotyping Equipment Market by End-User
10.6.9 Rest of Latin America
10.6.9.1 Rest of Latin America Plant Genotyping Equipment Market by Equipment
10.6.9.2 Rest of Latin America Plant Genotyping Equipment Market by Application
10.6.9.3 Rest of Latin America Plant Genotyping Equipment Market by End-User
11. Company Profiles
11.1 Agilent Technologies Inc.
11.1.1 Company Overview
11.1.2 Financial
11.1.3 Products/ Services Offered
11.1.4 The SNS View
11.2 BGI Genomics
11.2.1 Company Overview
11.2.2 Financial
11.2.3 Products/ Services Offered
11.2.4 The SNS View
11.3 Eurofins Scientific
11.3.1 Company Overview
11.3.2 Financial
11.3.3 Products/ Services Offered
11.3.4 The SNS View
11.4 Evogene Ltd.
11.4.1 Company Overview
11.4.2 Financial
11.4.3 Products/ Services Offered
11.4.4 The SNS View
11.5 Illumina Inc.
11.5.1 Company Overview
11.5.2 Financial
11.5.3 Products/ Services Offered
11.5.4 The SNS View
11.6 LGC Biosearch Technologies
11.6.1 Company Overview
11.6.2 Financial
11.6.3 Products/ Services Offered
11.6.4 The SNS View
11.7 Merck KgaA
11.7.1 Company Overview
11.7.2 Financial
11.7.3 Products/ Services Offered
11.7.4 The SNS View
11.8 Oxford Nanopore Technologies Limited
11.8.1 Company Overview
11.8.2 Financial
11.8.3 Products/ Services Offered
11.8.4 The SNS View
11.9 PerkinElmer Inc.
11.9.1 Company Overview
11.9.2 Financial
11.9.3 Products/ Services Offered
11.9.4 The SNS View
11.10 Promega Corporation
11.10.1 Company Overview
11.10.2 Financial
11.10.3 Products/ Services Offered
11.10.4 The SNS View
12. Competitive Landscape
12.1 Competitive Benchmarking
12.2 Market Share Analysis
12.3 Recent Developments
12.3.1 Industry News
12.3.2 Company News
12.3.3 Mergers & Acquisitions
13. Use Case and Best Practices
14. Conclusion
An accurate research report requires proper strategizing as well as implementation. There are multiple factors involved in the completion of good and accurate research report and selecting the best methodology to compete the research is the toughest part. Since the research reports we provide play a crucial role in any company’s decision-making process, therefore we at SNS Insider always believe that we should choose the best method which gives us results closer to reality. This allows us to reach at a stage wherein we can provide our clients best and accurate investment to output ratio.
Each report that we prepare takes a timeframe of 350-400 business hours for production. Starting from the selection of titles through a couple of in-depth brain storming session to the final QC process before uploading our titles on our website we dedicate around 350 working hours. The titles are selected based on their current market cap and the foreseen CAGR and growth.
The 5 steps process:
Step 1: Secondary Research:
Secondary Research or Desk Research is as the name suggests is a research process wherein, we collect data through the readily available information. In this process we use various paid and unpaid databases which our team has access to and gather data through the same. This includes examining of listed companies’ annual reports, Journals, SEC filling etc. Apart from this our team has access to various associations across the globe across different industries. Lastly, we have exchange relationships with various university as well as individual libraries.

Step 2: Primary Research
When we talk about primary research, it is a type of study in which the researchers collect relevant data samples directly, rather than relying on previously collected data. This type of research is focused on gaining content specific facts that can be sued to solve specific problems. Since the collected data is fresh and first hand therefore it makes the study more accurate and genuine.
We at SNS Insider have divided Primary Research into 2 parts.
Part 1 wherein we interview the KOLs of major players as well as the upcoming ones across various geographic regions. This allows us to have their view over the market scenario and acts as an important tool to come closer to the accurate market numbers. As many as 45 paid and unpaid primary interviews are taken from both the demand and supply side of the industry to make sure we land at an accurate judgement and analysis of the market.
This step involves the triangulation of data wherein our team analyses the interview transcripts, online survey responses and observation of on filed participants. The below mentioned chart should give a better understanding of the part 1 of the primary interview.

Part 2: In this part of primary research the data collected via secondary research and the part 1 of the primary research is validated with the interviews from individual consultants and subject matter experts.
Consultants are those set of people who have at least 12 years of experience and expertise within the industry whereas Subject Matter Experts are those with at least 15 years of experience behind their back within the same space. The data with the help of two main processes i.e., FGDs (Focused Group Discussions) and IDs (Individual Discussions). This gives us a 3rd party nonbiased primary view of the market scenario making it a more dependable one while collation of the data pointers.
Step 3: Data Bank Validation
Once all the information is collected via primary and secondary sources, we run that information for data validation. At our intelligence centre our research heads track a lot of information related to the market which includes the quarterly reports, the daily stock prices, and other relevant information. Our data bank server gets updated every fortnight and that is how the information which we collected using our primary and secondary information is revalidated in real time.

Step 4: QA/QC Process
After all the data collection and validation our team does a final level of quality check and quality assurance to get rid of any unwanted or undesired mistakes. This might include but not limited to getting rid of the any typos, duplication of numbers or missing of any important information. The people involved in this process include technical content writers, research heads and graphics people. Once this process is completed the title gets uploader on our platform for our clients to read it.
Step 5: Final QC/QA Process:
This is the last process and comes when the client has ordered the study. In this process a final QA/QC is done before the study is emailed to the client. Since we believe in giving our clients a good experience of our research studies, therefore, to make sure that we do not lack at our end in any way humanly possible we do a final round of quality check and then dispatch the study to the client.
Key Segments
By Equipment
By Application
By End Use
Request for Segment Customization as per your Business Requirement: Segment Customization Request
Regional Coverage
North America
Europe
Asia Pacific
Middle East & Africa
Latin America
Request for Country Level Research Report: Country Level Customization Request
Available Customization
With the given market data, SNS Insider offers customization as per the company’s specific needs. The following customization options are available for the report:
The 3D Printing Construction Market Size was valued at USD 36.71 million in 2023 and it is expected to reach USD 20556 million by 2032, growing at a compounded annual growth rate (CAGR) of 102% between 2024 and 2032.
The Cold Chain Equipment Market was valued at USD 21.40 billion in 2023, and it is expected to reach USD 110.41 billion by 2032, registering a CAGR of 20.06% from 2024 to 2032.
The Carbonization Furnace Market Size was valued at USD 238.96 Million in 2023 and is expected to reach USD 564.19 Million by 2032 and grow at a CAGR of 10.07% over the forecast period 2024-2032.
Oilfield Equipment Market was esteemed at USD 109.20 billion in 2023 and is supposed to arrive at USD 146.15 billion by 2032, at a CAGR of 3.29% from 2024-2032.
The Non-Destructive Testing Market size is value USD 20.56 Billion in 2023 and is expected to reach USD 39.79 Billion by 2032 with a growing CAGR of 7.61 % over the forecast period 2024-2032.
Microchannel Heat Exchanger Market was estimated at USD 12.91 Bn in 2023 and is expected to reach USD 29.24 Bn by 2032, at a CAGR of 9.51% from 2024-2032.

Hi! Click one of our member below to chat on Phone
© 2025 All Rights Reserved by SNS Insider Pvt Ltd


